Victoriametrics: Ingestion rate per prometheus instance
Is your feature request related to a problem? Please describe.
I want to be able to see ingestion rate per a specific label, but don't quite know how to go about it.
Describe the solution you'd like
Query ingestion and/or request rate to VM based on a custom label like prometheus_server_name
Describe alternatives you've considered
Counting number of distinct occurrences of a metric with a label I expect all my instances to have.
Additional context
The existing ingestion rate graph is very nice, but I don't know how to go about grouping them by a time series label like one applied by Prometheus' remote_write.external_label.
 stigok
All 6 comments
Hi @stigok!
VM doesn't distinguish writers by labels. What you can do is to query Prometheus metric prometheus_remote_storage_succeeded_samples_total. Let's assume your external label for Prometheus is datacenter:
global:
  external_labels:
    datacenter: dc-123
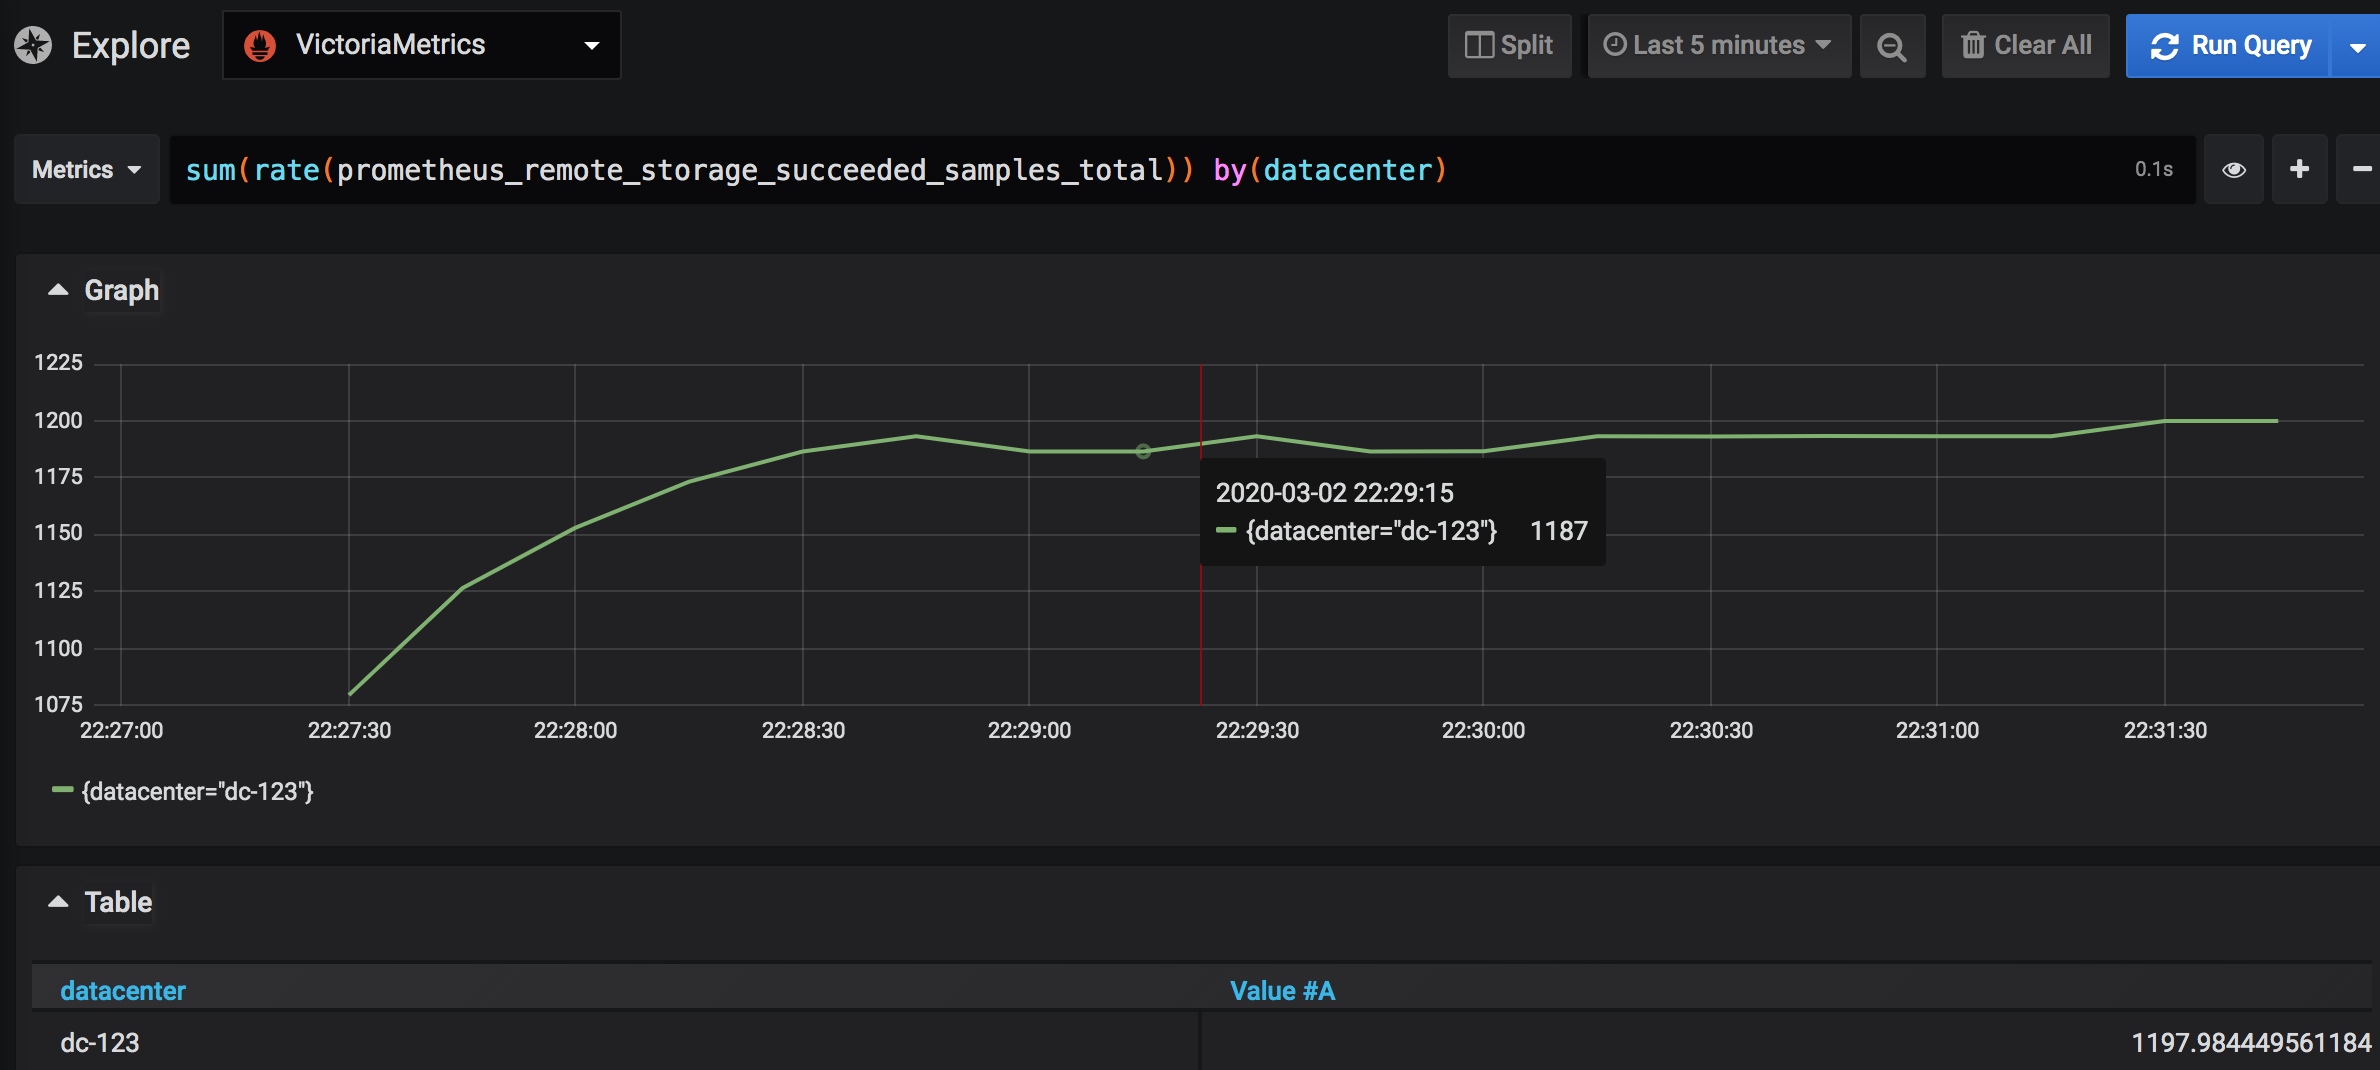
Then to see the ingestion rate by all Proms try to execute following query(use VM as datasource):
sum(rate(prometheus_remote_storage_succeeded_samples_total)) by(datacenter)
The same works for any other label or combination of labels.
 hagen1778
on 2 Mar 2020
hagen1778
on 2 Mar 2020
Thanks for the suggestion. However, this only works if prometheus_remote_storage_succeeded_samples_total is scraped on all datacenters (in this example). Or maybe scraping Prometheus is a fair thing to expect all instances to do? I will probably end up doing that, i.e. self-scraping.
stigok
on 3 Mar 2020
The prometheus_ like metrics are self-scraped by Prometheus under any circumstances, this is not even configurable AFAIK. So you can count on having this metric on every Prometheus that is configured with remote_write.
hagen1778
on 3 Mar 2020
If that's true, I got some problems with my current setup. I will look into it. Thanks :)
stigok
on 3 Mar 2020
To clarify after I made this work properly for ourselves: prometheus_ metrics are not scraped under all circumstances by default. Using the Kubernetes Prometheus operator you must configure your own ServiceMonitor to explicitly enable scraping unless you have configured other rules to catch this automagically.
apiVersion: monitoring.coreos.com/v1
kind: ServiceMonitor
metadata:
  name: prometheus-operated
  namespace: ${namespace}
spec:
  endpoints:
  - honorLabels: true
    port: web
  namespaceSelector:
    any: false
    matchNames:
    - ${namespace}
  selector:
    matchLabels:
      operated-prometheus: "true"
Now I can set up a graph with two queries; the first as reference value, the second one to measure ingestion per remote_write.external_label:
sum(rate(vm_rows_inserted_total{job="$job"}[$__interval])) by (type) > 0
sum(rate(prometheus_remote_storage_succeeded_samples_total{metrics_source!=""})) by(metrics_source)
Gives me a dash like this:
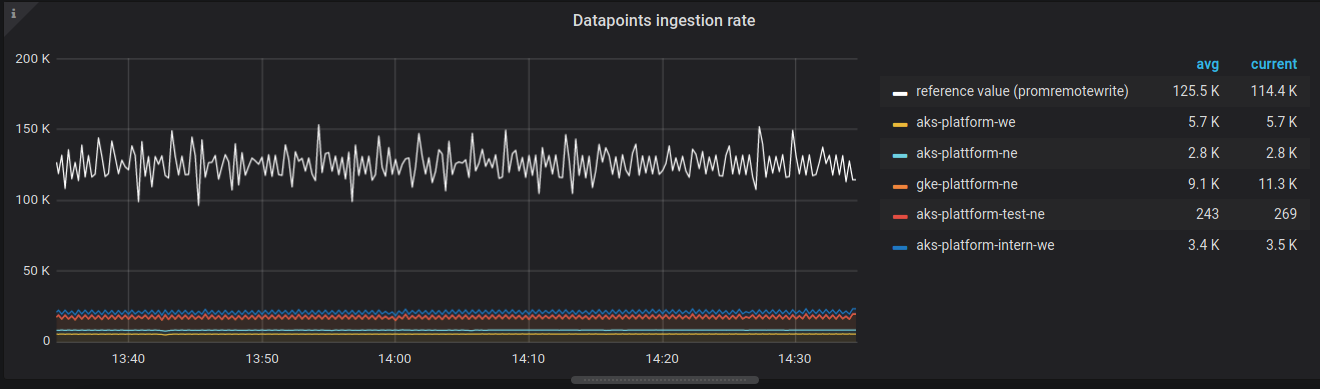
Now, this gives me an indication that I'm not self-scraping all Prometheus instances. When I've done it correctly, the totals will match the reference values.
Thanks for the help getting here :)
stigok
on 5 Mar 2020
Oh, well... my bad. I'm so get used to practice of setting self-scraping job for any Prometheus I've ever ran that having own metrics in Prometheus was like a general truth. So sorry for saying wrong info to you. I hope everything is cool now!
hagen1778
on 5 Mar 2020
Related issues
 sh0rez
·
3Comments
sh0rez
·
3Comments
 faceair
·
3Comments
faceair
·
3Comments
 n4mine
·
3Comments
n4mine
·
3Comments
 isality
·
3Comments
isality
·
3Comments
 v98765
·
3Comments
v98765
·
3Comments