Victoriametrics: Metrics Values differ between Promtheus and VictoriaMetrics (sum(...) by)
Describe the bug
When the following query is executed by grafana, we expect that the two results should be returned.
However victoria metrics returned the one value.
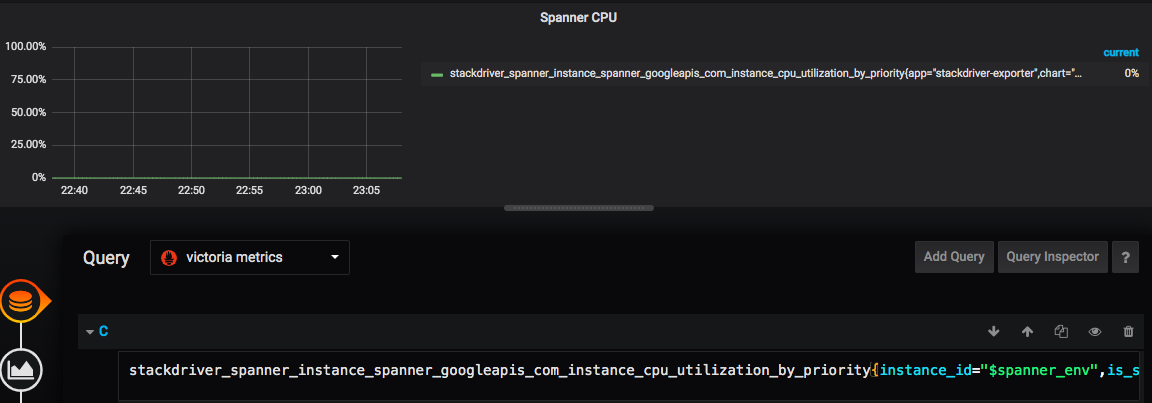
sum(stackdriver_spanner_instance_spanner_googleapis_com_instance_cpu_utilization_by_priority{instance_id="$spanner_env",is_system="false"}) by (priority)
When we execute the above query, the prometheus returns array2.
The object1 is priority: "low". The object2 is priority: "high".
In victoria metrics case, it returns array1.
So victoria metrics or prometheus remote write may drop the object2 metrics.
To Reproduce
Expected behavior
When the following query is executed to victoria metrics, it returns array2
sum(stackdriver_spanner_instance_spanner_googleapis_com_instance_cpu_utilization_by_priority{instance_id="$spanner_env",is_system="false"}) by (priority)
Screenshots

Left side is the prometheus and the right side is victoria metrics.
Version
# Running on GKE v1.13.11-gke.14
victoriametrics/vminsert:v1.33.1-cluster
victoriametrics/vmselect:v1.33.1-cluster
victoriametrics/vmstorage:v1.33.1-cluster
Used command-line flags
# vmstorage
flag{name="bigMergeConcurrency", value="0"} 1
flag{name="dedup.minScrapeInterval", value="0s"} 1
flag{name="enableTCP6", value="false"} 1
flag{name="envflag.enable", value="false"} 1
flag{name="fs.disableMmap", value="false"} 1
flag{name="http.disableResponseCompression", value="false"} 1
flag{name="httpListenAddr", value=":8482"} 1
flag{name="loggerFormat", value="default"} 1
flag{name="loggerLevel", value="INFO"} 1
flag{name="loggerOutput", value="stderr"} 1
flag{name="memory.allowedPercent", value="60"} 1
flag{name="precisionBits", value="64"} 1
flag{name="retentionPeriod", value="24"} 1
flag{name="rpc.disableCompression", value="false"} 1
flag{name="search.maxTagKeys", value="secret"} 1
flag{name="search.maxTagValues", value="100000"} 1
flag{name="search.maxUniqueTimeseries", value="1000000"} 1
flag{name="smallMergeConcurrency", value="0"} 1
flag{name="snapshotAuthKey", value="secret"} 1
flag{name="storageDataPath", value="/storage"} 1
flag{name="version", value="false"} 1
flag{name="vminsertAddr", value=":8401"} 1
flag{name="vmselectAddr", value=":8400"} 1
Additional context
We always execute the following queries.
# user - {{ priority }}
sum(stackdriver_spanner_instance_spanner_googleapis_com_instance_cpu_utilization_by_priority{instance_id="$spanner_env",is_system="false"}) by (priority)

# system - {{ priority }}
sum(stackdriver_spanner_instance_spanner_googleapis_com_instance_cpu_utilization_by_priority{instance_id="$spanner_env",is_system="true"}) by (priority)
Now we have trouble in the user - {{ priority }} query.
But we have no trouble in the system - {{ priority }}.
The system - {{ priority }} query returns array2.
If above information isn't enough, please let me know.
Thank for your help.
 govargo
All 13 comments
@govargo , could you provide Prometheus and VictoriaMetrics graphs for the following query:
stackdriver_spanner_instance_spanner_googleapis_com_instance_cpu_utilization_by_priority{instance_id="$spanner_env",is_system="false"}
These graphs should show the difference between time series before applying sum to them.
Please remove user - {{ priority }} string from the Legend field in Grafana and leave blank the field when performing the query above, so full label sets for the returned time series could be compared between Prometheus and VictoriaMetrics.
Also do you use promxy or other proxy for querying VictoriaMetrics from Grafana or you query VictoriaMetrics directly without intermediate proxies?
 valyala
on 18 Feb 2020
valyala
on 18 Feb 2020
@valyala
Thanks for your comment.
I tried to execute above query.
This is the result.
Prometheus

Victoria Metrics
Also do you use promxy or other proxy for querying VictoriaMetrics from Grafana or you query VictoriaMetrics directly without intermediate proxies?
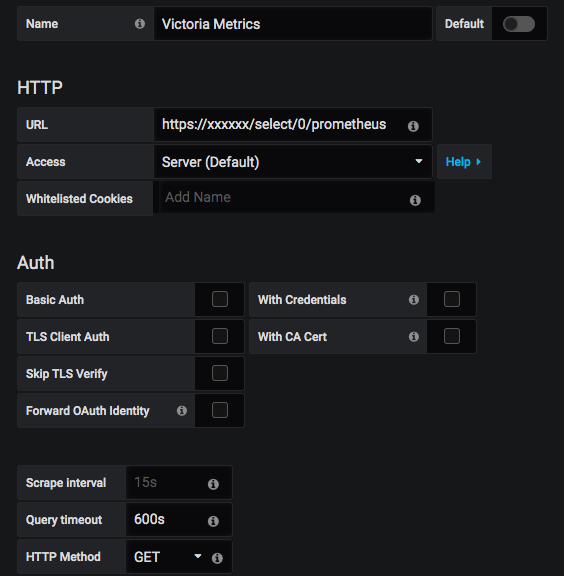
We directly query from Grafana to Victoria Metrics.
This is our Grafana's Datasource Setting(URL is dummy).
This URL is kubernetes ingress host(ingress -> service(NodePort) -> vmselect pod).
govargo
on 18 Feb 2020
These graphs show that Prometheus contains two time series (the first graph), while VictoriaMetrics contains only a single time series. It is likely the second time series wasn't written to VictoriaMetrics due to improperly configured relabeling on Prometheus side, which could result in series drop or to modified labels, which stop matching the original query. See this article for details.
valyala
on 21 Feb 2020
@govargo , are there any updates from your side? Could you post relabeling rules from remote_write section in Prometheus configs, so I could help identifying rules, which may result in dropped series before sending them to VictoriaMetrics?
valyala
on 26 Feb 2020
@valyala
I'm sorry for late.
And thank you for your suggestion.
I checked the prometheus configuration rules. But I couldn't find suspicious anything.
This is our configuration.
global:
  scrape_interval: 1m
  scrape_timeout: 10s
  evaluation_interval: 1m
  external_labels:
    cluster: production-0
alerting:
  alertmanagers:
  - kubernetes_sd_configs:
    - role: pod
    bearer_token_file: /var/run/secrets/kubernetes.io/serviceaccount/token
    tls_config:
      ca_file: /var/run/secrets/kubernetes.io/serviceaccount/ca.crt
      insecure_skip_verify: false
    scheme: http
    timeout: 10s
    api_version: v1
    relabel_configs:
    - source_labels: [__meta_kubernetes_namespace]
      separator: ;
      regex: monitoring
      replacement: $1
      action: keep
    - source_labels: [__meta_kubernetes_pod_label_app]
      separator: ;
      regex: prometheus
      replacement: $1
      action: keep
    - source_labels: [__meta_kubernetes_pod_label_component]
      separator: ;
      regex: alertmanager
      replacement: $1
      action: keep
    - source_labels: [__meta_kubernetes_pod_container_port_number]
      separator: ;
      regex: null
      replacement: $1
      action: drop
rule_files:
- /etc/config/rules
- /etc/config/alerts
scrape_configs:
- job_name: gce-instance-asia-northeast1-c-elasticsearch-exporter
  honor_timestamps: true
  params:
    pattern:
    - .*
  scrape_interval: 1m
  scrape_timeout: 10s
  metrics_path: /metrics
  scheme: http
  gce_sd_configs:
  - project: our-project
    zone: asia-northeast1-c
    refresh_interval: 2m
    port: 9114
    tag_separator: ','
  relabel_configs:
  - source_labels: [__meta_gce_instance_status]
    separator: ;
    regex: (RUNNING)
    target_label: instance_status
    replacement: $1
    action: keep
  - source_labels: [__meta_gce_instance_name]
    separator: ;
    regex: (done-production-elasticsearch-vm)
    target_label: instance
    replacement: $1
    action: keep
  - source_labels: [__meta_gce_instance_name]
    separator: ;
    regex: (gke.*)
    target_label: instance
    replacement: $1
    action: drop
  - source_labels: [__meta_gce_instance_name]
    separator: ;
    regex: (.*)
    target_label: instance
    replacement: $1
    action: replace
- job_name: gce-instance-asia-northeast1-c-node-exporter-for-elasticsearch
  honor_timestamps: true
  params:
    pattern:
    - .*
  scrape_interval: 1m
  scrape_timeout: 10s
  metrics_path: /metrics
  scheme: http
  gce_sd_configs:
  - project: our-project
    zone: asia-northeast1-c
    refresh_interval: 2m
    port: 9100
    tag_separator: ','
  relabel_configs:
  - source_labels: [__meta_gce_instance_status]
    separator: ;
    regex: (RUNNING)
    target_label: instance_status
    replacement: $1
    action: keep
  - source_labels: [__meta_gce_instance_name]
    separator: ;
    regex: (done-production-elasticsearch-vm)
    target_label: instance
    replacement: $1
    action: keep
  - source_labels: [__meta_gce_instance_name]
    separator: ;
    regex: (gke.*)
    target_label: instance
    replacement: $1
    action: drop
  - source_labels: [__meta_gce_instance_name]
    separator: ;
    regex: (.*)
    target_label: instance
    replacement: $1
    action: replace
- job_name: prometheus
  honor_timestamps: true
  scrape_interval: 1m
  scrape_timeout: 10s
  metrics_path: /metrics
  scheme: http
  static_configs:
  - targets:
    - localhost:9090
- job_name: victoriaMetrics
  honor_timestamps: true
  scrape_interval: 1m
  scrape_timeout: 10s
  metrics_path: /metrics
  scheme: http
  static_configs:
  - targets:
    - victoria-metrics-vminsert:8480
    - victoria-metrics-vmselect:8481
    - victoria-metrics-vmstorage:8482
- job_name: kubernetes-apiservers
  honor_timestamps: true
  scrape_interval: 1m
  scrape_timeout: 10s
  metrics_path: /metrics
  scheme: https
  kubernetes_sd_configs:
  - role: endpoints
  bearer_token_file: /var/run/secrets/kubernetes.io/serviceaccount/token
  tls_config:
    ca_file: /var/run/secrets/kubernetes.io/serviceaccount/ca.crt
    insecure_skip_verify: false
  relabel_configs:
  - source_labels: [__meta_kubernetes_namespace, __meta_kubernetes_service_name, __meta_kubernetes_endpoint_port_name]
    separator: ;
    regex: default;kubernetes;https
    replacement: $1
    action: keep
- job_name: kubernetes-nodes
  honor_timestamps: true
  scrape_interval: 1m
  scrape_timeout: 10s
  metrics_path: /metrics
  scheme: https
  kubernetes_sd_configs:
  - role: node
  bearer_token_file: /var/run/secrets/kubernetes.io/serviceaccount/token
  tls_config:
    ca_file: /var/run/secrets/kubernetes.io/serviceaccount/ca.crt
    insecure_skip_verify: true
  relabel_configs:
  - source_labels: [__address__]
    separator: ;
    regex: ^(.*):\d+$
    target_label: __address__
    replacement: $1:9100
    action: replace
  - separator: ;
    regex: (.*)
    target_label: __scheme__
    replacement: http
    action: replace
  - source_labels: [__meta_kubernetes_node_name]
    separator: ;
    regex: (.*)
    target_label: instance
    replacement: $1
    action: replace
  - source_labels: [__meta_kubernetes_node_label_failure_domain_beta_kubernetes_io_zone]
    separator: ;
    regex: (.*)
    target_label: zone
    replacement: $1
    action: replace
  - source_labels: [__meta_kubernetes_node_label_cloud_google_com_gke_nodepool]
    separator: ;
    regex: (.*)
    target_label: gke_nodepool
    replacement: $1
    action: replace
- job_name: kubernetes-kubelet
  honor_timestamps: true
  scrape_interval: 1m
  scrape_timeout: 10s
  metrics_path: /metrics
  scheme: http
  kubernetes_sd_configs:
  - role: node
  relabel_configs:
  - source_labels: [__address__]
    separator: ;
    regex: ^(.*):\d+$
    target_label: __address__
    replacement: $1:10255
    action: replace
  - separator: ;
    regex: (.*)
    target_label: __scheme__
    replacement: http
    action: replace
- job_name: kubernetes-cadvisor
  honor_timestamps: true
  scrape_interval: 1m
  scrape_timeout: 10s
  metrics_path: /metrics
  scheme: https
  kubernetes_sd_configs:
  - role: node
  bearer_token_file: /var/run/secrets/kubernetes.io/serviceaccount/token
  tls_config:
    ca_file: /var/run/secrets/kubernetes.io/serviceaccount/ca.crt
    insecure_skip_verify: false
  relabel_configs:
  - separator: ;
    regex: __meta_kubernetes_node_label_(.+)
    replacement: $1
    action: labelmap
  - separator: ;
    regex: (.*)
    target_label: __address__
    replacement: kubernetes.default.svc:443
    action: replace
  - source_labels: [__meta_kubernetes_node_name]
    separator: ;
    regex: (.+)
    target_label: __metrics_path__
    replacement: /api/v1/nodes/${1}/proxy/metrics/cadvisor
    action: replace
- job_name: kubernetes-service-endpoints
  honor_timestamps: true
  scrape_interval: 1m
  scrape_timeout: 10s
  metrics_path: /metrics
  scheme: http
  kubernetes_sd_configs:
  - role: endpoints
  relabel_configs:
  - source_labels: [__meta_kubernetes_service_annotation_prometheus_io_scrape]
    separator: ;
    regex: "true"
    replacement: $1
    action: keep
  - separator: ;
    regex: __meta_kubernetes_service_label_(.+)
    replacement: $1
    action: labelmap
  - source_labels: [__meta_kubernetes_namespace]
    separator: ;
    regex: (.*)
    target_label: kubernetes_namespace
    replacement: $1
    action: replace
  - source_labels: [__meta_kubernetes_service_name]
    separator: ;
    regex: (.*)
    target_label: kubernetes_service_name
    replacement: $1
    action: replace
- job_name: kubernetes-pod
  honor_timestamps: true
  scrape_interval: 1m
  scrape_timeout: 10s
  metrics_path: /metrics
  scheme: http
  kubernetes_sd_configs:
  - role: pod
  relabel_configs:
  - source_labels: [__meta_kubernetes_pod_annotation_prometheus_io_scrape]
    separator: ;
    regex: "true"
    replacement: $1
    action: keep
  - source_labels: [__meta_kubernetes_pod_container_port_name]
    separator: ;
    regex: metrics(-.*)?
    replacement: $1
    action: keep
  - source_labels: [__address__, __meta_kubernetes_pod_container_port_number]
    separator: ;
    regex: (.+):(?:\d+);(\d+)
    target_label: __address__
    replacement: ${1}:${2}
    action: replace
  - source_labels: [__meta_kubernetes_pod_annotation_prometheus_io_path]
    separator: ;
    regex: (.+)
    target_label: __metrics_path__
    replacement: $1
    action: replace
  - separator: ;
    regex: __meta_kubernetes_pod_label_(.+)
    replacement: $1
    action: labelmap
  - source_labels: [__meta_kubernetes_namespace]
    separator: ;
    regex: (.*)
    target_label: kubernetes_namespace
    replacement: $1
    action: replace
  - source_labels: [__meta_kubernetes_pod_name]
    separator: ;
    regex: (.*)
    target_label: kubernetes_pod_name
    replacement: $1
    action: replace
- job_name: gce-instance-asia-northeast1-a-node-exporter
  honor_timestamps: true
  scrape_interval: 1m
  scrape_timeout: 10s
  metrics_path: /metrics
  scheme: http
  gce_sd_configs:
  - project: our-project
    zone: asia-northeast1-a
    refresh_interval: 2m
    port: 9100
    tag_separator: ','
  relabel_configs:
  - source_labels: [__meta_gce_instance_status]
    separator: ;
    regex: (RUNNING)
    target_label: instance_status
    replacement: $1
    action: keep
  - source_labels: [__meta_gce_instance_name]
    separator: ;
    regex: (prd.*)
    target_label: instance
    replacement: $1
    action: keep
  - source_labels: [__meta_gce_instance_name]
    separator: ;
    regex: (gke.*)
    target_label: instance
    replacement: $1
    action: drop
  - source_labels: [__meta_gce_instance_name]
    separator: ;
    regex: (.*)
    target_label: instance
    replacement: $1
    action: replace
- job_name: gce-instance-asia-northeast1-b-node-exporter
  honor_timestamps: true
  scrape_interval: 1m
  scrape_timeout: 10s
  metrics_path: /metrics
  scheme: http
  gce_sd_configs:
  - project: our-project
    zone: asia-northeast1-b
    refresh_interval: 2m
    port: 9100
    tag_separator: ','
  relabel_configs:
  - source_labels: [__meta_gce_instance_status]
    separator: ;
    regex: (RUNNING)
    target_label: instance_status
    replacement: $1
    action: keep
  - source_labels: [__meta_gce_instance_name]
    separator: ;
    regex: (prd.*)
    target_label: instance
    replacement: $1
    action: keep
  - source_labels: [__meta_gce_instance_name]
    separator: ;
    regex: (gke.*)
    target_label: instance
    replacement: $1
    action: drop
  - source_labels: [__meta_gce_instance_name]
    separator: ;
    regex: (.*)
    target_label: instance
    replacement: $1
    action: replace
- job_name: gce-instance-asia-northeast1-c-node-exporter
  honor_timestamps: true
  scrape_interval: 1m
  scrape_timeout: 10s
  metrics_path: /metrics
  scheme: http
  gce_sd_configs:
  - project: our-project
    zone: asia-northeast1-c
    refresh_interval: 2m
    port: 9100
    tag_separator: ','
  relabel_configs:
  - source_labels: [__meta_gce_instance_status]
    separator: ;
    regex: (RUNNING)
    target_label: instance_status
    replacement: $1
    action: keep
  - source_labels: [__meta_gce_instance_name]
    separator: ;
    regex: (prd.*)
    target_label: instance
    replacement: $1
    action: keep
  - source_labels: [__meta_gce_instance_name]
    separator: ;
    regex: (gke.*)
    target_label: instance
    replacement: $1
    action: drop
  - source_labels: [__meta_gce_instance_name]
    separator: ;
    regex: (.*)
    target_label: instance
    replacement: $1
    action: replace
- job_name: gce-instance-asia-northeast1-a-script-exporter
  honor_timestamps: true
  params:
    pattern:
    - .*
  scrape_interval: 1m
  scrape_timeout: 10s
  metrics_path: /probe
  scheme: http
  gce_sd_configs:
  - project: our-project
    zone: asia-northeast1-a
    refresh_interval: 2m
    port: 9172
    tag_separator: ','
  relabel_configs:
  - source_labels: [__meta_gce_instance_status]
    separator: ;
    regex: (RUNNING)
    target_label: instance_status
    replacement: $1
    action: keep
  - source_labels: [__meta_gce_instance_name]
    separator: ;
    regex: (prd.*)
    target_label: instance
    replacement: $1
    action: keep
  - source_labels: [__meta_gce_instance_name]
    separator: ;
    regex: (gke.*)
    target_label: instance
    replacement: $1
    action: drop
  - source_labels: [__meta_gce_instance_name]
    separator: ;
    regex: (.*)
    target_label: instance
    replacement: $1
    action: replace
- job_name: gce-instance-asia-northeast1-b-script-exporter
  honor_timestamps: true
  params:
    pattern:
    - .*
  scrape_interval: 1m
  scrape_timeout: 10s
  metrics_path: /probe
  scheme: http
  gce_sd_configs:
  - project: our-project
    zone: asia-northeast1-b
    refresh_interval: 2m
    port: 9172
    tag_separator: ','
  relabel_configs:
  - source_labels: [__meta_gce_instance_status]
    separator: ;
    regex: (RUNNING)
    target_label: instance_status
    replacement: $1
    action: keep
  - source_labels: [__meta_gce_instance_name]
    separator: ;
    regex: (prd.*)
    target_label: instance
    replacement: $1
    action: keep
  - source_labels: [__meta_gce_instance_name]
    separator: ;
    regex: (gke.*)
    target_label: instance
    replacement: $1
    action: drop
  - source_labels: [__meta_gce_instance_name]
    separator: ;
    regex: (.*)
    target_label: instance
    replacement: $1
    action: replace
- job_name: gce-instance-asia-northeast1-c-script-exporter
  honor_timestamps: true
  params:
    pattern:
    - .*
  scrape_interval: 1m
  scrape_timeout: 10s
  metrics_path: /probe
  scheme: http
  gce_sd_configs:
  - project: our-project
    zone: asia-northeast1-c
    refresh_interval: 2m
    port: 9172
    tag_separator: ','
  relabel_configs:
  - source_labels: [__meta_gce_instance_status]
    separator: ;
    regex: (RUNNING)
    target_label: instance_status
    replacement: $1
    action: keep
  - source_labels: [__meta_gce_instance_name]
    separator: ;
    regex: (prd.*)
    target_label: instance
    replacement: $1
    action: keep
  - source_labels: [__meta_gce_instance_name]
    separator: ;
    regex: (gke.*)
    target_label: instance
    replacement: $1
    action: drop
  - source_labels: [__meta_gce_instance_name]
    separator: ;
    regex: (.*)
    target_label: instance
    replacement: $1
    action: replace
remote_write:
- url: http://XX.XX.XX.XX:8480/insert/0/prometheus
  remote_timeout: 30s
  queue_config:
    capacity: 20000
    max_shards: 100
    min_shards: 1
    max_samples_per_send: 10000
    batch_send_deadline: 5s
    min_backoff: 30ms
    max_backoff: 100ms
stackdriver_spanner_instance_spanner_googleapis_com_instance_cpu_utilization_by_priority is collected by job="kubernetes-service-endpoints".
Thank you for your help.
govargo
on 27 Feb 2020
The Prometheus config looks OK.
Does this issue apply only to stackdriver_spanner_instance_spanner_googleapis_com_instance_cpu_utilization_by_priority metric or other metrics also have the same issues?
Could you upgrade to the latest release, reset response cache by querying /internal/resetRollupResultCache and verify whether this fixes the issue?
valyala
on 28 Feb 2020
Thank you for confirmation.
I haven’t seen this issue anything else “stackdriver_spanner_instance_spanner_googleapis_com_instance_cpu_utilization_by_priority”.
OK. We have plan to upgrade to the latest version on 3/4.
After upgrading version, I’ll add the result.
govargo
on 29 Feb 2020
Hello,
I have a similar problem, so maybe I can add some information to this case.
I use Prometheus which is writing data to 3 different VictoriaMetrics Instances. Results are shown on Grafana via Promxy only from VM. All these instances are Docker Container on a single machine. (It's a semi-production env - still experimenting)
I experienced wrong information in Grafana and tried to investigate. I ran the same simple query via curl against prometheus and against every VM instance and counted the given hosts.
curl 'http://localhost:32778/api/v1/query_range?step=15s&start='$((`date +%s`-180))'&end='$(date +%s)'&query=wmi_service_state%7Bname%3D~%22##SERVICE##%22,state=%22running%22%7D'
With different results.
Prometheus: correct
VM1: 11 hosts missing
VM2: 11 hosts missing
VM3: correct
On the next day I did the same with again different results:
Prometheus: correct
VM1: 3 hosts missing
VM2: correct
VM3: correct
I had the same problem with a similar query regarding the "node" job instead of the "wmi" job. To solve this I deleted the VM data volume and started from scratch.
This is my prometheus config: prometheus.yml.txt
The targets (wmi and node) look like this:
- targets: [ "###############:9100" ]
  labels:
    hostfqdn: "################"
    hostprio: "standard"
I'm already upgraded to VM Version 1.34.2. Prometheus is running in Version 2.16.0
 tguentel
on 5 Mar 2020
tguentel
on 5 Mar 2020
@valyala
We upgraded our victoria metrics cluster to v1.34.2-cluster on 3/4.
And I could confirm my issue has been resolved.
Thank you very much!
Left: Prometheus, Right: Victoria Metrics.
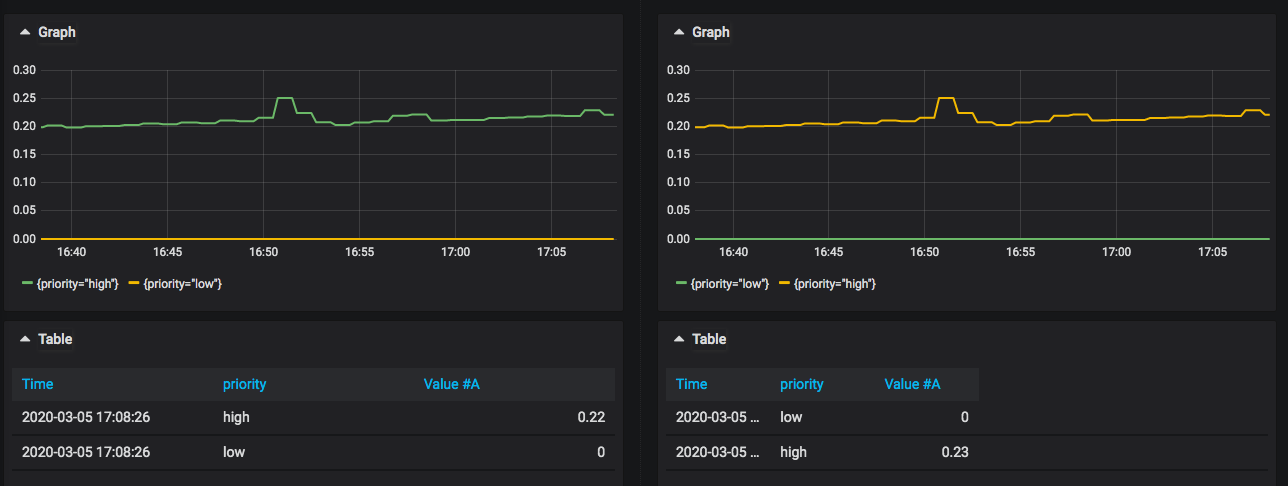
There are two label(priority-high, priority-low) correctly.
I'll keep this issue open for tguentel's issue.
govargo
on 5 Mar 2020
@tguentel , thanks for the detailed description of the issue! The described issue looks like a data race. Could you build VictoriaMetrics with the following command from the latest commit in master branch:
``
make victoria-metrics-race
````
Then try running the
bin/victoria-metrics-race` binary. This binary contains built-in Go race detector, which should detect data races in real time and log information about them in stderr. Note that the race detector significantly slows down the program and increases memory usage, so try reducing the incoming load if you see OOMs.
Please attach data race log here if it will be found.
valyala
on 5 Mar 2020
@valyala, thanks for your answer. On friday last week, the graphs seems to be correct, like the databases corrects themselfes. I cant find missing data anymore. Today everything is still running and seems to be correct.
Maybe the update to 1.34.2, that I did last week, solves the problem?! Seems to be the only explanation to me.
I will have an eye on how it behaves in the next time and give your suggestion a try if it happens again. I will open an issue in this case, so this issue can be closed as solved so far.
Thank you @valyala and @govargo
tguentel
on 9 Mar 2020
@tguentel , thanks for the update!
Closing this issue as https://github.com/VictoriaMetrics/VictoriaMetrics/issues/360 duplicate.
valyala
on 11 Mar 2020
FYI, we finally found the root cause of the issue. See #360 for details. It should be fixed in v1.34.4. Note that the <-storageDataPath>/cache folder must be manually removed after stopping the previous VictoriaMetrics version and before starting v1.34.4, since the folder can contain invalid cached data.
valyala
on 27 Mar 2020
Related issues
 prdatur
·
3Comments
prdatur
·
3Comments
 0xBF
·
3Comments
0xBF
·
3Comments
 oOHenry
·
4Comments
oOHenry
·
4Comments
 jelmd
·
3Comments
jelmd
·
3Comments
 dima-vm
·
3Comments
dima-vm
·
3Comments
Most helpful comment
@valyala
We upgraded our victoria metrics cluster to v1.34.2-cluster on 3/4.
And I could confirm my issue has been resolved.
Thank you very much!
Left: Prometheus, Right: Victoria Metrics.
There are two label(priority-high, priority-low) correctly.
I'll keep this issue open for tguentel's issue.