Victoriametrics: Metrics Values differ between Promtheus alone and aggregated VictoriaMetrics
Describe the bug
We have multiple GKE clusters.
And we deploy Prometheus per clusters.
This is our architecture which we have.

We are facing strange issue.
Prometheus appears to have normal metrics when viewed alone,
but it appears to have unusual values when viewed in VictoriaMetrics.
please see Screenshots section.
When we watch grafana dashboard which is set datasource to prom-0/prom-1/prom-2/prom-3, the dashboard seems to be normal.
But we watch grafana dashboard which is set datasource to victoria-metrics, the dashboard seems to be not normal.
To Reproduce
There is no full reproduce step.
Expected behavior
We expect to aggregate each prometheus metrics correctly.
Screenshots
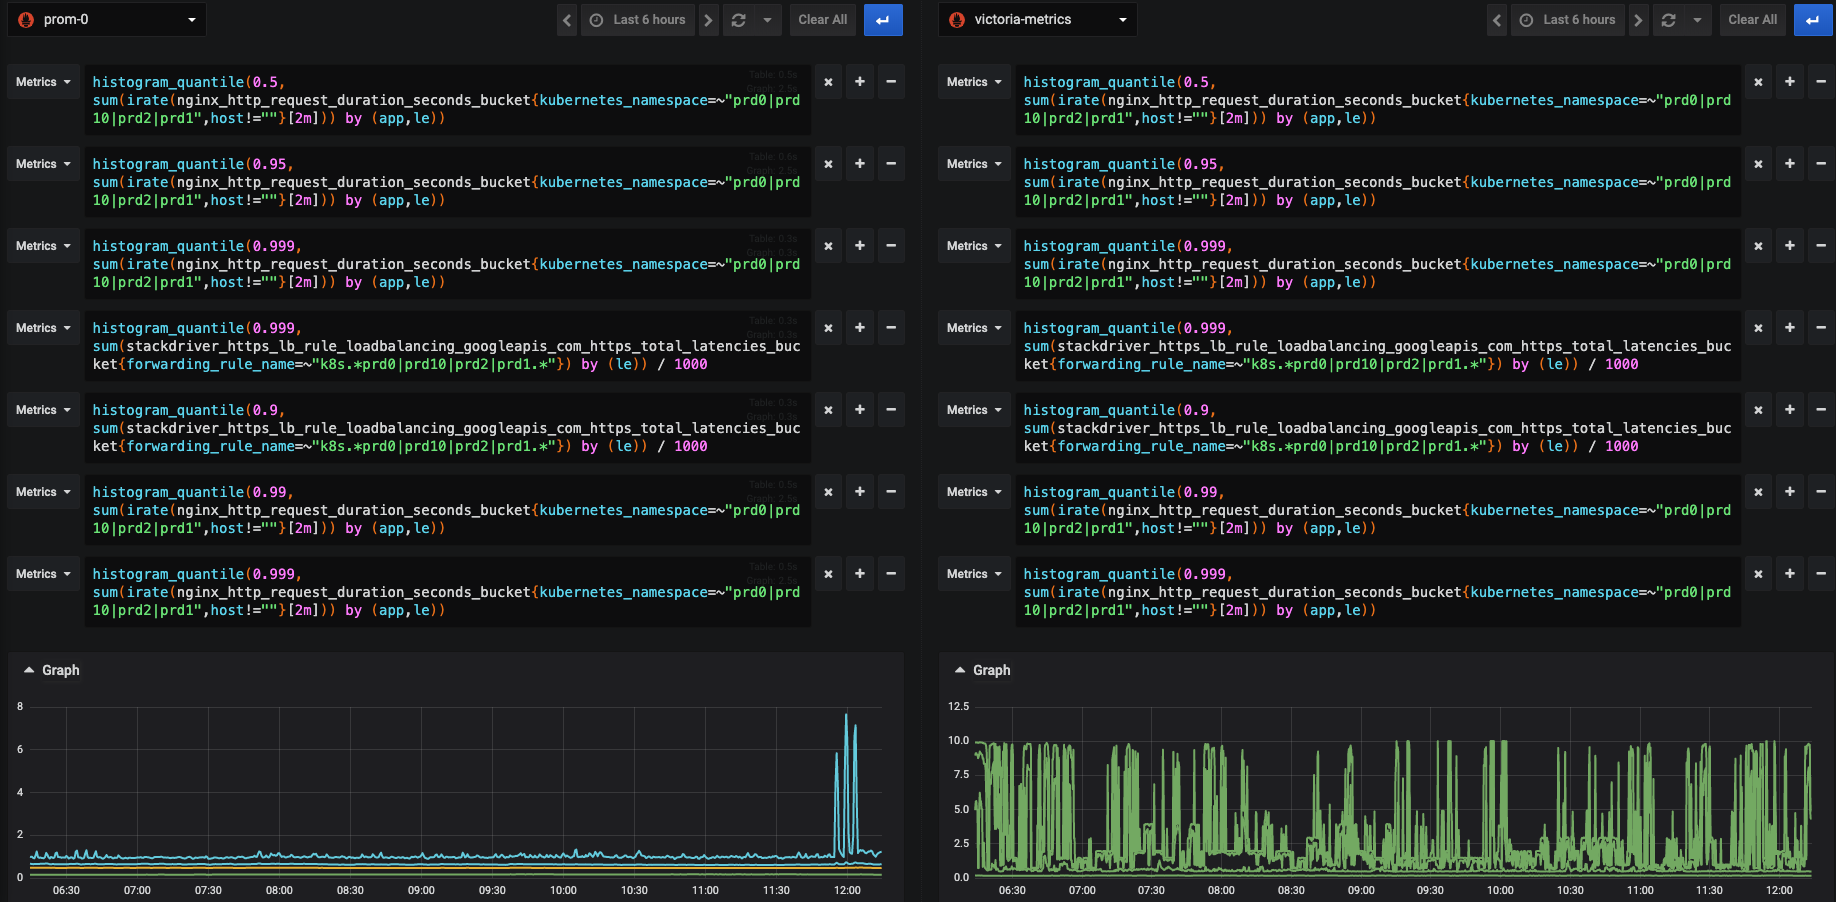
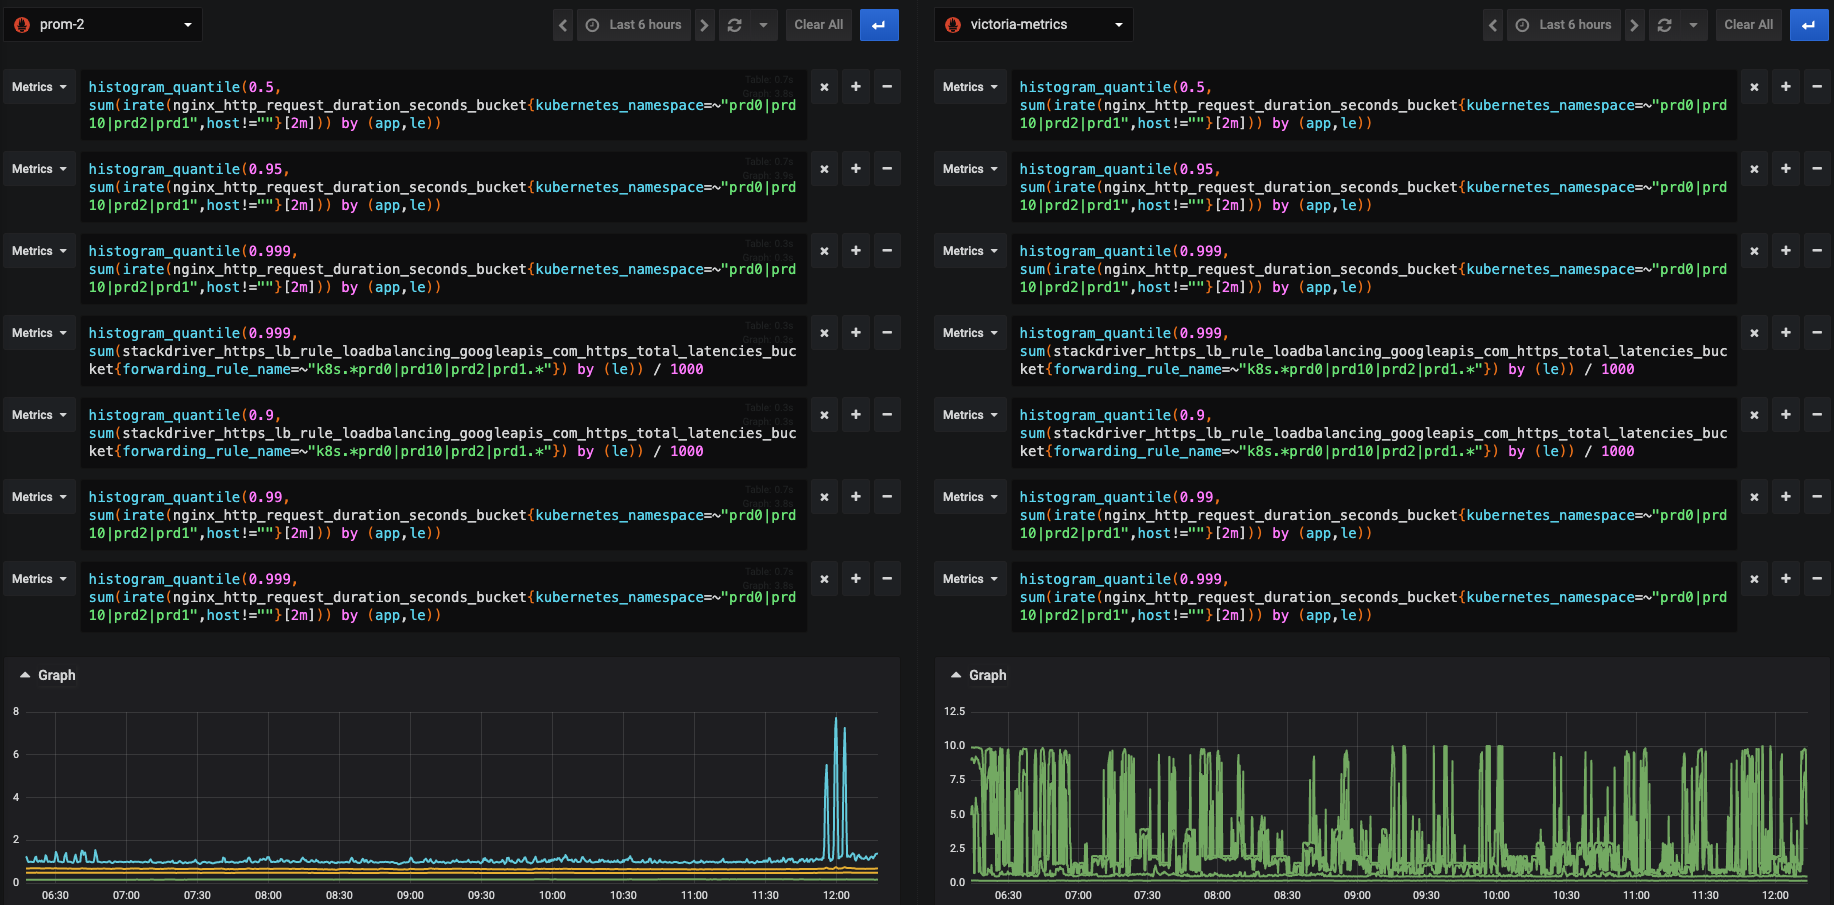
This is problematic panel.
prom0 vs aggregated victoria metrics
prom1 vs aggregated victoria metrics

prom2 vs aggregated victoria metrics
prom3 vs aggregated victoria metrics

Each prometheus metrics has no high rate on left.
However victoria metrics has high rate on both sides.
Version
# Running on GKE v1.13.11-gke.14
victoriametrics/vminsert:v1.26.0-cluster
victoriametrics/vmselect:v1.26.0-cluster
victoriametrics/vmstorage:v1.26.0-cluster
Used command-line flags
# vmstorage
flag{name="http.disableResponseCompression", value="false"} 1
flag{name="httpListenAddr", value=":8482"} 1
flag{name="loggerLevel", value="INFO"} 1
flag{name="memory.allowedPercent", value="60"} 1
flag{name="precisionBits", value="64"} 1
flag{name="retentionPeriod", value="24"} 1
flag{name="rpc.disableCompression", value="false"} 1
flag{name="search.maxTagKeys", value="secret"} 1
flag{name="search.maxTagValues", value="10000"} 1
flag{name="search.maxUniqueTimeseries", value="1000000"} 1
flag{name="snapshotAuthKey", value="secret"} 1
flag{name="storageDataPath", value="/storage"} 1
flag{name="version", value="false"} 1
flag{name="vminsertAddr", value=":8401"} 1
flag{name="vmselectAddr", value=":8400"} 1
Additional context
This dashboard panel's queries are here
# HLB - 90th
histogram_quantile(0.9, sum(stackdriver_https_lb_rule_loadbalancing_googleapis_com_https_total_latencies_bucket{forwarding_rule_name=~"k8s.*$namespace.*"}) by (le)) / 1000

# app - 99th
histogram_quantile(0.99, sum(irate(nginx_http_request_duration_seconds_bucket{kubernetes_namespace=~"$namespace",host!=""}[2m])) by (app,le))

# app - 999th
histogram_quantile(0.999, sum(irate(nginx_http_request_duration_seconds_bucket{kubernetes_namespace=~"$namespace",host!=""}[2m])) by (app,le))
If above information isn't enough, please let me know.
Thank for your help.
 govargo
All 4 comments
@govargo , thanks for the detailed bug report!
There was a fix for histogram_quantile function after v1.26.0 in the commit 19dfe52254378b359dd4e14acbb3771c04536c35 . A few additional commits touched the histogram_quantile function as well after v1.26.0:
- c4287b3c8663945ff59e88e71b718143df9c6ba4
- 7753c8c0a1a08fa428d26040801084a6a47c141c
- 8582b503603f5ba487de5cdcc36f1c31250b58c4
- 73b2a3d4b7afa2f5eafe91bb19516a5cb300cb28
So it would be great checking for the issue in the latest release.
Additionally, using irate inside histogram_quantile could result in jumpy graphs after each refresh. It is better using either rate or increase instead. See this article for details. Could you try substituting irate in the queries above with rate or increase and see whether the discrepancy between Prometheus and VictoriaMetrics remains?
If the discrepancy remains, then it would be great attaching graphs for the inner query inside histogram_quantile for both Prometheus and VictoriaMetrics, i.e.
sum(rate(nginx_http_request_duration_seconds_bucket{kubernetes_namespace=~"$namespace",host!=""}[2m])) by (app,le)
These graphs should help determining the root cause of the issue.
Also note that VictoriaMetrics calculates rate and increase slightly differently to Prometheus in order to fix unexpected results that Prometheus can return from these functions. See the first chapter at MetricsQL docs for details.
 valyala
on 14 Feb 2020
valyala
on 14 Feb 2020
Thank you very much!
We will try to use the latest version(1.33.1-cluster).
And thank you for sharing the difference between irate and rate!
This is an amazing article!!
We will change our queries and check for changes.
govargo
on 16 Feb 2020
I’ll add comment after checking.
govargo
on 16 Feb 2020
We updated the latest version(1.33.1-cluster).
And now the graph has improved very much with the both case(rate & irate).
Thank you!!
govargo
on 17 Feb 2020
Related issues
 abualy
·
3Comments
abualy
·
3Comments
 prdatur
·
3Comments
prdatur
·
3Comments
 v98765
·
3Comments
v98765
·
3Comments
 Serrvosky
·
3Comments
Serrvosky
·
3Comments
 EricAntoni
·
3Comments
EricAntoni
·
3Comments
Most helpful comment
We updated the latest version(1.33.1-cluster).
And now the graph has improved very much with the both case(
rate&irate).Thank you!!