Victoriametrics: RemoteWrite leads 5-6minutes Lag
Describe the bug
We have been using VM for about 2 months, recently we found that the metrics are 5~6 minutes lag than Prometheus. I really need some advices to help solve that. Thanks
Version
$ ./victoria-metrics-prod --version
victoria-metrics-20191224-105655-tags-v1.31.3-0-g5cb8d977
Single Version
Additional context
Prometheus Configurations:
remote_write:
- url: http://xxx:8428/api/v1/write
  remote_timeout: 30s
  queue_config:
    capacity: 20000
    max_shards: 50
    min_shards: 1
    max_samples_per_send: 100000
    batch_send_deadline: 5s
    min_backoff: 30ms
    max_backoff: 100ms
VM Configurations:
./victoria-metrics -storageDataPath=/data1/vm -retentionPeriod=3 -httpListenAddr=:8428
Some metrics of Prometheus
prometheus_remote_storage_pending_samples{queue="0:xxx} 200000
Some metrics of VM
vm_blocks{type="indexdb"} 223635
vm_blocks{type="storage/big"} 86686550
vm_blocks{type="storage/small"} 50965739
vm_merges_total{type="indexdb"} 417663
vm_merges_total{type="storage/big"} 28
vm_merges_total{type="storage/small"} 1180652
vm_metric_rows_skipped_total{name="vmselect"} 13772448590
vm_missing_metric_names_for_metric_id_total 0
vm_missing_tsids_for_metric_id_total 0
vm_new_timeseries_created_total 7585641
vm_nfs_dir_remove_failed_attempts_total 0
vm_opentsdb_request_errors_total{name="write", net="tcp"} 0
vm_opentsdb_request_errors_total{name="write", net="udp"} 0
vm_opentsdb_requests_total{name="write", net="tcp"} 0
vm_opentsdb_requests_total{name="write", net="udp"} 0
vm_parts{type="indexdb"} 21
vm_parts{type="storage/big"} 7
vm_parts{type="storage/small"} 27
vm_pending_rows{type="indexdb"} 0
vm_pending_rows{type="storage"} 199930
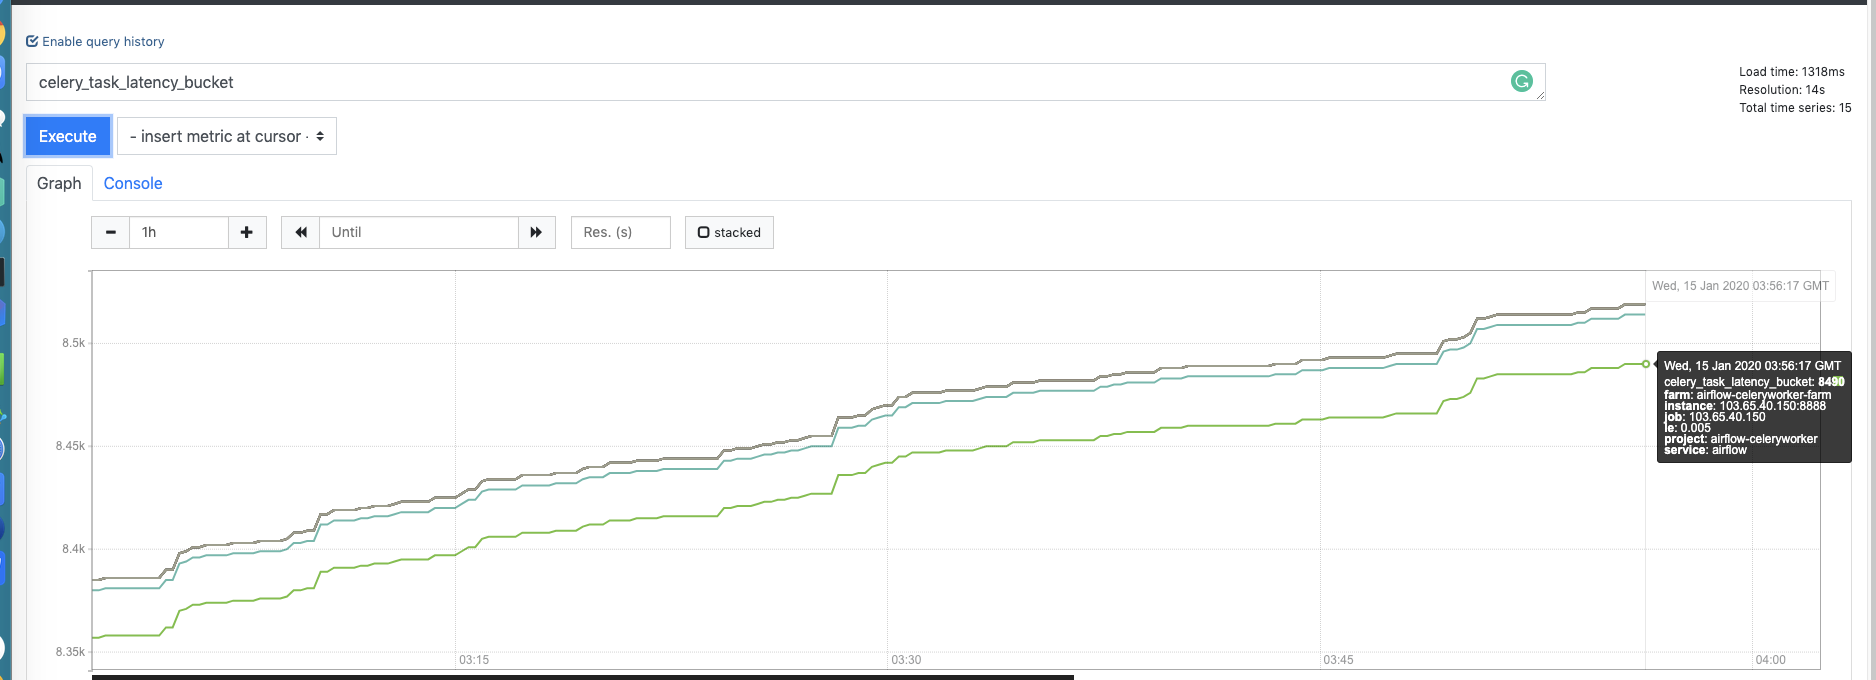
Prometheus screenshot.
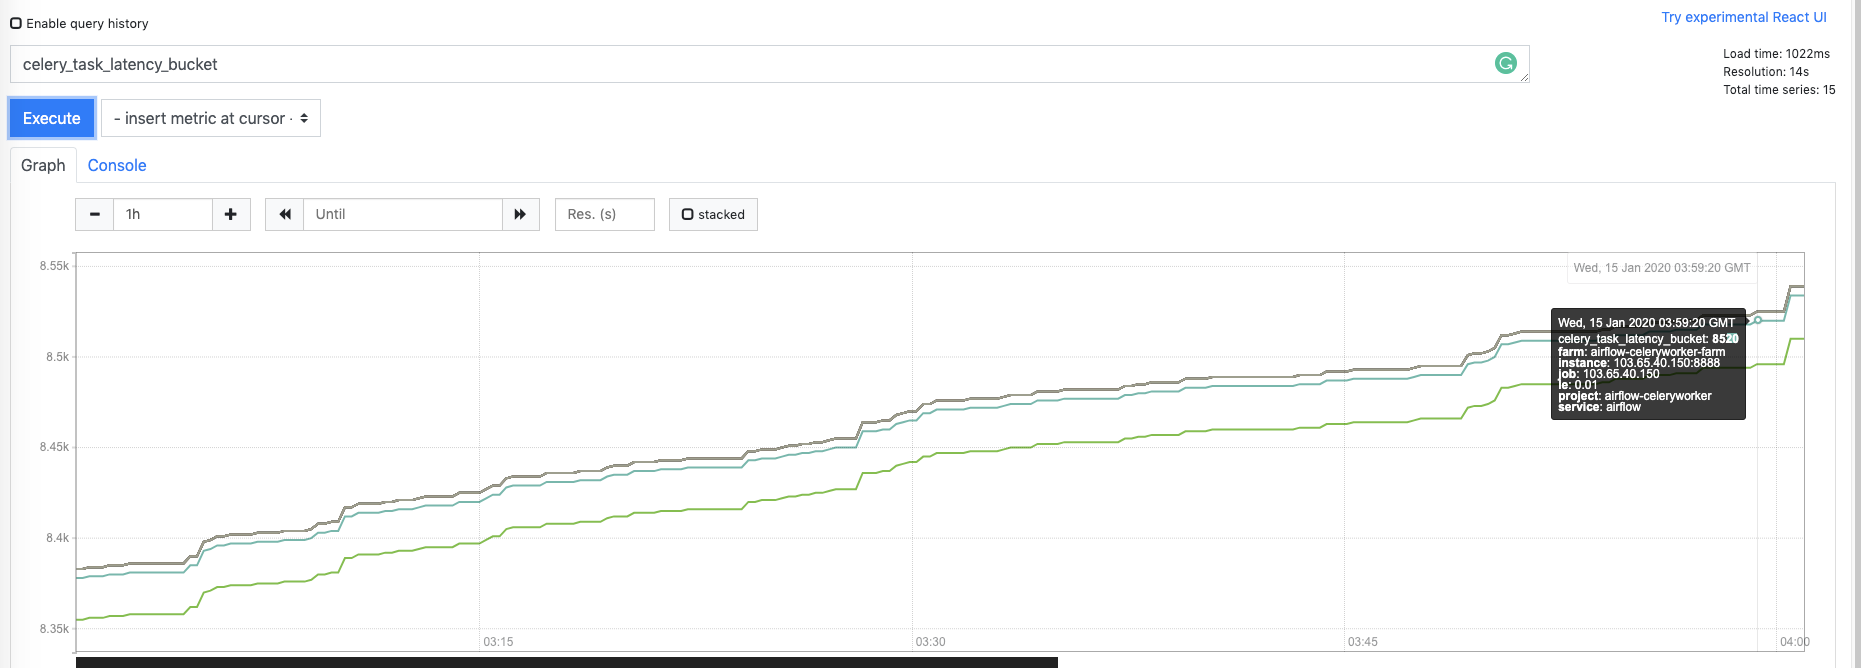
Vm screenshot (By Promxy, 2 VM nodes are delayed, we have using http curl to ensure that)
 sundy-li
All 21 comments
VM monitor screenshots

sundy-li
on 15 Jan 2020
Hi @sundy-li!
VM doesn't look like overloaded, but could you provide screenshots of concurrent inserts and tcp connections panels?
I am wondering what version of Prometheus do you use? Can you also check the following metrics in Prometheus(the graph screenshots are preferable):
- prometheus_remote_storage_failed_samples_total
- prometheus_remote_storage_enqueue_retries_total
- prometheus_remote_storage_dropped_samples_total
- prometheus_remote_storage_shards
- histogram_quantile(0.9, rate(prometheus_remote_storage_sent_batch_duration_seconds_bucket[5m]))
 hagen1778
on 15 Jan 2020
hagen1778
on 15 Jan 2020
@hagen1778 Thanks for your reply.
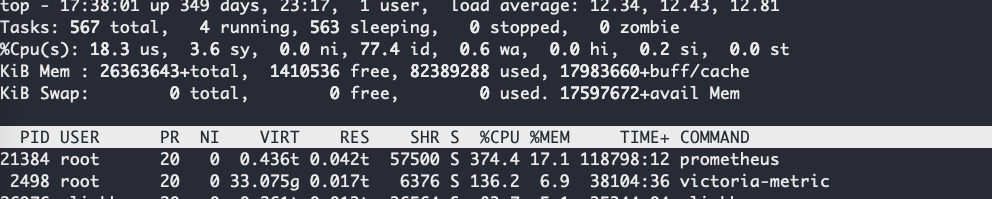
Here is the screenshots.
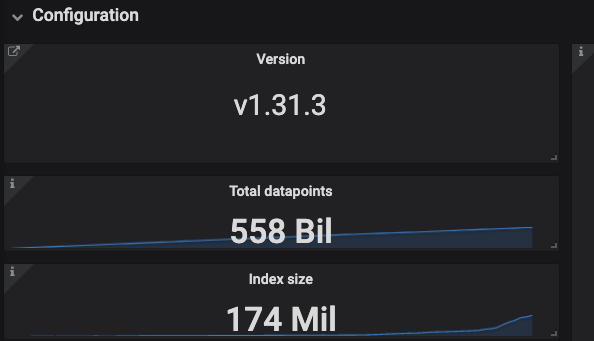

I also think that VM not overloaded.
32Core 128G Top
Prometheus version
Version: 2.14.0
GIT log: edeb7a44cbf745f1d8be4ea6f215e79e651bfe19
Prometheus Metrics (Restarts at 2 weeks ago) from /metrics api.
prometheus_remote_storage_failed_samples_total{queue="0:xxx"} 1.4765e+09
prometheus_remote_storage_enqueue_retries_total{queue="0:xxx"} 547
prometheus_remote_storage_dropped_samples_total{queue="0:xxx"} 270
prometheus_remote_storage_shards{queue="0:xxx"} 1
histogram_quantile(0.9, rate(prometheus_remote_storage_sent_batch_duration_seconds_bucket{instance="xxx:9090"}[5m]))
 0.24077551020408164
Looks like prometheus_remote_storage_failed_samples_total is very high, yet I did not notice data lost through the Graph series, just the latest metrics are lagged.
BTW, both VMs are lagged, we use 2 Prometheus to 2 VMs.
sundy-li
on 15 Jan 2020
@sundy-li , could you verify whether the lag persists when querying VictoriaMetrics directly without Promxy?
Also could you compare local time on hosts that run Prometheus and VictoriaMetrics?
 valyala
on 15 Jan 2020
valyala
on 15 Jan 2020
@valyala
could you verify whether the lag persists when querying VictoriaMetrics directly without Promxy?
Yes, as I mentioned on the first comment I have tested it with both curl vm:8428 and grafana dashboard , it's not the problem of Promxy. Both VMs are lagged.
Also could you compare local time on hosts that run Prometheus and VictoriaMetrics?
But they are running on the same node.
cat /etc/timezone
Asia/Hong_Kong
```
sundy-li
on 15 Jan 2020
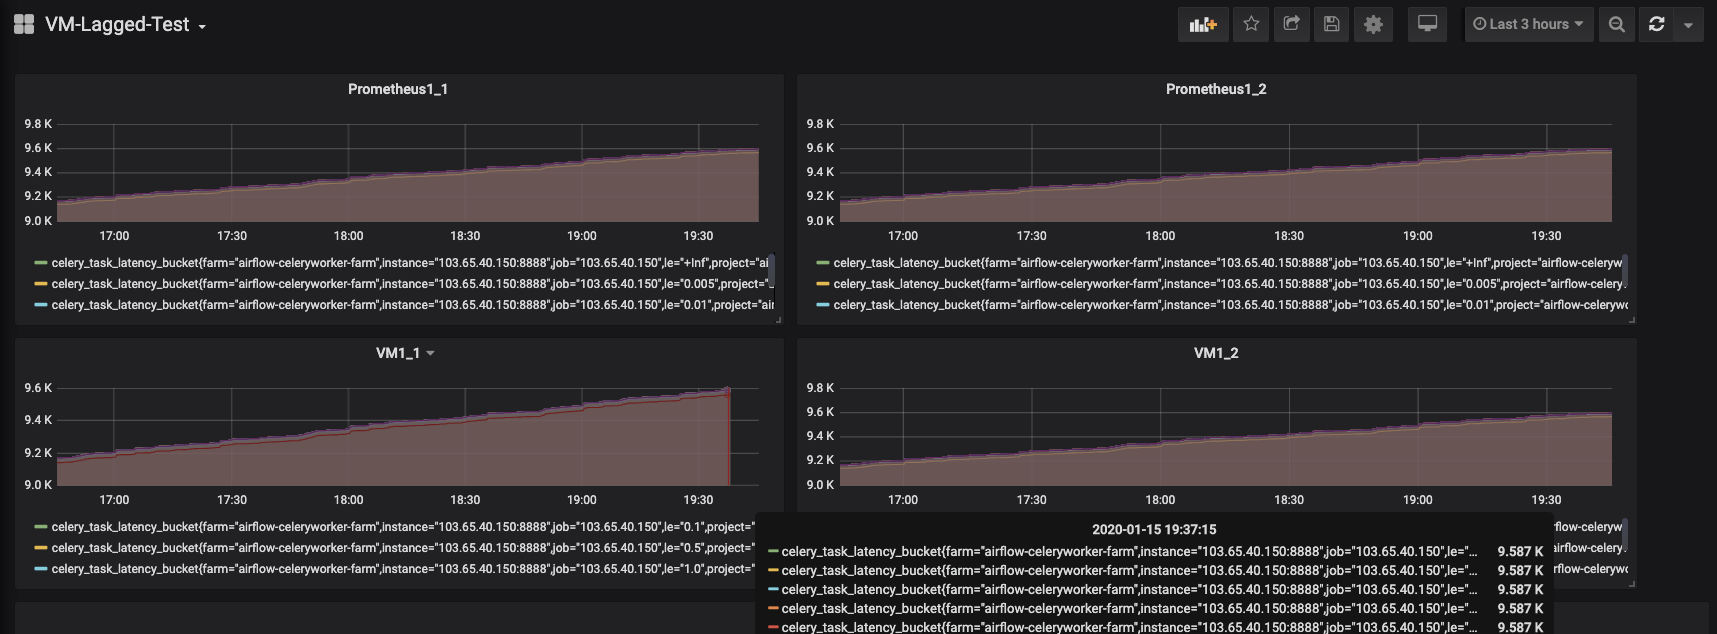
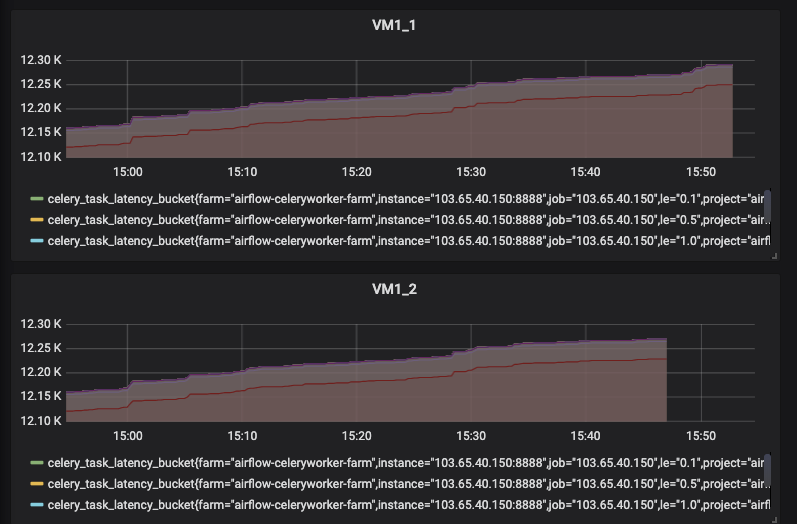
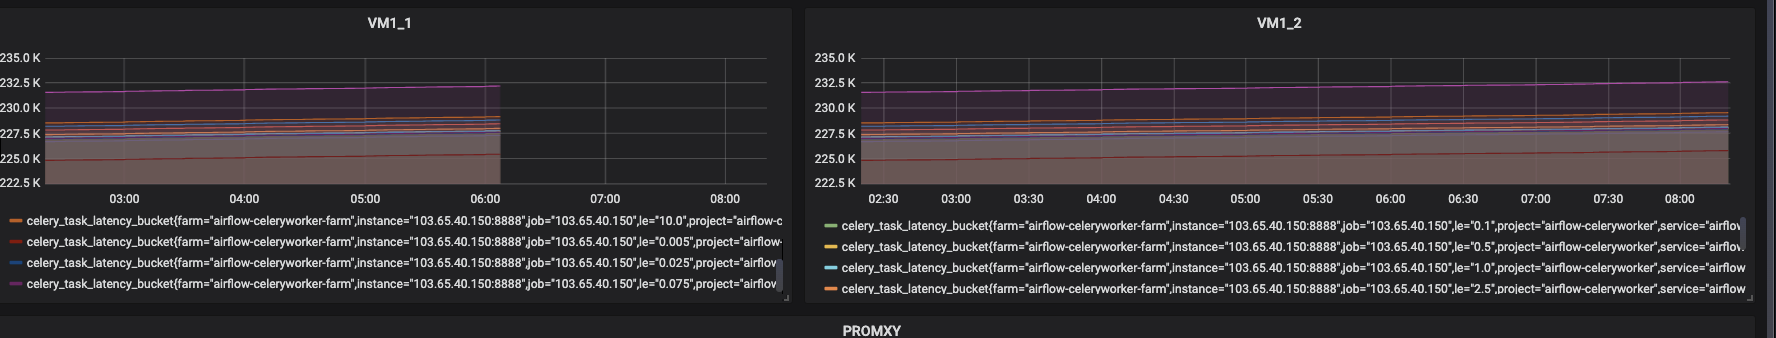
I am sorry, I just verfiy it again, not both VM are lagged now (But I am sure they are lagged before).
Let's look at this screenshots, I have created 5 datasources on grafana
Prometheues1_1 which write to VM1_1 same node deployed
Prometheues1_2 which write to VM1_2 same node deployed
Proxmy which reads from VM1_1 and VM1_2
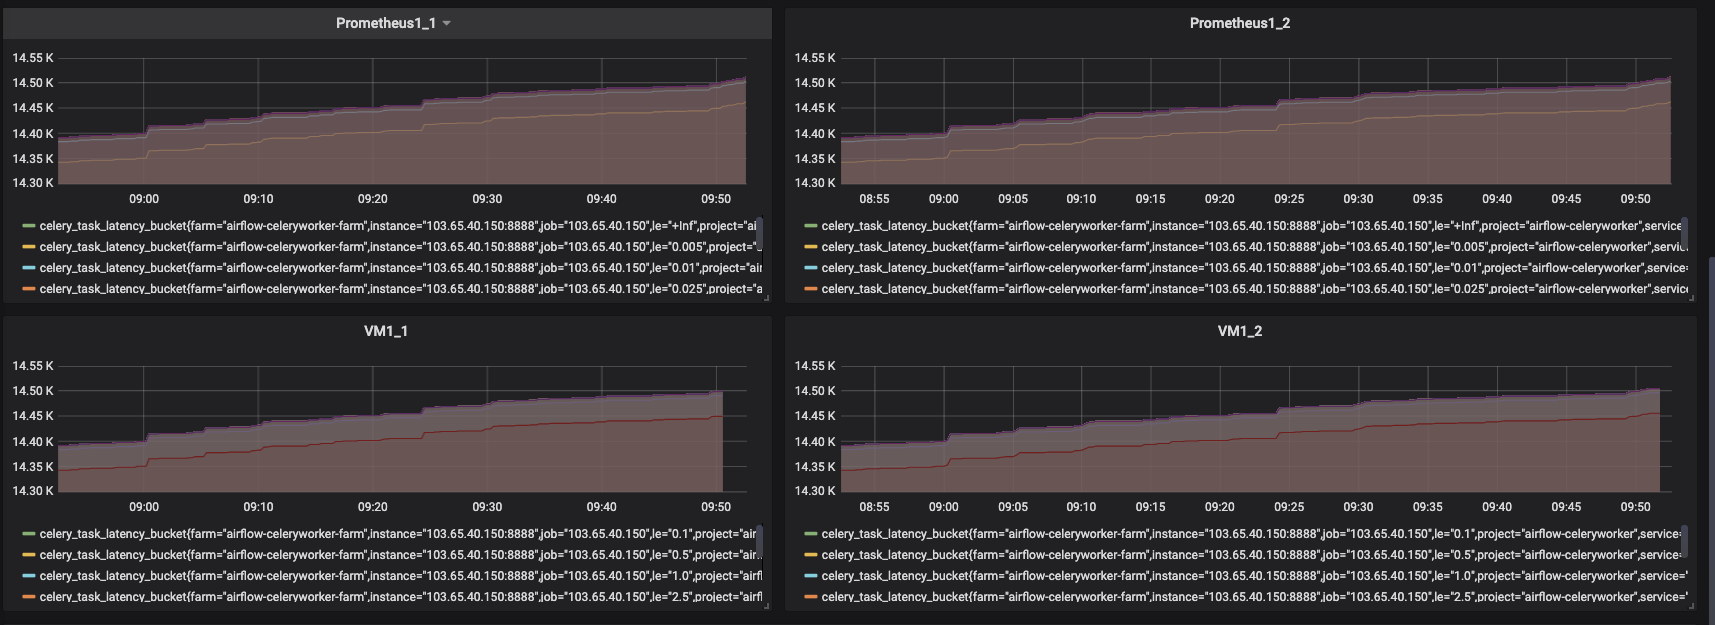
Prometheues1_1 and Prometheues1_2 are with same scrape configs

sundy-li
on 15 Jan 2020
VM1 are dropping messages, here are some errors on VM1
2020-01-15T11:04:07.388Z    info    VictoriaMetrics@/lib/storage/partition.go:1170  merged 208693687 rows in 21.485584531s at 9713195 rows/sec to "/data1/vm/data/small/2020_01/208693687_4828214_20200115094501.209_20200115105731.790_15E59A35E24FBB32"; sizeBytes: 374528191
2020-01-15T11:04:17.273Z    error   VictoriaMetrics@/lib/httpserver/httpserver.go:421   error in "/api/v1/write": cannot read prompb.WriteRequest: too big unpacked request; musn't exceed 33554432 bytes
2020-01-15T11:04:17.491Z    error   VictoriaMetrics@/lib/httpserver/httpserver.go:421   error in "/api/v1/write": cannot read prompb.WriteRequest: too big unpacked request; musn't exceed 33554432 bytes
2020-01-15T11:04:18.963Z    error   VictoriaMetrics@/lib/httpserver/httpserver.go:421   error in "/api/v1/write": cannot read prompb.WriteRequest: too big unpacked request; musn't exceed 33554432 bytes
2020-01-15T11:04:19.190Z    error   VictoriaMetrics@/lib/httpserver/httpserver.go:421   error in "/api/v1/write": cannot read prompb.WriteRequest: too big unpacked request; musn't exceed 33554432 bytes
2020-01-15T11:04:25.060Z    error   VictoriaMetrics@/lib/httpserver/httpserver.go:421   error in "/api/v1/write": cannot read prompb.WriteRequest: too big unpacked request; musn't exceed 33554432 bytes
2020-01-15T11:04:34.106Z    error   VictoriaMetrics@/lib/httpserver/httpserver.go:421   error in "/api/v1/write": cannot read prompb.WriteRequest: too big unpacked request; musn't exceed 33554432 bytes
2020-01-15T11:04:34.339Z    error   VictoriaMetrics@/lib/httpserver/httpserver.go:421   error in "/api/v1/write": cannot read prompb.WriteRequest: too big unpacked request; musn't exceed 33554432 bytes
2020-01-15T11:04:39.476Z    error   VictoriaMetrics@/lib/httpserver/httpserver.go:421   error in "/api/v1/write": cannot read prompb.WriteRequest: too big unpacked request; musn't exceed 33554432 bytes
I restart VM1 with maxInsertRequestSize=134217728, now error logs not show, but the lag is still there.
Update:
I restart both Prometheus with new configs 3 hours ago.
  queue_config:
    capacity: 20000
    max_shards: 50
    min_shards: 1
    max_samples_per_send: 100000
    batch_send_deadline: 5s
    min_backoff: 30ms
    max_backoff: 100ms
Now the lag of VM1 is 2 minutes, the lag of VM2 if 7 minutes, so weird.
sundy-li
on 15 Jan 2020
Try reducing max_samples_per_send from 100000 to 10000 in Prometheus configs. This should decrease possible lag on Prometheus side by reducing the maximum number of pending data points in the queue before they are sent to VictoriaMetrics.
Then also try reducing max_shards from 50 to 30.
As an additional benefit, lowering both max_samples_per_send and max_shards could reduce Prometheus memory usage - see https://prometheus.io/docs/practices/remote_write/ .
valyala
on 16 Jan 2020
prometheus_remote_storage_failed_samples_total{queue="0:xxx"} 1.4765e+09
Could you show a graph for increase(prometheus_remote_storage_failed_samples_total[1h]) over the last 24 hours? This should show whether Prometheus fails sending data to VictoriaMetrics and whether this correlates with errors in VictoriaMetrics or Prometheus logs.
valyala
on 16 Jan 2020
Note: I restarted Prometheus yesterday to test some configs.
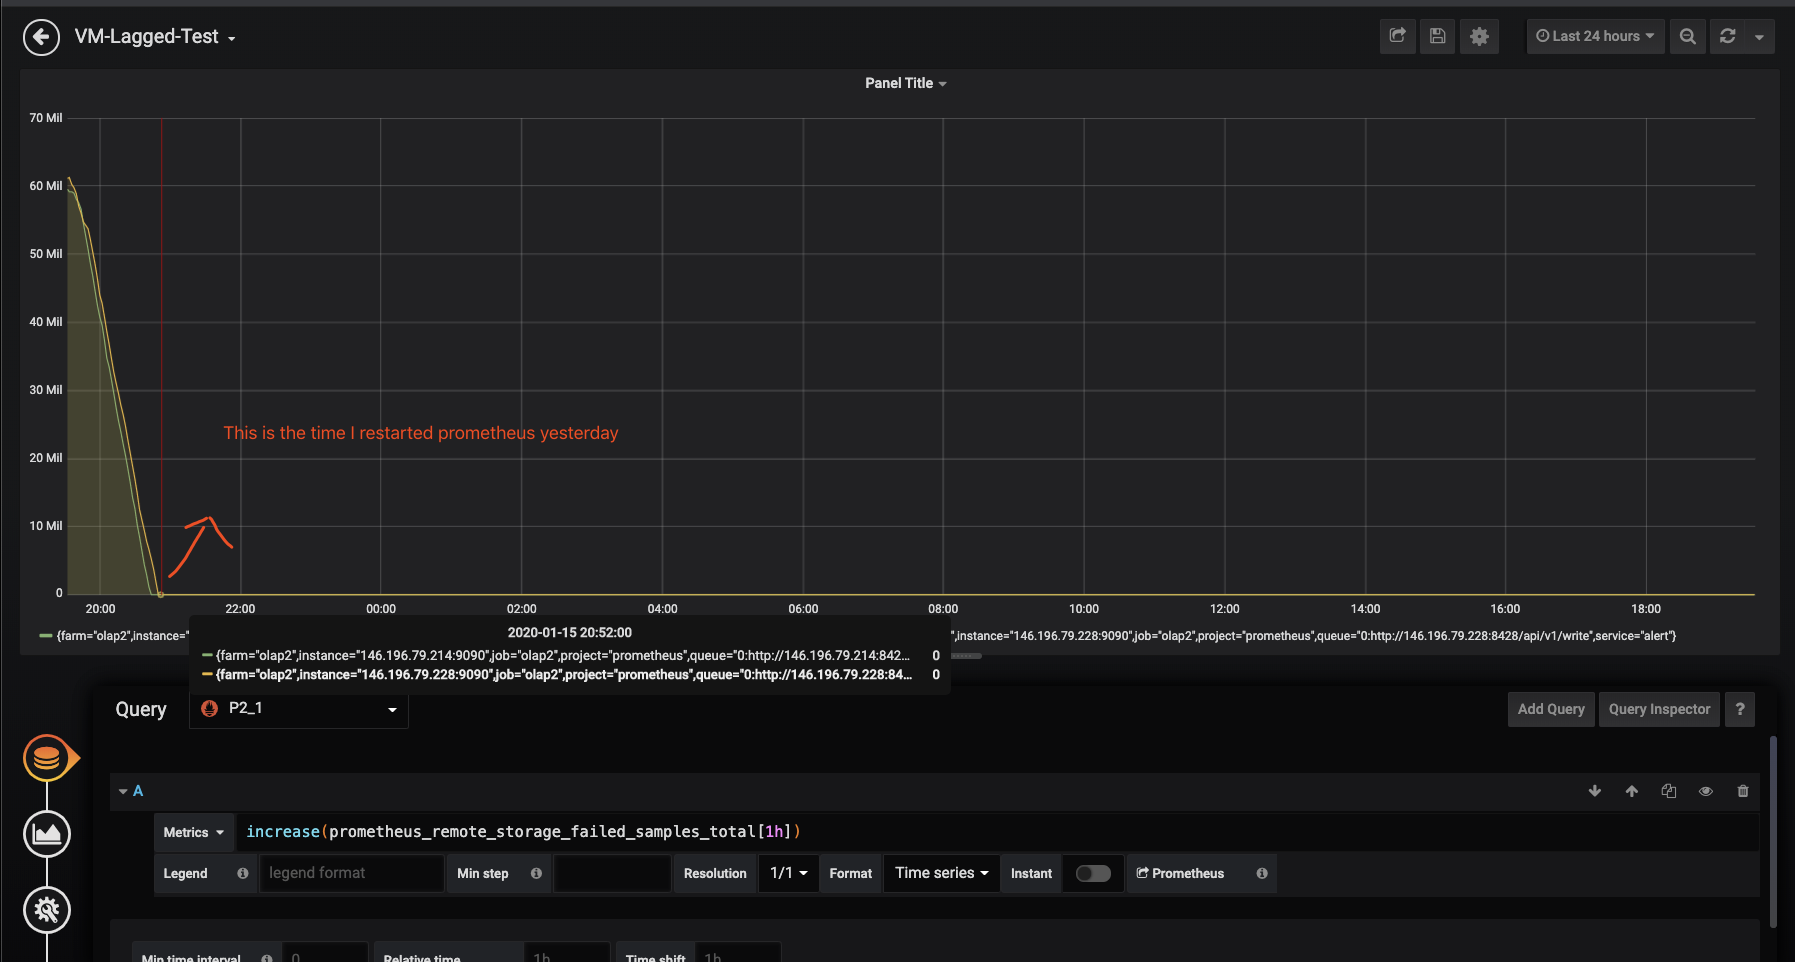
sundy-li
on 16 Jan 2020
This graph shows that Prometheus couldn't write too big chunks of data to VictoriaMetrics, since the size of these chunks exceeded -maxInsertRequestSize value. I'd recommend returning -maxInsertRequestSize to default value after reducing max_samples_per_send from 100K to 10K. Lower -maxInsertRequestSize should reduce memory usage on VictoriaMetrics side.
valyala
on 16 Jan 2020
Ok, I will test that, now there are not any error logs in VMs and Prometheus. I found Prometheus restart took more than 40 minutes, that's really bad for tuning configs. But VM restart just needs some seconds 👍
$ sudo du -sh /data1/prometheus/
482G    /data1/prometheus/
$ sudo du -sh /data1/vm
228G    /data1/vm
I found Prometheus restart took more than 40 minutes, that's really bad for tuning configs.
Prometheus configs can be applied without restart by sending SIGHUP signal to Prometheus - see https://www.robustperception.io/reloading-prometheus-configuration .
Prometheus restarts slowly if it has been shut down uncleanly. Clean shutdown for Prometheus is via SIGTERM signal - see https://www.robustperception.io/shutting-down-prometheus . All the other approaches for Prometheus shutdown would lead to recovery from WAL on the next start. This recovery can take too long time for big WAL directory. If you can afford losing recent data, then remove the WAL directory contents before starting Prometheus. See these docs about WAL directory.
valyala
on 16 Jan 2020
@valyala Really thanks for your detail advice. I will try that.
sundy-li
on 16 Jan 2020
After the configuration tunning, the lag is 1~2 minutes now.
sundy-li
on 17 Jan 2020
In theory the lag shouldn't exceed 5 seconds from the configured batch_send_deadline value in Prometheus config. Needs additional investigation...
valyala
on 17 Jan 2020
Same question. I set prometheus remote write configure as this
  queue_config:
    capacity: 20000
    max_shards: 30
    min_shards: 1
    max_samples_per_send: 10000
    batch_send_deadline: 5s
    min_backoff: 30ms
    max_backoff: 100ms
After reload Prometheus, 20-30 minutes lag reduced to 1-2 minutes. But still exceed 5 seconds.
Prometheus version: 2.13.1
Victoria Metrics version: 1.33.0-cluster
 Lnek
on 4 Mar 2020
Lnek
on 4 Mar 2020
I upgraded the VM version from 1.33.0-cluster to 1.34.2-cluster, and something strange happened.
I found that the old metrics query form vmselect still lag 1-2minutes, but some new metrics do not.
I guess that lag is due to the vmstorage cache?
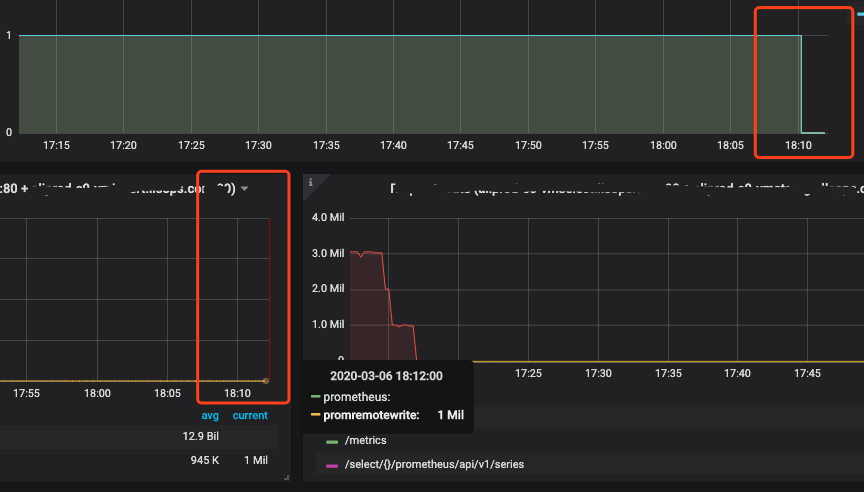
Lnek
on 6 Mar 2020
Thanks for the additional info, @Lnek ! I still have no idea for the root cause of the lag.
I guess that lag is due to the vmstorage cache?
The maximum lag between data ingestion to vminsert and data availability via vmselect querying shouldn't exceed a few seconds, which should be enough to propagate the ingested data through various in-memory buffers to persistent storage at vmstorage
vmselect has a command-line flag -search.latencyOffset, which is set to 30 seconds by default. This flag value must be bigger than the maximum lag induced by Prometheus or any other data source, otherwise incomplete data may be returned from queries.
I'd recommend trying to substitute Prometheus with vmagent and see whether this reduces the lag.
valyala
on 28 Mar 2020
Update.
I keep watching the lags, and find the problem may be the high load of Prometheus.
Now, node1 has 3-hour lags, and node2 is normal.
Node1 with lags

prometheus_remote_storage_pending_samples{queue="0:http://vm1:8428/api/v1/write"} 1.4241501071e+10

Node2 without lags
prometheus_remote_storage_pending_samples{queue="0:http://vm2:8428/api/v1/write"} 20000
Node1 and Node2 and with the same exporters, data and configurations, but the load is different.

So I think the problem is Prometheus not VM, I will try to substitute Prometheus with vmagent .
sundy-li
on 30 Mar 2020
Thanks for the update! It is strange that identically configured Prometheus instances have such different CPU load.
valyala
on 31 Mar 2020
Related issues
 genericgithubuser
·
4Comments
genericgithubuser
·
4Comments
 EricAntoni
·
3Comments
EricAntoni
·
3Comments
 pmitra43
·
3Comments
pmitra43
·
3Comments
 oOHenry
·
4Comments
oOHenry
·
4Comments
 dima-vm
·
3Comments
dima-vm
·
3Comments
Most helpful comment
After the configuration tunning, the lag is 1~2 minutes now.
