Victoriametrics: Provide component/app label in cluster version
Is your feature request related to a problem? Please describe.
I use the victoria metrics cluster grafana dashboard. On the dashboard is an uptime panel but the uptime is only listed by the instance label. It would be nice if the table would show the uptime by app vmstore, vmselect and vminsert, but this isn't possible because the vm_app_start_timestamp has no app label.
Describe the solution you'd like
Metrics which are the same in vminsert, vmstorage and vminsert e.q. vm_app_start_timestamp should have an app or component label. That a user can see which cluster component has delivered this metric.
is:
vm_app_start_timestamp 1573829942
vm_app_uptime_seconds 242680
should:
vm_app_start_timestamp{component="vmstore"} 1573829942
vm_app_uptime_seconds{component="vmstore"} 242680
 oOHenry
All 5 comments
This can be achieved by grouping by job label, which is set by Prometheus according to scrape configs. @hagen1778 , could you look into this?
 valyala
on 18 Nov 2019
valyala
on 18 Nov 2019
@valyala OK but this requires to have a separate scrape job for each component.
oOHenry
on 18 Nov 2019
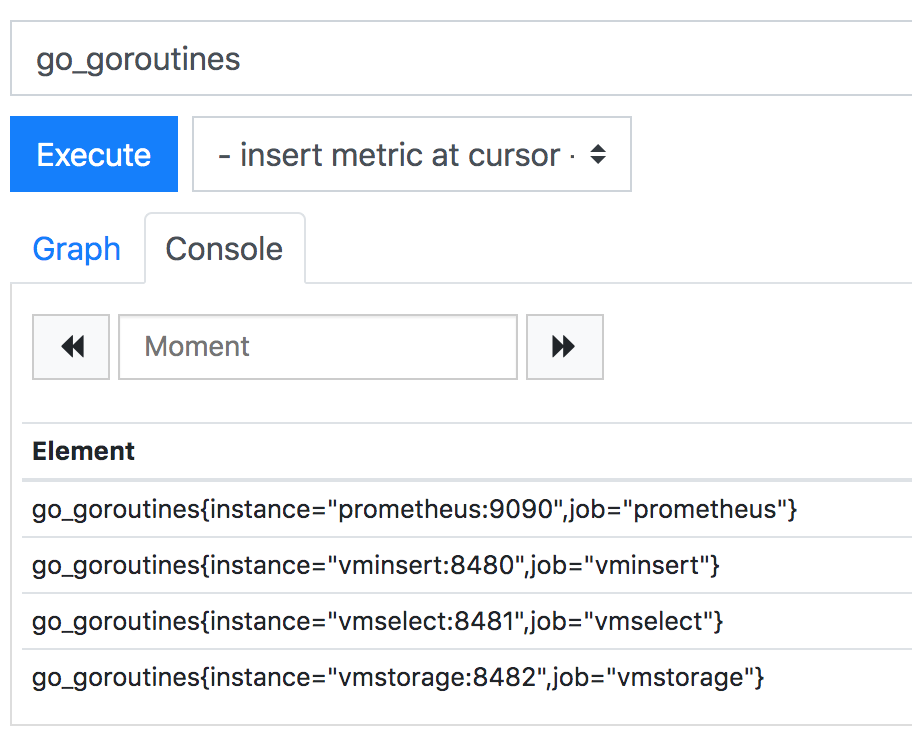
It is recommended to have separate scrape jobs in Prometheus for vminsert, vmselect and vmstorage components, since their metric naming can clash as with vm_app_uptime_seconds mentioned above.
valyala
on 18 Nov 2019
Hi @oOHenry !
I totally agree with @valyala - it is recommended to have separate scrape jobs. Pls see example of Prometheus configuration in our docker-compose env. This also helps to separate process metrics for each application:
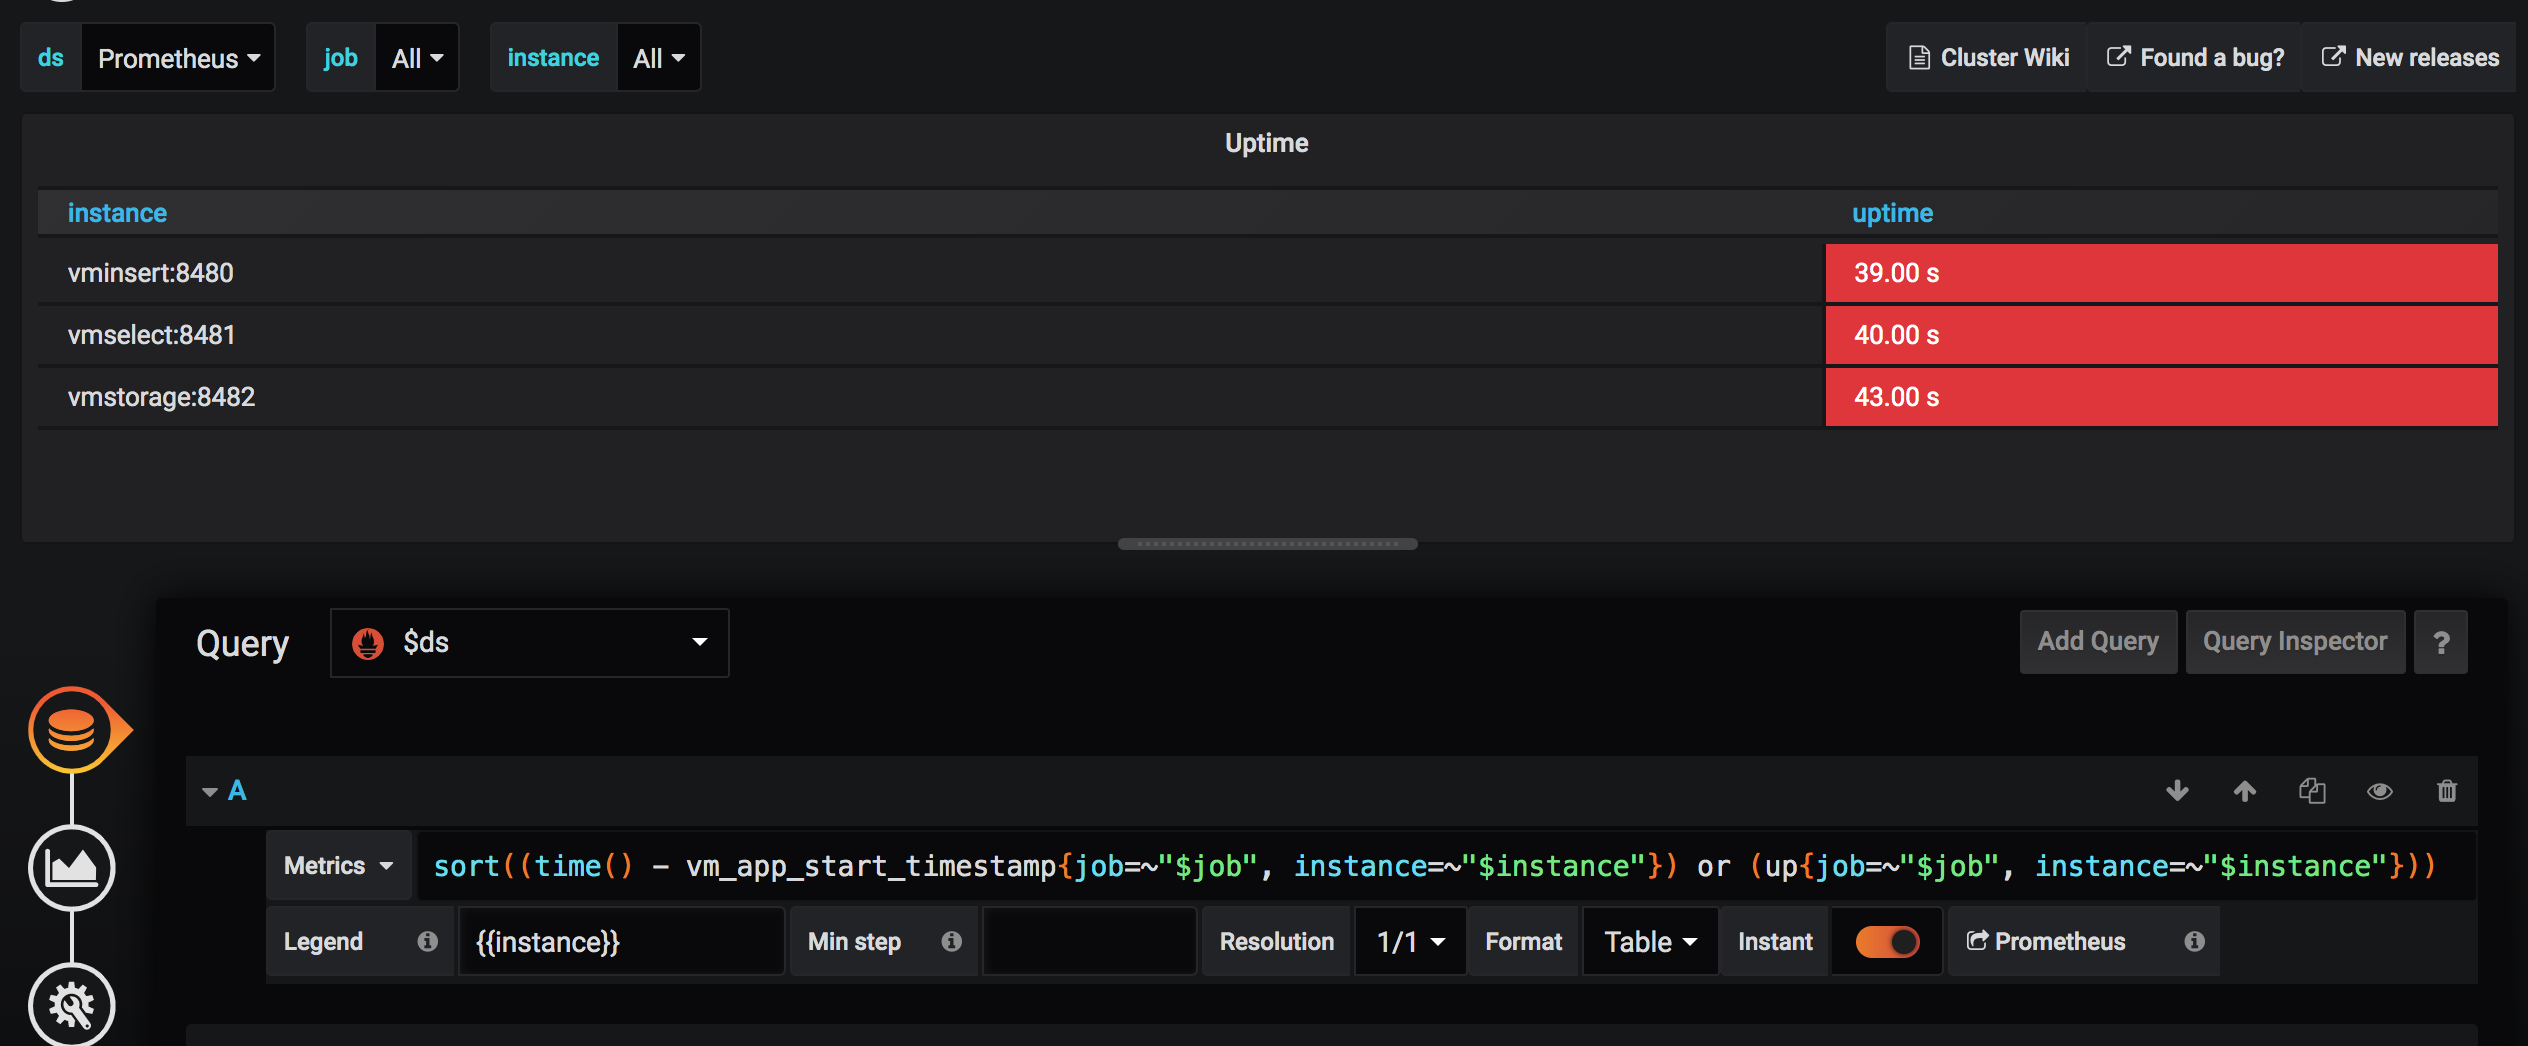
So with separate jobs Uptime panel should work as expected:
 hagen1778
on 22 Nov 2019
hagen1778
on 22 Nov 2019
Ok, thanks for clarifying. I think we can close this issue.
oOHenry
on 22 Nov 2019
Related issues
 prdatur
·
3Comments
prdatur
·
3Comments
 genericgithubuser
·
4Comments
valyala
·
4Comments
genericgithubuser
·
4Comments
valyala
·
4Comments
 Serrvosky
·
3Comments
Serrvosky
·
3Comments
 sh0rez
·
3Comments
sh0rez
·
3Comments