Victoriametrics: Query taking more than a minute to give the data
Describe the bug
We are running the below queries using Grafana in a single panel.
sort_desc(avg by (container,namespace) (max by (app,kubernetes_cluster, namespace, container, pod) (rate(container_cpu_usage_seconds_total{pod=~"(api-.*)|(api.*)",pod!~"api-auth-.*”,app=~”app-01”}[1m]))/ ignoring(pod) group_left (app,kubernetes_cluster, namespace, container)(max by (app,kubernetes_cluster, namespace, container) (kube_pod_container_resource_limits_cpu_cores{pod=~"(api-.*)|(api.*)",pod!~"api-auth-.*”,app=~”app-01”}))))

sort_desc(max by (container,namespace) (max by (app,kubernetes_cluster, namespace, container, pod) (rate(container_cpu_usage_seconds_total{pod=~"(api-.*)|(api.*)",pod!~"api-auth-.*”,app=~”app-01”}[1m]))/ ignoring(pod) group_left (app,kubernetes_cluster, namespace, container)(max by (app,kubernetes_cluster, namespace, container) (kube_pod_container_resource_limits_cpu_cores{pod=~"(api-.*)|(api.*)",pod!~"api-auth-.*”,app=~”app-01”}))))
With Prometheus as the datasource, we are getting a response in 1-2 seconds. Victoriametrics is taking unusually long time to get the response (duration logged is 1m52.205813616s). At times I get a 504 response.
Expected behavior
The performance should be same or better than that of prometheus
Version
docker image tag: 1.26.0-cluster
Additional context
- We are running clustered victoriametrics in GKE.
- For vmstorage, the data is stored in a HDD persistent disk.
- There are 2pods running for each component
- RAM & CPU are as below:
- vmstorage (3 cpu & 15 Gi memory) *2
- vmselect (1 cpu & 10 Gi memory) * 2
- vminsert (4 cpu & 6 Gi memory) * 2
- vm_cache_entries{type="storage/hour_metric_ids"}
- vmstorage-0 : 1546807
- vmstorage-1 : 1210255
- Graph for count(container_cpu_usage_seconds_total), count(kube_pod_container_resource_limits_cpu_cores) and count({pod=~"api.*"})


- count({app="app-01"})
Prometheus : 636008
VictoriaMetrics : 622515
 bhavith
All 42 comments
The number of active time series - 1.5 million per vmstorage pod - and the number of unique time series touched by the query isn't so big - 636K for the label app="app-01". This means that the query should work much faster in general.
- Which time range do you use for the query?
- Could you post graphs for
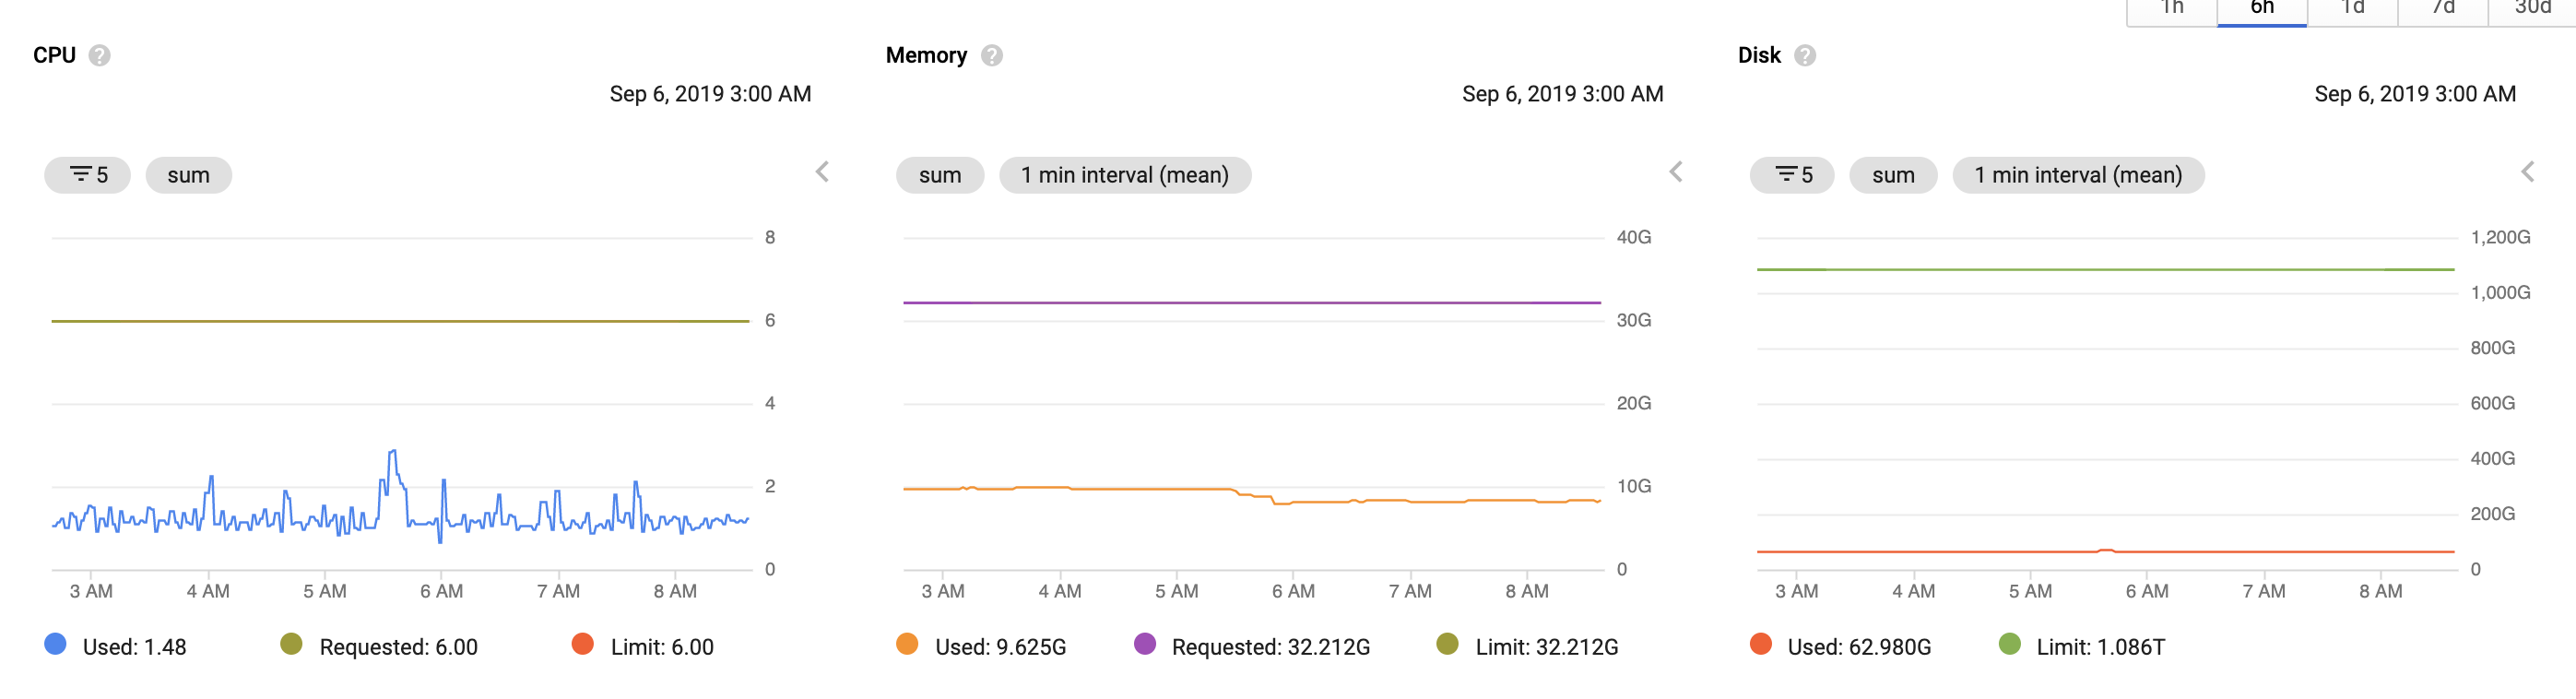
sum(vm_rows) by (type, instance)query? - Could you post CPU usage and disk usage graphs for
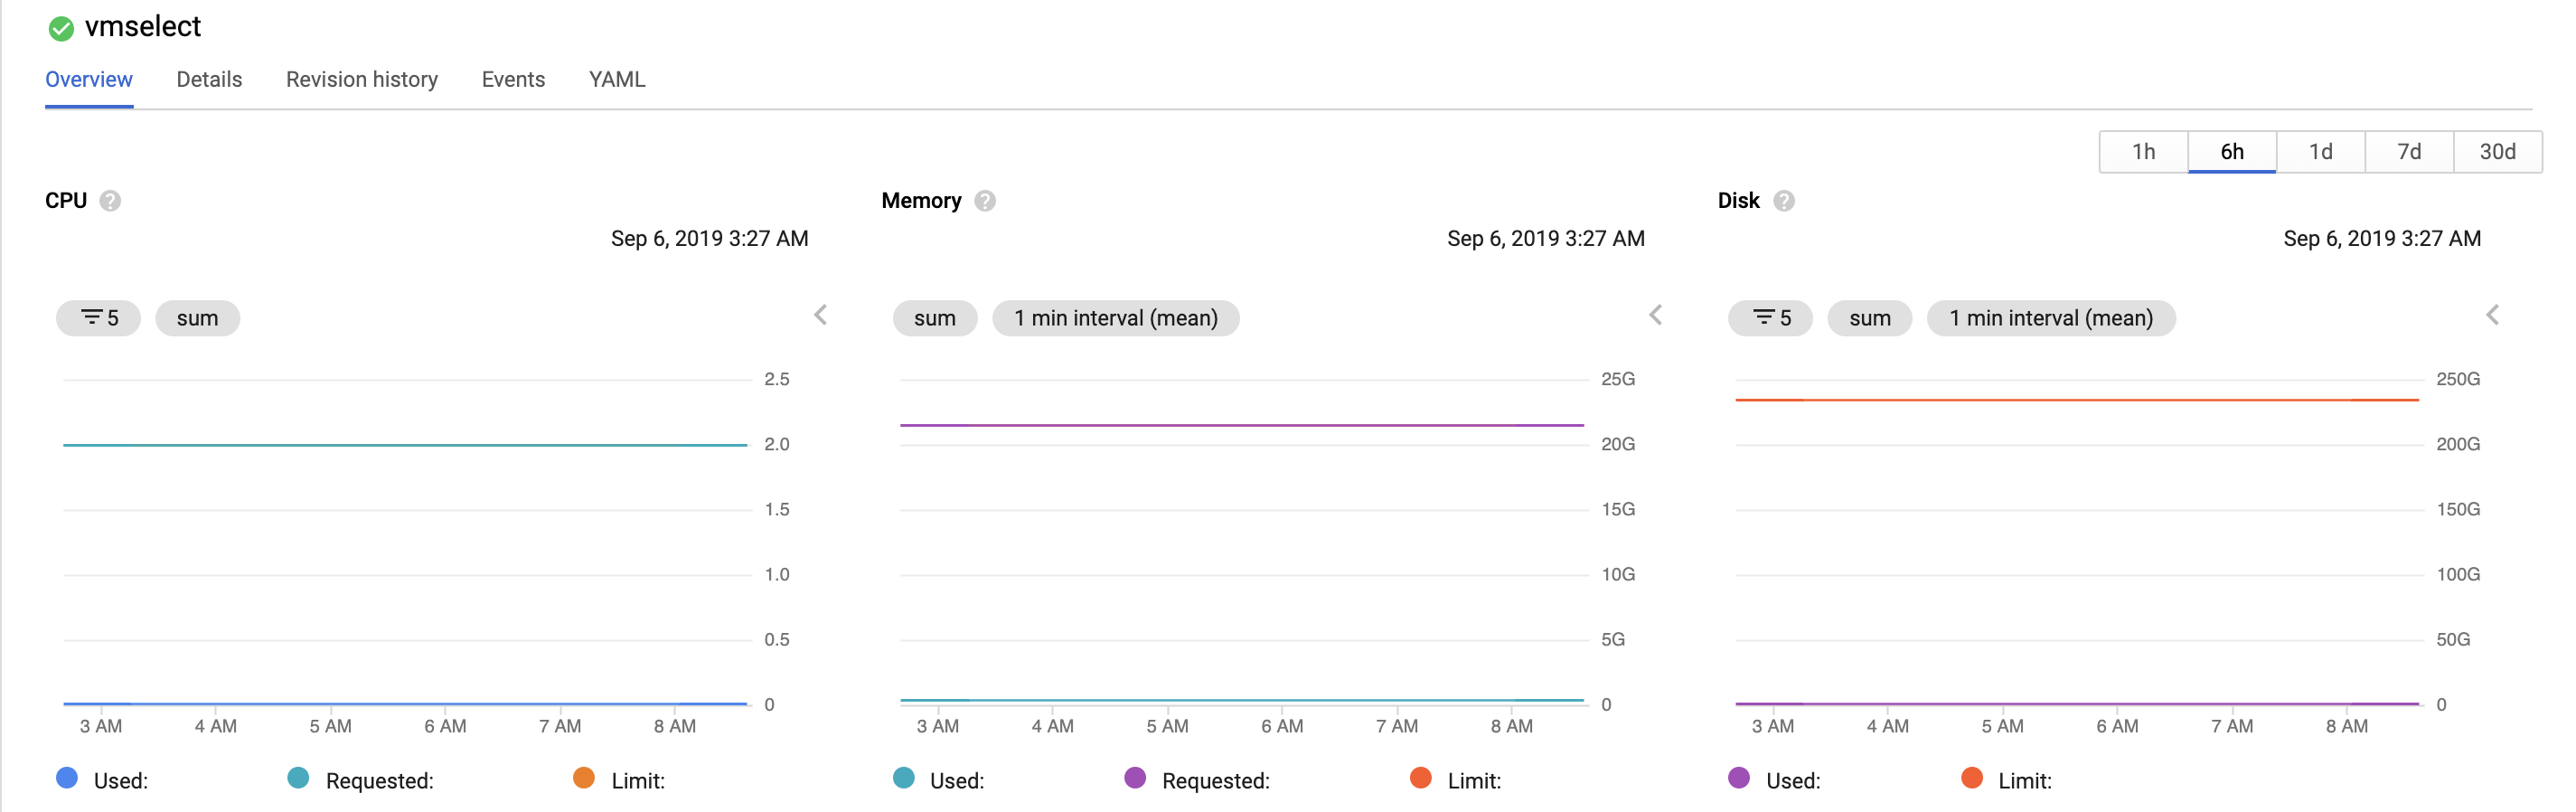
vmstorageandvmselectpods?
 valyala
on 5 Sep 2019
valyala
on 5 Sep 2019
- Its pretty slow even if I query data for the last 15 minutes
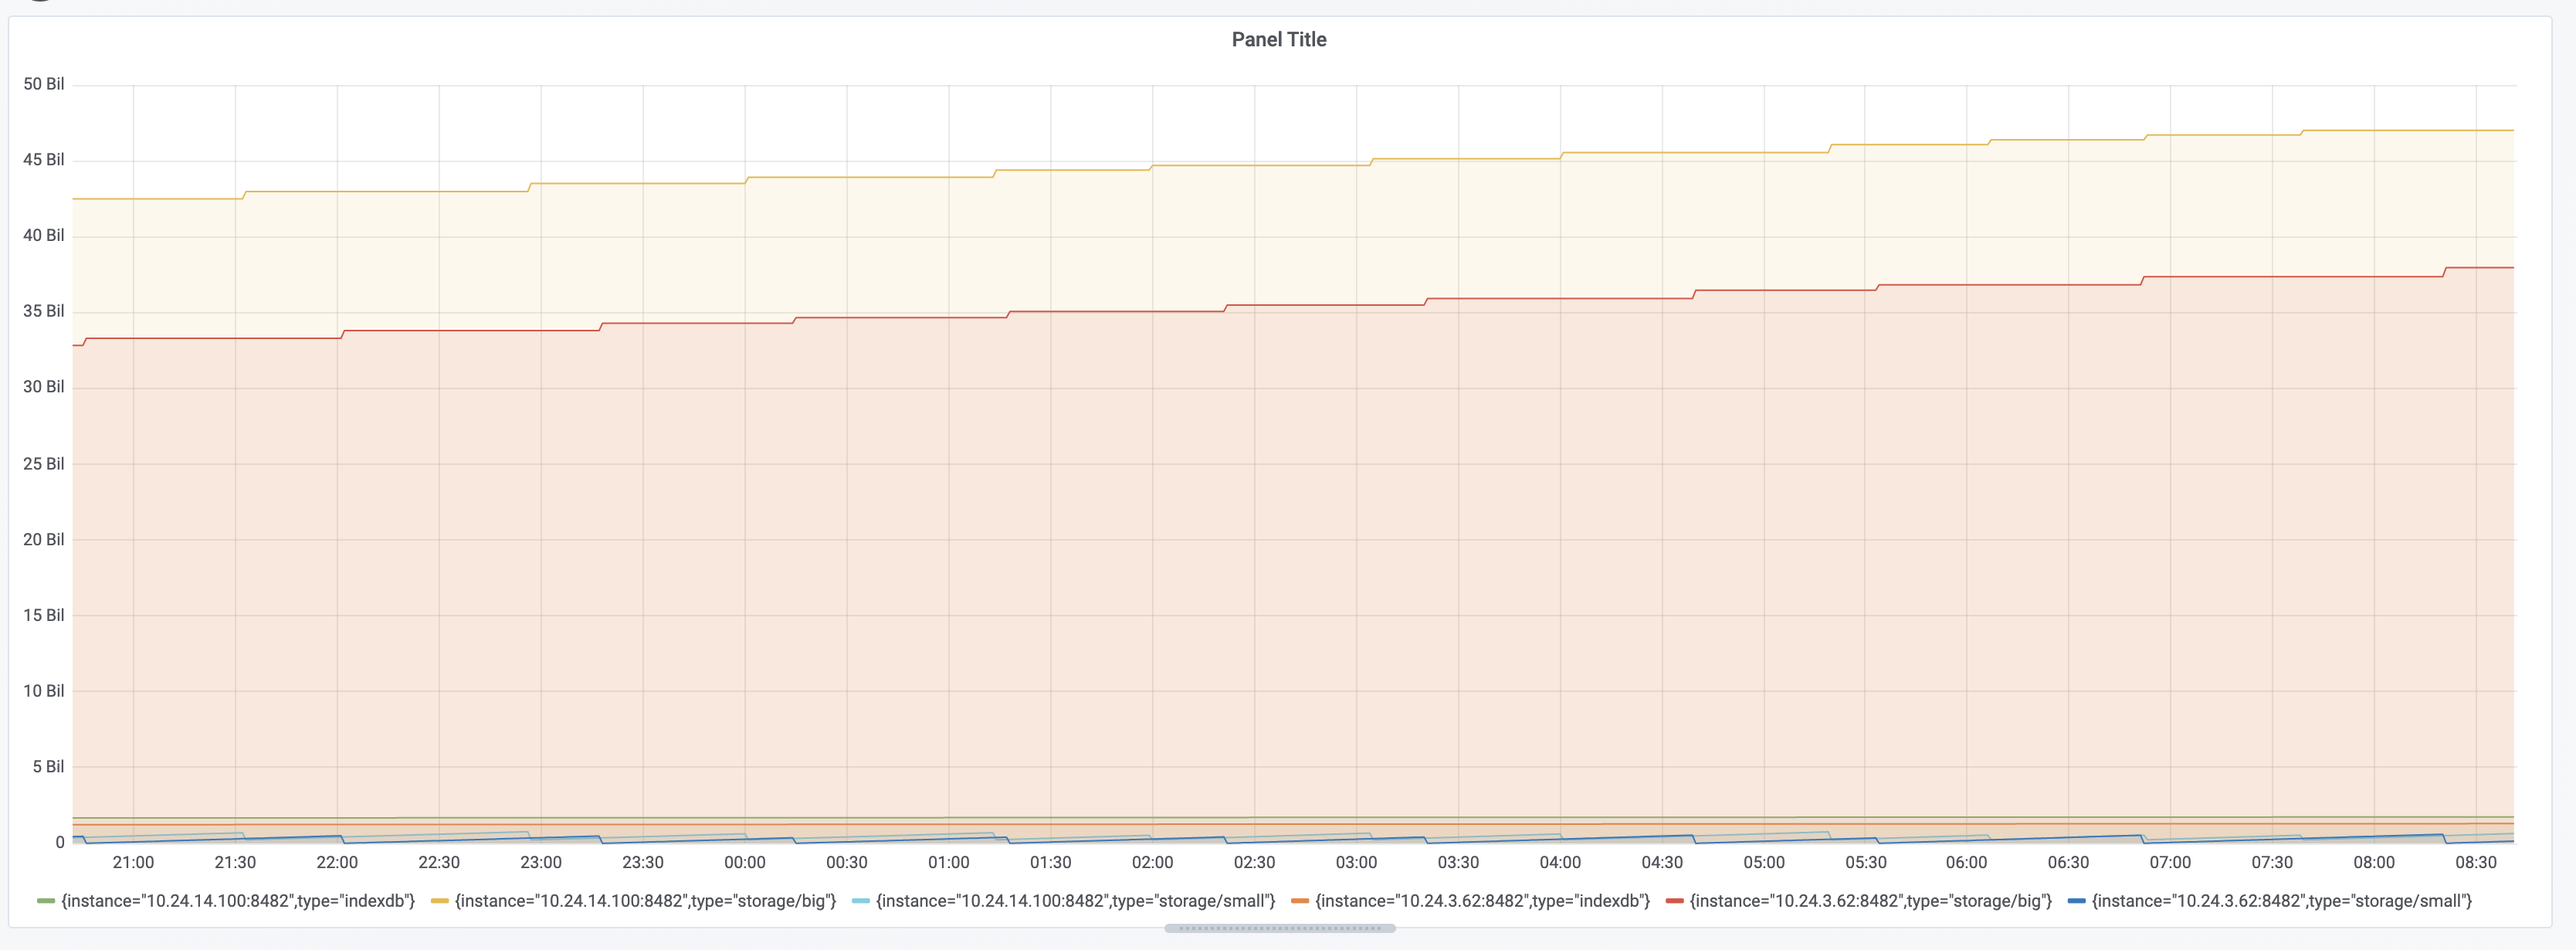
Resource usage
vmstorage
vmselect
bhavith
on 6 Sep 2019
@bhavith , thanks again for the detailed information. Sorry for late response - I was busy with other tasks.
Graphs show plenty of spare CPU time and RAM. Could you compare response times for the following queries executed on VictoriaMetrics and Prometheus?
1) avg(rate(container_cpu_usage_seconds_total{pod=~"(api-.*)|(api.*)",pod!~"api-auth-.*”,app=~”app-01”}[1m]))
2) avg(rate(container_cpu_usage_seconds_total{pod=~"api.*",app=~”app-01”}[1m]))
3) avg(rate(container_cpu_usage_seconds_total{app=~”app-01”}[1m]))
4) max(kube_pod_container_resource_limits_cpu_cores{pod=~"(api-.*)|(api.*)",pod!~"api-auth-.*”,app=~”app-01”})
5) max(kube_pod_container_resource_limits_cpu_cores{pod=~"(api-.*)|(api.*)",app=~”app-01”})
6) max(kube_pod_container_resource_limits_cpu_cores{app=~”app-01”})
7) max(kube_pod_container_resource_limits_cpu_cores)
I suspect that VictoriaMetrics could hit non-optimal path on certain label filters. Queries above could point to the slow path, so it can be fixed.
If all the queries above will remain slow on VictoriaMetrics comparing to Prometheus, then could you temporarily migrate vmstorage and vminsert to GCP instances with more vCPUs and verify whether this improves response times?
valyala
on 13 Sep 2019
Thanks @valyala
Will check and let you know the outcome.
bhavith
on 13 Sep 2019
Hi @valyala All the queries are taking 4-5 seconds on Victoriemetrics. Same queries took only a few milliseconds while queried on Prometheus. I will discuss with the team about migrating VictoriaMetrics to GCP and get back to you.
(Sorry, took me a while to respond. was stuck with something else.)
bhavith
on 17 Sep 2019
Try building VictoriaMetrics from the latest commit at cluster branch according to these instructions. It contains certain performance improvements for queries over database with big number of unique time series. Could you upgrade all the cluster components to this build and verify query performance after a hour of warm-up?
valyala
on 21 Sep 2019
sure...i will try this. thanks!
bhavith
on 23 Sep 2019
after deploying the new build, the vmstorage is highly unstable and its going OOM.
Error : panic: FATAL: cannot write 8635 bytes: write /storage/data/big/2019_09/tmp/15C715F869175308/values.bin: cannot allocate memory goroutine 28 [running]: github.com/VictoriaMetrics/VictoriaMetrics/lib/logger.logMessage(0xa71944, 0x5, 0xc0f97a8280, 0x77, 0x3) github.com/VictoriaMetrics/VictoriaMetrics@/lib/logger/logger.go:124 +0x586 github.com/VictoriaMetrics/VictoriaMetrics/lib/logger.logLevel(0xa71944, 0x5, 0xa82300, 0x20, 0xc0bf9b36e8, 0x2, 0x2) github.com/VictoriaMetrics/VictoriaMetrics@/lib/logger/logger.go:78 +0x112 github.com/VictoriaMetrics/VictoriaMetrics/lib/logger.Panicf(...) github.com/VictoriaMetrics/VictoriaMetrics@/lib/logger/logger.go:62 github.com/VictoriaMetrics/VictoriaMetrics/lib/fs.MustWriteData(0x7f34dc3f4170, 0xc0c4d6c810, 0xc11af7a000, 0x21bb, 0x3000) github.com/VictoriaMetrics/VictoriaMetrics@/lib/fs/fs.go:326 +0x209 github.com/VictoriaMetrics/VictoriaMetrics/lib/storage.(blockStreamWriter).WriteExternalBlock(0xc13cc6cd80, 0xc023076540, 0xc0bf9b3ae0, 0xc0000dc130) github.com/VictoriaMetrics/VictoriaMetrics@/lib/storage/block_stream_writer.go:171 +0x263 github.com/VictoriaMetrics/VictoriaMetrics/lib/storage.mergeBlockStreamsInternal(0xc0bf9b3ae0, 0xc13cc6cd80, 0xc1f9199f80, 0xc00232cfc0, 0xc0000dc130, 0xc0095821e0, 0xc0000dc140, 0x0, 0x0) github.com/VictoriaMetrics/VictoriaMetrics@/lib/storage/merge.go:127 +0x10c2 github.com/VictoriaMetrics/VictoriaMetrics/lib/storage.mergeBlockStreams(0xc0bf9b3ae0, 0xc13cc6cd80, 0xc02302f080, 0x3, 0x3, 0xc00232cfc0, 0xc0000dc130, 0xc0095821e0, 0xc0000dc140, 0x10, ...) github.com/VictoriaMetrics/VictoriaMetrics@/lib/storage/merge.go:22 +0x114 github.com/VictoriaMetrics/VictoriaMetrics/lib/storage.(partition).mergeParts(0xc0000dc000, 0xc02302f060, 0x3, 0x4, 0xc00232cfc0, 0x0, 0x0) github.com/VictoriaMetrics/VictoriaMetrics@/lib/storage/partition.go:978 +0x75a github.com/VictoriaMetrics/VictoriaMetrics/lib/storage.(partition).mergeBigParts(0xc0000dc000, 0xe3ea3bea01, 0x956bbe3b442, 0xc009568b48) github.com/VictoriaMetrics/VictoriaMetrics@/lib/storage/partition.go:874 +0x12f github.com/VictoriaMetrics/VictoriaMetrics/lib/storage.(partition).partsMerger(0xc0000dc000, 0xc0bf9b3f78, 0x0, 0xc0001557a8) github.com/VictoriaMetrics/VictoriaMetrics@/lib/storage/partition.go:779 +0x8c github.com/VictoriaMetrics/VictoriaMetrics/lib/storage.(partition).bigPartsMerger(0xc0000dc000) github.com/VictoriaMetrics/VictoriaMetrics@/lib/storage/partition.go:757 +0x55 github.com/VictoriaMetrics/VictoriaMetrics/lib/storage.(partition).startMergeWorkers.func2(0xc0000dc000) github.com/VictoriaMetrics/VictoriaMetrics@/lib/storage/partition.go:750 +0x2b created by github.com/VictoriaMetrics/VictoriaMetrics/lib/storage.(*partition).startMergeWorkers github.com/VictoriaMetrics/VictoriaMetrics@/lib/storage/partition.go:749 +0xc8
bhavith
on 23 Sep 2019
This looks like memory leak :(
Could you stop vmstorage pods, drop -storageDataPath directory on all of these pods and upgrade all the cluster components to Docker image tag v1.28.0-cluster-beta1?
valyala
on 25 Sep 2019
done...looks better than before. But, yeah it has only data from a shorter time now. will see how it is doing.
bhavith
on 25 Sep 2019
There was data corruption bug in v1.28.0-cluster-beta1 and beta2, which result in decoded data block contains unsorted items error. Could you drop all the data and upgrade to v1.28.0-cluster-beta3 with fixed bug?
valyala
on 26 Sep 2019
done...will monitor the performance.
bhavith
on 27 Sep 2019
hi @valyala As the volume of data grows, the query is getting slower. i am using the latest beta version.
bhavith
on 1 Oct 2019
@bhavith , thanks for the update.
Query latency depends on time series churn rate and time range used in the query. Bigger churn rate and bigger time range result in slower queries, since they need to scan more time series.
A few questions:
1) Could you provide query latency numbers for both Prometheus and VictoriaMetrics for different time ranges you use the most? Please mention these time ranges.
2) How do query latency numbers compare for the latest beta (v1.28.0-beta5) and the latest stable release (v1.27.3)?
3) Could you provide memory usage numbers between v1.27.3 and v1.28.0-beta5? You can use process_resident_memory_bytes metric exported by VictoriaMetrics.
valyala
on 6 Oct 2019
@bhavith , try upgrading to v1.28.0 and see how it is going.
valyala
on 9 Oct 2019
@valyala Deployed v1.28.0-cluster. We are running a few checks. Will let you know the details.
bhavith
on 10 Oct 2019
hi @valyala i was just comparing the response time for a part of the query. it seems even kube_pod_container_resource_limits_cpu_cores is slower in victoriametrics compared to Prometheus. Prometheus takes less than a second to give the data, wherein victoriametrics is taking around 10 seconds. Similar results for container_cpu_usage_seconds_total.
bhavith
on 23 Oct 2019
Thanks for the update, @bhavith !
Could you provide details for the following questions:
- Do you run VictoriaMetrics v1.28.0 ?
- Could you provide hardware configuration (the number of CPUs, RAM size, storage type and size) for both Prometheus and VictoriaMetrics? Could you provide cluster topology (the number of vminsert, vmselect and vmstorage nodes) and network bandwidth between cluster components?
- How many Prometheus instances write data to VictoriaMetrics?
- Which time range is used for the query?
- Could you provide a graph for
vm_rows{type="indexdb"}metric during the last 2 days? - Which retention is configured in Prometheus and in VictoriaMetrics?
valyala
on 23 Oct 2019
- Yes, we run v1.28.0
- vmsinert - 4 pods (each pod has 4 cpu, 6 Gi)
vmstorage - 2 pods (each pod has 3 cpu, 20Gi, 500 GB standard disk)
vmselect - 2 pods (each pod has 1cpu, 10Gi)
prometheus - 2 pods (each pod has 13cpu, 75 Gi, 1.5 TB disk ) (Usage per pod: 3 cpu, 30Gi, 500 GB )
All pods are running in the same kubernetes cluster. The communication between the pods is between high bandwidth google network. - 2 prometheus instances write data to VM, with unique label
- 15 minutes
- Retention Period:
Prometheus: 30 days
VM: 6 months
bhavith
on 23 Oct 2019
Could you temporarily increase the number of CPU cores on vmselect pods from 1cpu to 4cpus and see whether the query times change?
valyala
on 24 Oct 2019
Increased the cpu for vmselect. I dont see any difference.
bhavith
on 24 Oct 2019
@bhavith , could you collect CPU profile from vmstorage pod according to these instructions and attach it here? The profile must be collected from port 8482 on vmstorage pod.
valyala
on 29 Oct 2019
@bhavith , try v1.28.1 - it contains performance improvement according to the provided CPU profiles.
valyala
on 31 Oct 2019
@valyala its still taking time to return the data. I dont see much improvement. Do you want me to generate profile and share it once again?
bhavith
on 1 Nov 2019
Do you want me to generate profile and share it once again?
Yes, after upgrading to v1.28.2 and running it for a few hours, since v1.28.1 had a panic on select path.
valyala
on 1 Nov 2019
@bhavith , could you upgrade to v1.29.0 and try running slow queries multiple times in a day after the upgrade? This release of VictoriaMetrics creates per-day inverted index for newly written data. This speeds up queries over time ranges with start times greater than the upgrade day.
valyala
on 12 Nov 2019
@valyala done!!! Will let you know the result.
bhavith
on 12 Nov 2019
We have an issue with the new version. vmstorage failed to turn healthy and I had to revert to the previous version. I will try again later to move to 1.29.0
bhavith
on 12 Nov 2019
@bhavith , could you provide vmstorage error logs for v1.29.0?
valyala
on 12 Nov 2019
There are no errors logged in the container. Just that the readiness probe is failing. Has there been any changes in the parameters or environment variables as a part of the new release?
bhavith
on 12 Nov 2019
Has there been any changes in the parameters or environment variables as a part of the new release?
No. Probably there were issues with downloading Docker image for v1.29.0 during the upgrade?
BTW, if you store VictoriaMetrics data on NFS-based persistent disks, then try v1.29.1, since v1.29.0 had a bug, which prevented from deleting old directories from NFS.
valyala
on 12 Nov 2019
Upgraded to 1.29.1. Still the healtcheck is failing. I could see a few errors in the log.
severity: "ERROR"
 textPayload: "2019-11-13T08:42:02.791+0000 error   net/http/server.go:3053 http: panic serving 10.24.4.6:60996: runtime error: invalid memory address or nil pointer dereference
severity: "ERROR"
 textPayload: "goroutine 67 [running]:
severity: "ERROR"
 textPayload: "net/http.(*conn).serve.func1(0xc026f18000)
severity: "ERROR"
 textPayload: " net/http/server.go:1767 +0x139
severity: "ERROR"
 textPayload: "panic(0x9f02e0, 0xe4bd30)
severity: "ERROR"
textPayload: "  runtime/panic.go:679 +0x1b2
severity: "ERROR"
textPayload: "github.com/VictoriaMetrics/VictoriaMetrics/lib/workingsetcache.(*Cache).UpdateStats(0x0, 0xc00027f720)
severity: "ERROR"
 textPayload: " github.com/VictoriaMetrics/VictoriaMetrics@/lib/workingsetcache/cache.go:224 +0x37
severity: "ERROR"
 textPayload: "github.com/VictoriaMetrics/VictoriaMetrics/lib/storage.(*indexDB).UpdateMetrics(0xc00e362f70, 0xc0e8472ea0)
severity: "ERROR"
textPayload: "  github.com/VictoriaMetrics/VictoriaMetrics@/lib/storage/index_db.go:216 +0x9c
severity: "ERROR"
 textPayload: "github.com/VictoriaMetrics/VictoriaMetrics/lib/storage.(*Storage).UpdateMetrics(0xc0001b0000, 0xc0e8472dc0)
severity: "ERROR"
 textPayload: " github.com/VictoriaMetrics/VictoriaMetrics@/lib/storage/storage.go:386 +0x3cd
severity: "ERROR"
 textPayload: "main.registerStorageMetrics.func1(0x0)
severity: "ERROR"
 textPayload: " github.com/VictoriaMetrics/VictoriaMetrics@/app/vmstorage/main.go:186 +0xfb
severity: "ERROR"
 textPayload: "main.registerStorageMetrics.func3(0xc07ca15300)
severity: "ERROR"
 textPayload: " github.com/VictoriaMetrics/VictoriaMetrics@/app/vmstorage/main.go:196 +0x26
severity: "ERROR"
textPayload: "main.registerStorageMetrics.func6(0x18)
severity: "ERROR"
 textPayload: " github.com/VictoriaMetrics/VictoriaMetrics@/app/vmstorage/main.go:207 +0x26
severity: "ERROR"
textPayload: "github.com/VictoriaMetrics/metrics.(*Gauge).marshalTo(0xc0001b62a8, 0xa8a2d0, 0x20, 0x7efc282bfc38, 0xc07ca15380)
severity: "ERROR"
textPayload: "  github.com/VictoriaMetrics/[email protected]/gauge.go:38 +0x3f
severity: "ERROR"
textPayload: "github.com/VictoriaMetrics/metrics.(*Set).WritePrometheus(0xc0000e4340, 0x7efc282bfc38, 0xc07ca15380)
severity: "ERROR"
textPayload: "  github.com/VictoriaMetrics/VictoriaMetrics@/lib/httpserver/metrics.go:16 +0x44
severity: "ERROR"
textPayload: "github.com/VictoriaMetrics/VictoriaMetrics/lib/httpserver.handlerWrapper(0xb34c40, 0xc07ca15380, 0xc000322b00, 0xc00006d4c0)
severity: "ERROR"
textPayload: "  github.com/VictoriaMetrics/VictoriaMetrics@/lib/httpserver/httpserver.go:140 +0x416
severity: "ERROR"
textPayload: "github.com/VictoriaMetrics/VictoriaMetrics/lib/httpserver.gzipHandler.func1(0xb34c40, 0xc07ca15380, 0xc000322b00)
severity: "ERROR"
textPayload: "  github.com/VictoriaMetrics/VictoriaMetrics@/lib/httpserver/httpserver.go:117 +0x88
severity: "ERROR"
textPayload: "net/http.HandlerFunc.ServeHTTP(0xc000182f10, 0xb35140, 0xc0003602a0, 0xc000322b00)
severity: "ERROR"
textPayload: "  net/http/server.go:2007 +0x44
severity: "ERROR"
textPayload: "net/http.serverHandler.ServeHTTP(0xc01b044000, 0xb35140, 0xc0003602a0, 0xc000322b00)
severity: "ERROR"
textPayload: "  net/http/server.go:2802 +0xa4
severity: "ERROR"
textPayload: "net/http.(*conn).serve(0xc026f18000, 0xb36940, 0xc0000e4180)
severity: "ERROR"
textPayload: "  net/http/server.go:1890 +0x875
severity: "ERROR"
textPayload: "created by net/http.(*Server).Serve
severity: "ERROR"
textPayload: "  net/http/server.go:2927 +0x38e
severity: "ERROR"
textPayload: "2019-11-13T08:42:03.521+0000  info    VictoriaMetrics@/lib/storage/storage.go:640 saved MetricName->TSID cache to "/storage/cache/metricName_tsid" in 764.291067ms; entriesCount: 3189826; sizeBytes: 1780547584
severity: "ERROR"
textPayload: "2019-11-13T08:42:03.521+0000  info    VictoriaMetrics@/lib/storage/storage.go:632 saving MetricID->TSID cache to "/storage/cache/metricID_tsid"...
We detected memory leak in v1.29.1 in the inverted index for recent hour. So new release has been published with the corresponding fix. Could you try v1.29.2?
valyala
on 13 Nov 2019
@valyala the performance for querying the data loaded after the upgrade is quite better now. (Still slower than prometheus though)
bhavith
on 18 Nov 2019
@bhavith , this is great news!
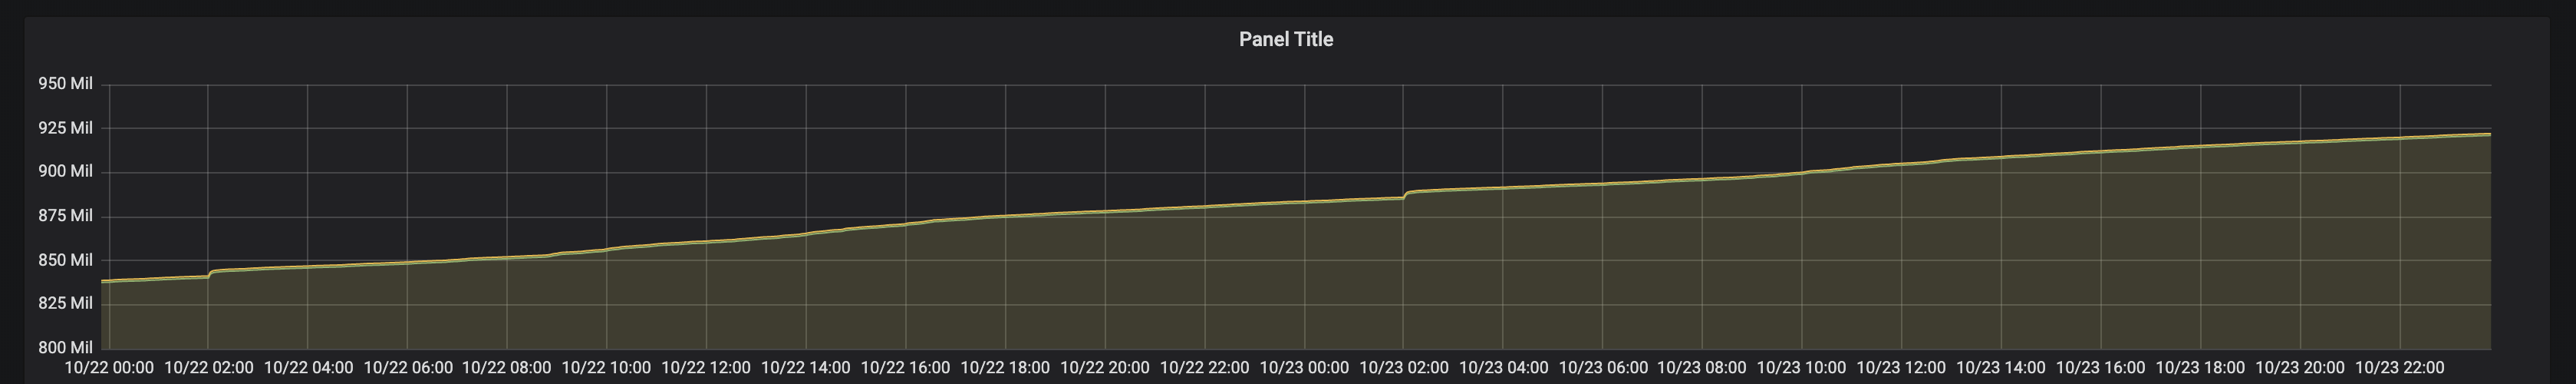
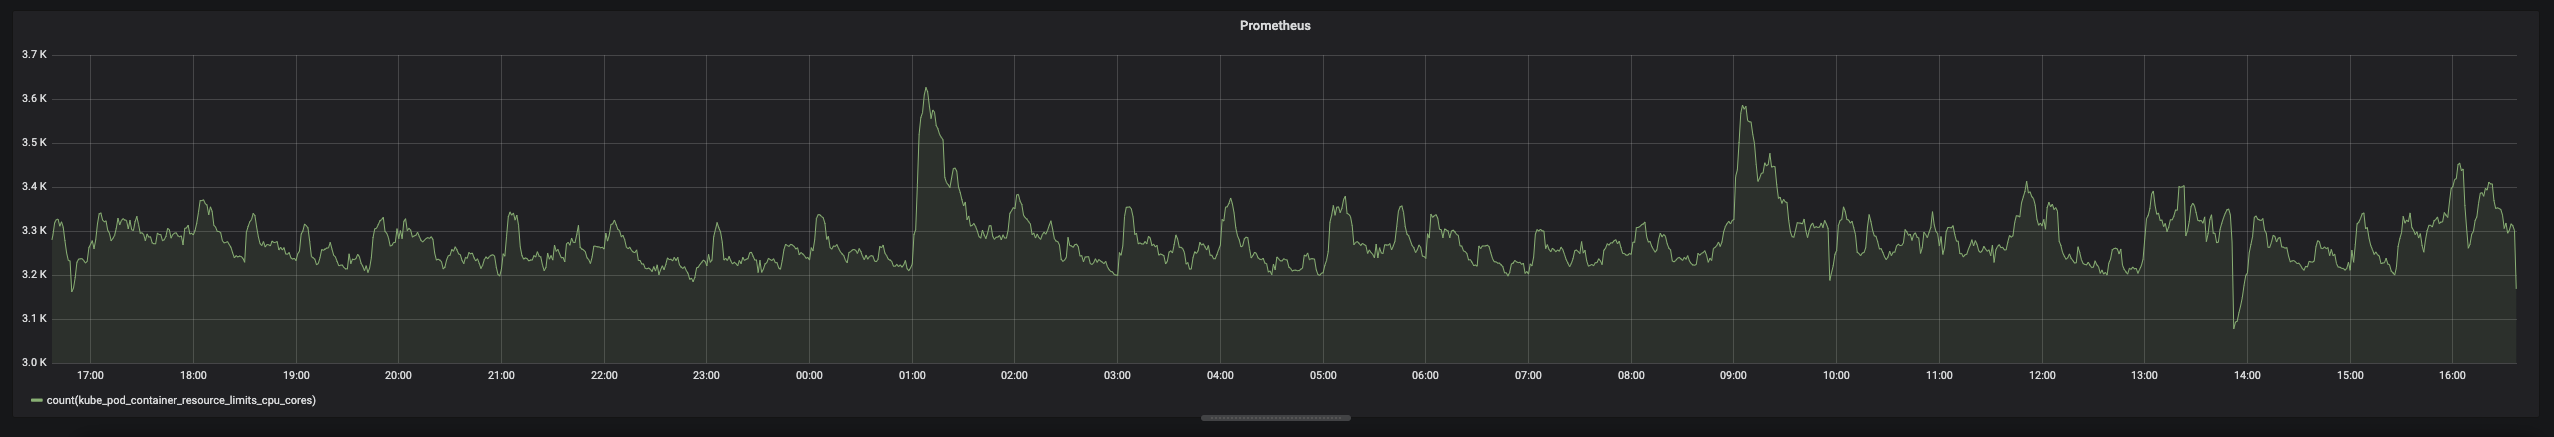
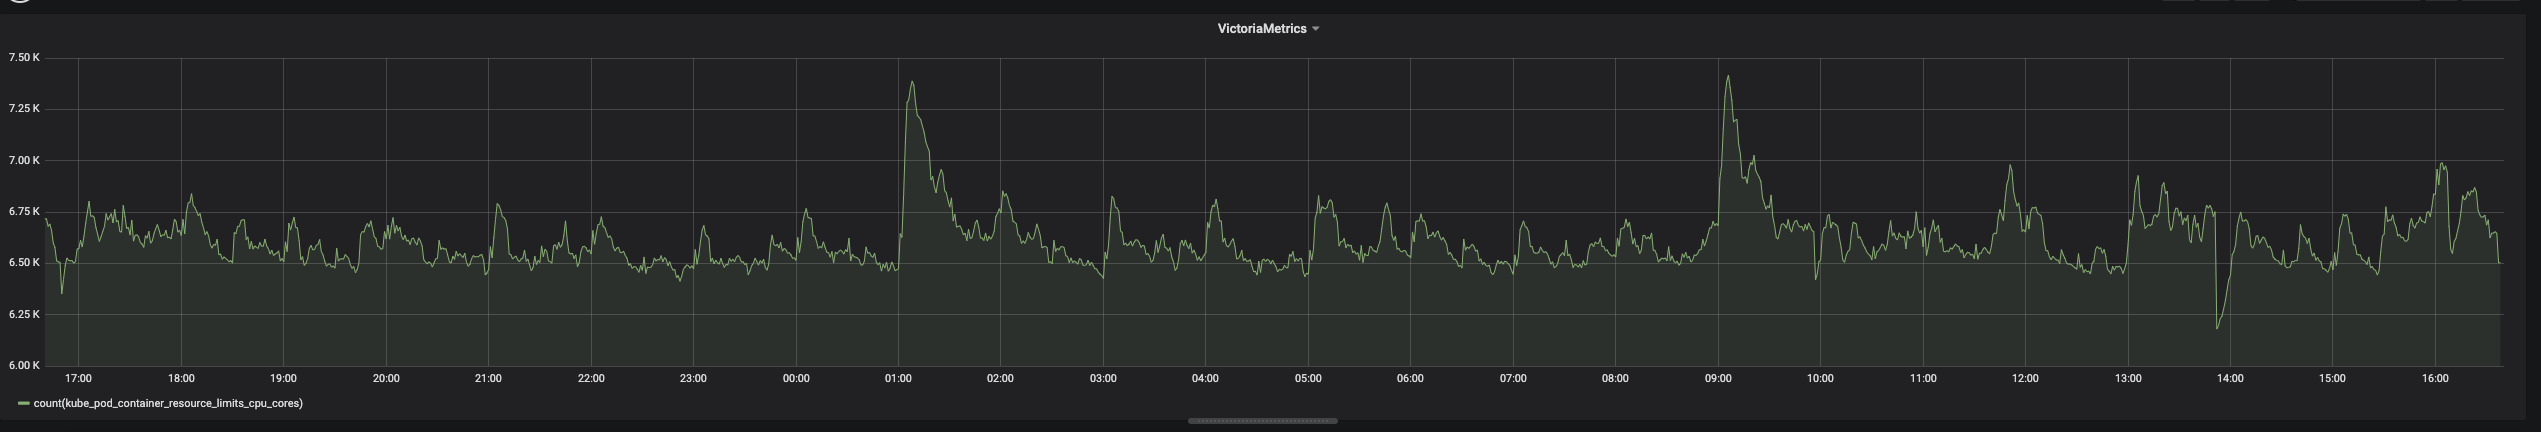
Could you post graphs and timings for the following query on Prometheus and VictoriaMetrics v1.29.4 - count(kube_pod_container_resource_limits_cpu_cores) - on the last 24 hours time range?
valyala
on 18 Nov 2019
Prometheus - 12 seconds
VictoriaMetrics - 1 min 27 seconds
bhavith
on 21 Nov 2019
Thanks!
Could you re-run this query multiple times with a few minutes interval between runs and measure the response times for both Prometheus and VictoriaMetrics? Also could you collect cpu and memory profiles from VictoriaMetrics when executing this query according to these docs and send them to [email protected] ?
Some observations:
1) According to graphs VictoriaMetrics contains 2x more time series than Prometheus - see numbers on the left side of graphs. Probably, multiple Prometheus instances push data into VictoriaMetrics?
2) The number of kube_pod_container_resource_limits_cpu_cores time series is very volatile. This suggests that k8s containers are very frequently re-created.This can lead to high churn rate for these series.
Could you attach graph for the following query for VictoriaMetrics in order to determine the total number of time series with kube_pod_container_resource_limits_cpu_cores name over the last 24h time range?
count(kube_pod_container_resource_limits_cpu_cores default 0)
This query won't work in Prometheus, since it uses default extension from extended PromQL. If this query won't complete for 24 hours time range, then try it for the last 3 hours time range.
valyala
on 21 Nov 2019
Hi @valyala
Thanks for sharing the analysis. I am on leave for a few days. I will share the info once I am back.
Yes, you are correct about two prometheus instances pushing data to Victoriametrics.
Regards
Bhavith
bhavith
on 22 Nov 2019
hi @valyala
Please find below the graph for the query count(kube_pod_container_resource_limits_cpu_cores default 0)

I will get you the rest of the information soon.
bhavith
on 26 Nov 2019
@bhavith , could you upgrade to v1.30.4 and re-run slow queries? This release contains performance improvement according to the last CPU profiles obtained from you.
valyala
on 4 Dec 2019
@valyala The performance has considerably improved after deploying the new version. We are checking a few other details. Will let you know. Please let me know if you want profiles for further improvements.
bhavith
on 5 Dec 2019
Great news! I propose closing this issue, since it became too long, and re-opening new one if you'll encounter slow queries in VictoriaMetrics.
valyala
on 5 Dec 2019
Related issues
 EricAntoni
·
3Comments
EricAntoni
·
3Comments
 oOHenry
·
4Comments
valyala
·
4Comments
oOHenry
·
4Comments
valyala
·
4Comments
 abualy
·
3Comments
abualy
·
3Comments
 0xBF
·
3Comments
0xBF
·
3Comments
Most helpful comment
Great news! I propose closing this issue, since it became too long, and re-opening new one if you'll encounter slow queries in VictoriaMetrics.