Victoriametrics: histogram_quantile results sometimes doesn't work.
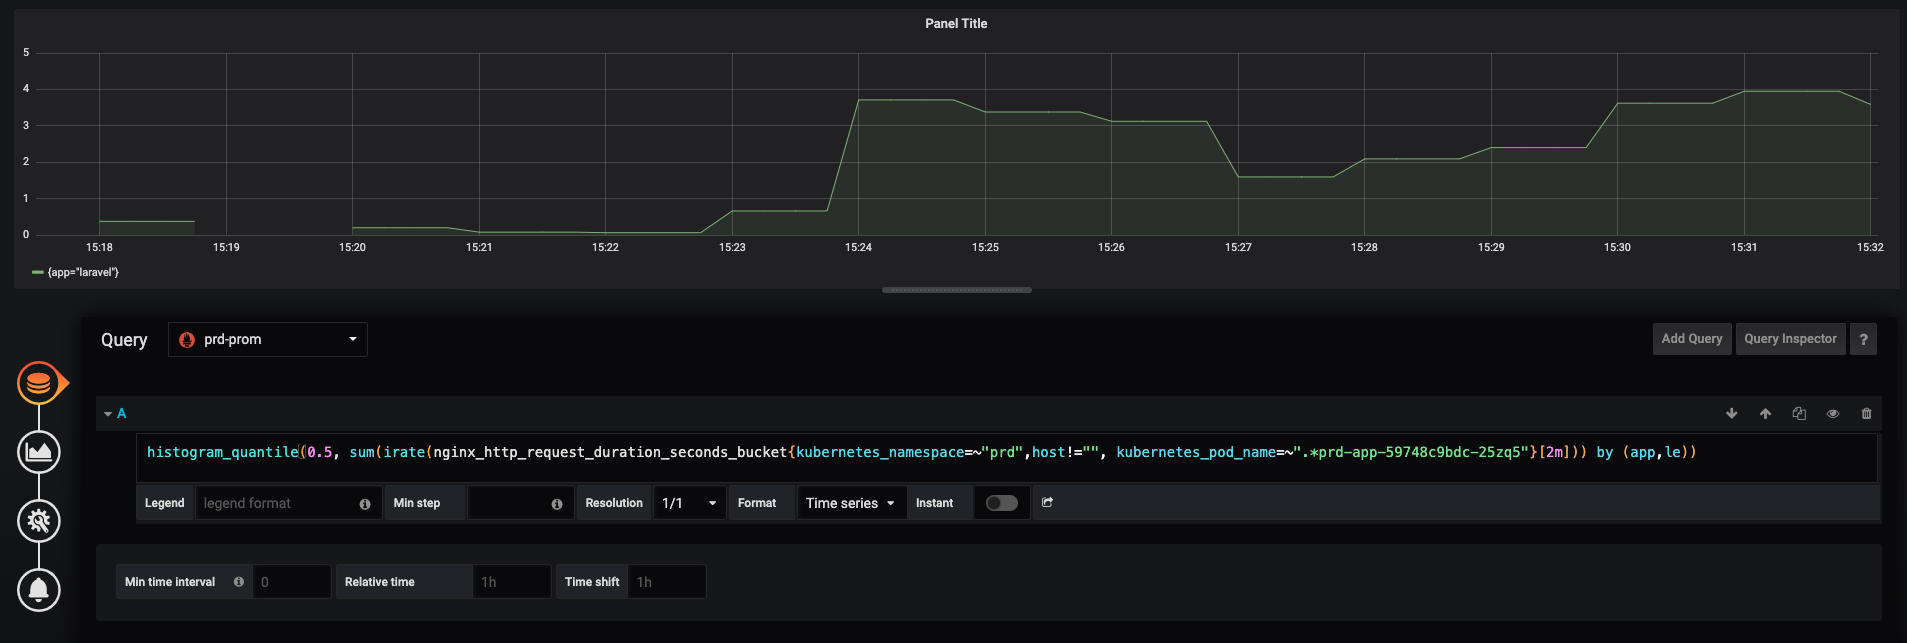
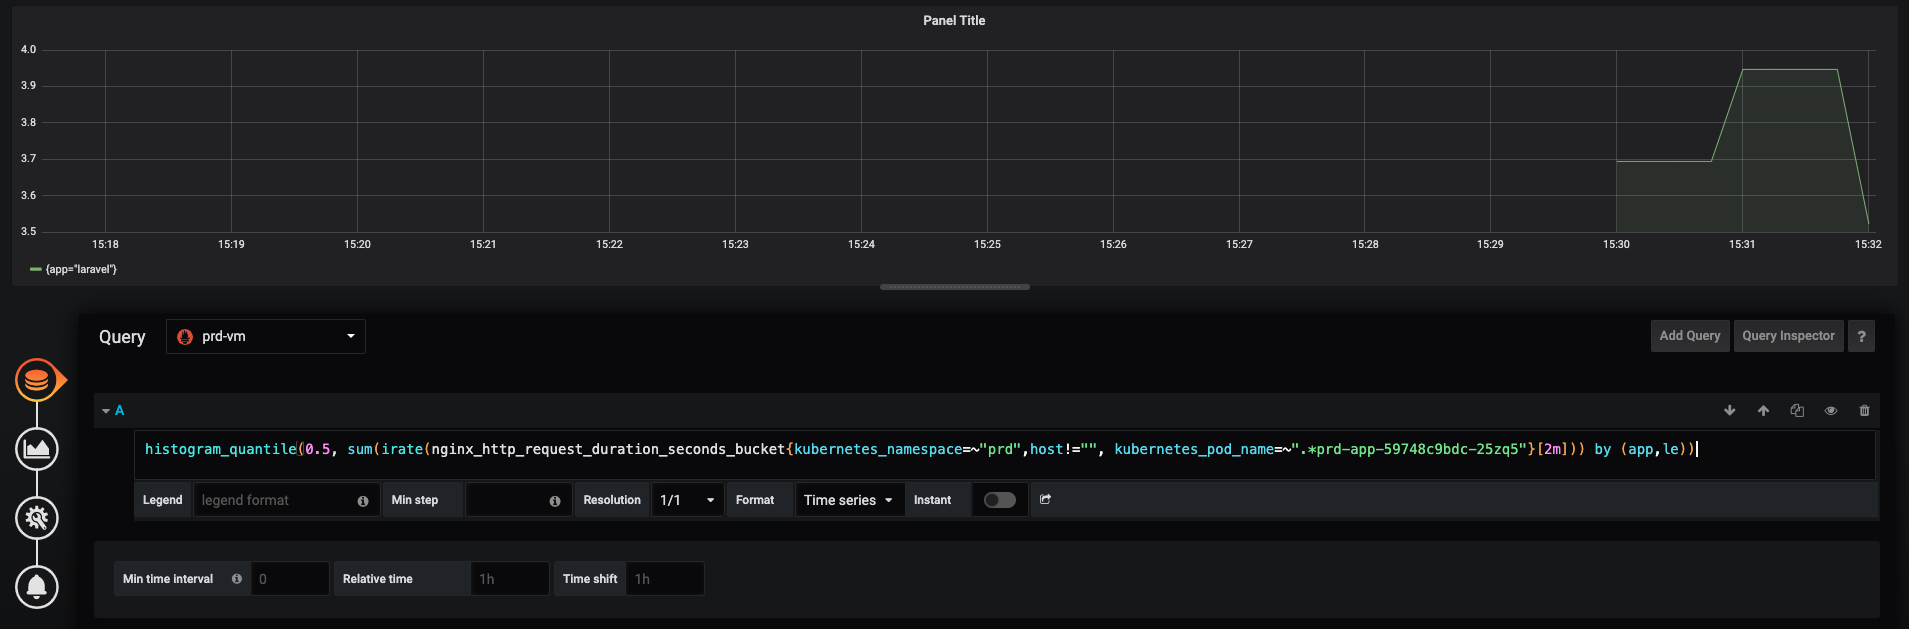
First is Prometheus result, and second one is VictoriaMetrics.
136 seems to be a similar issue.
Do you have any ideas?
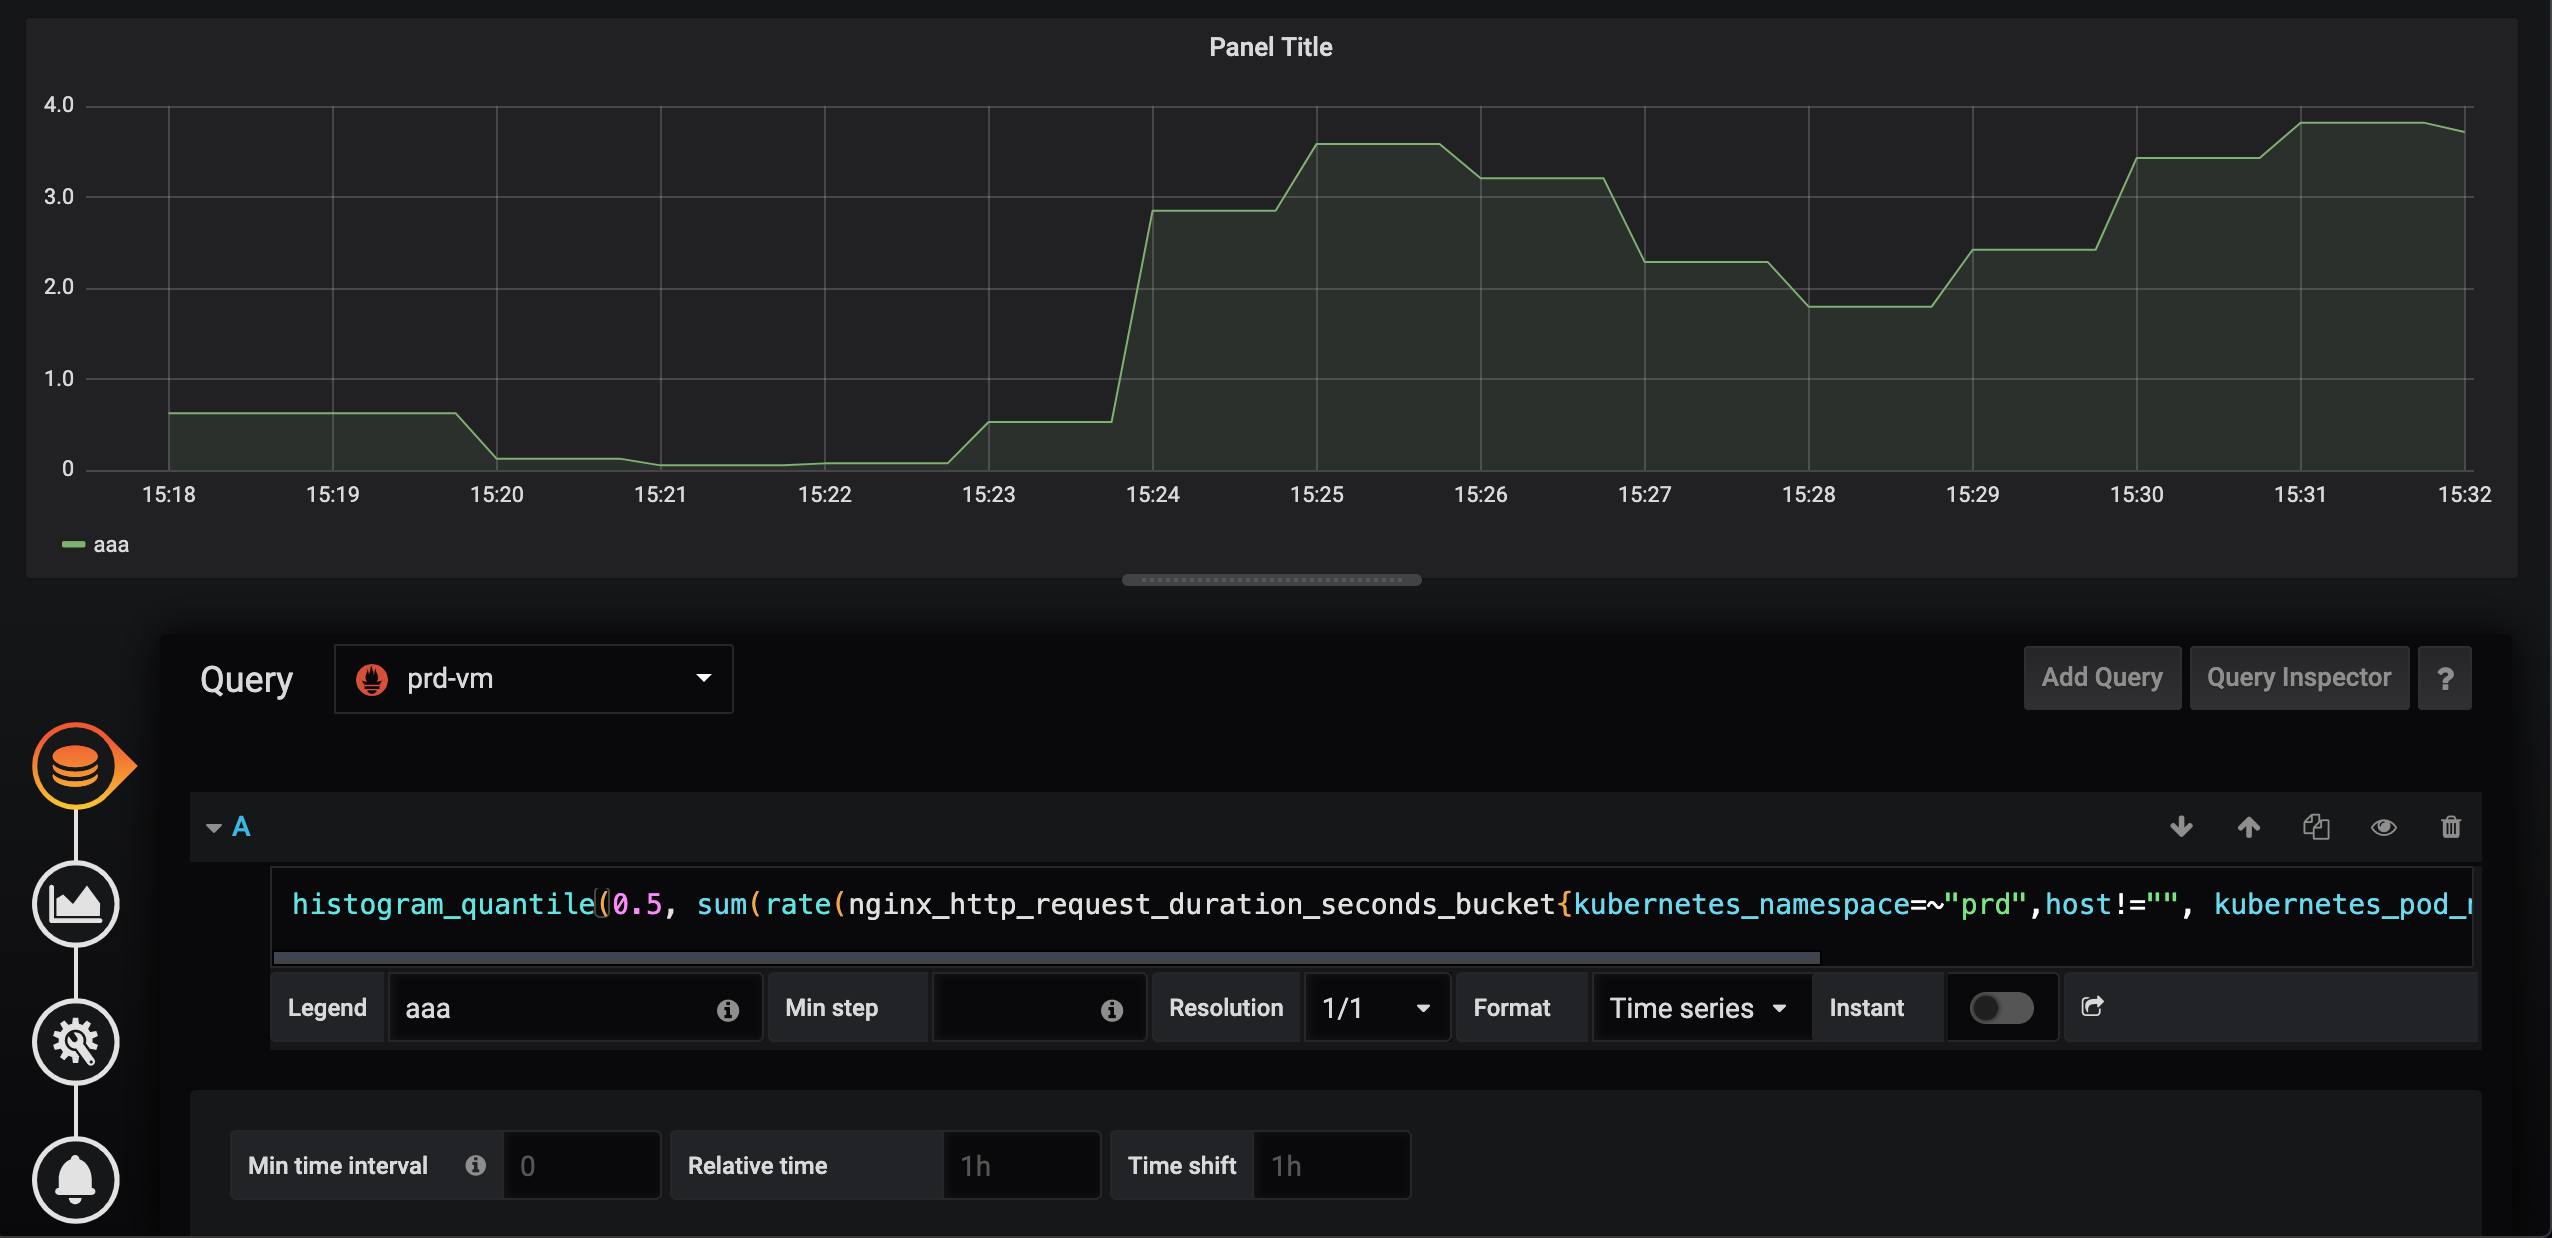
The query is as follows.
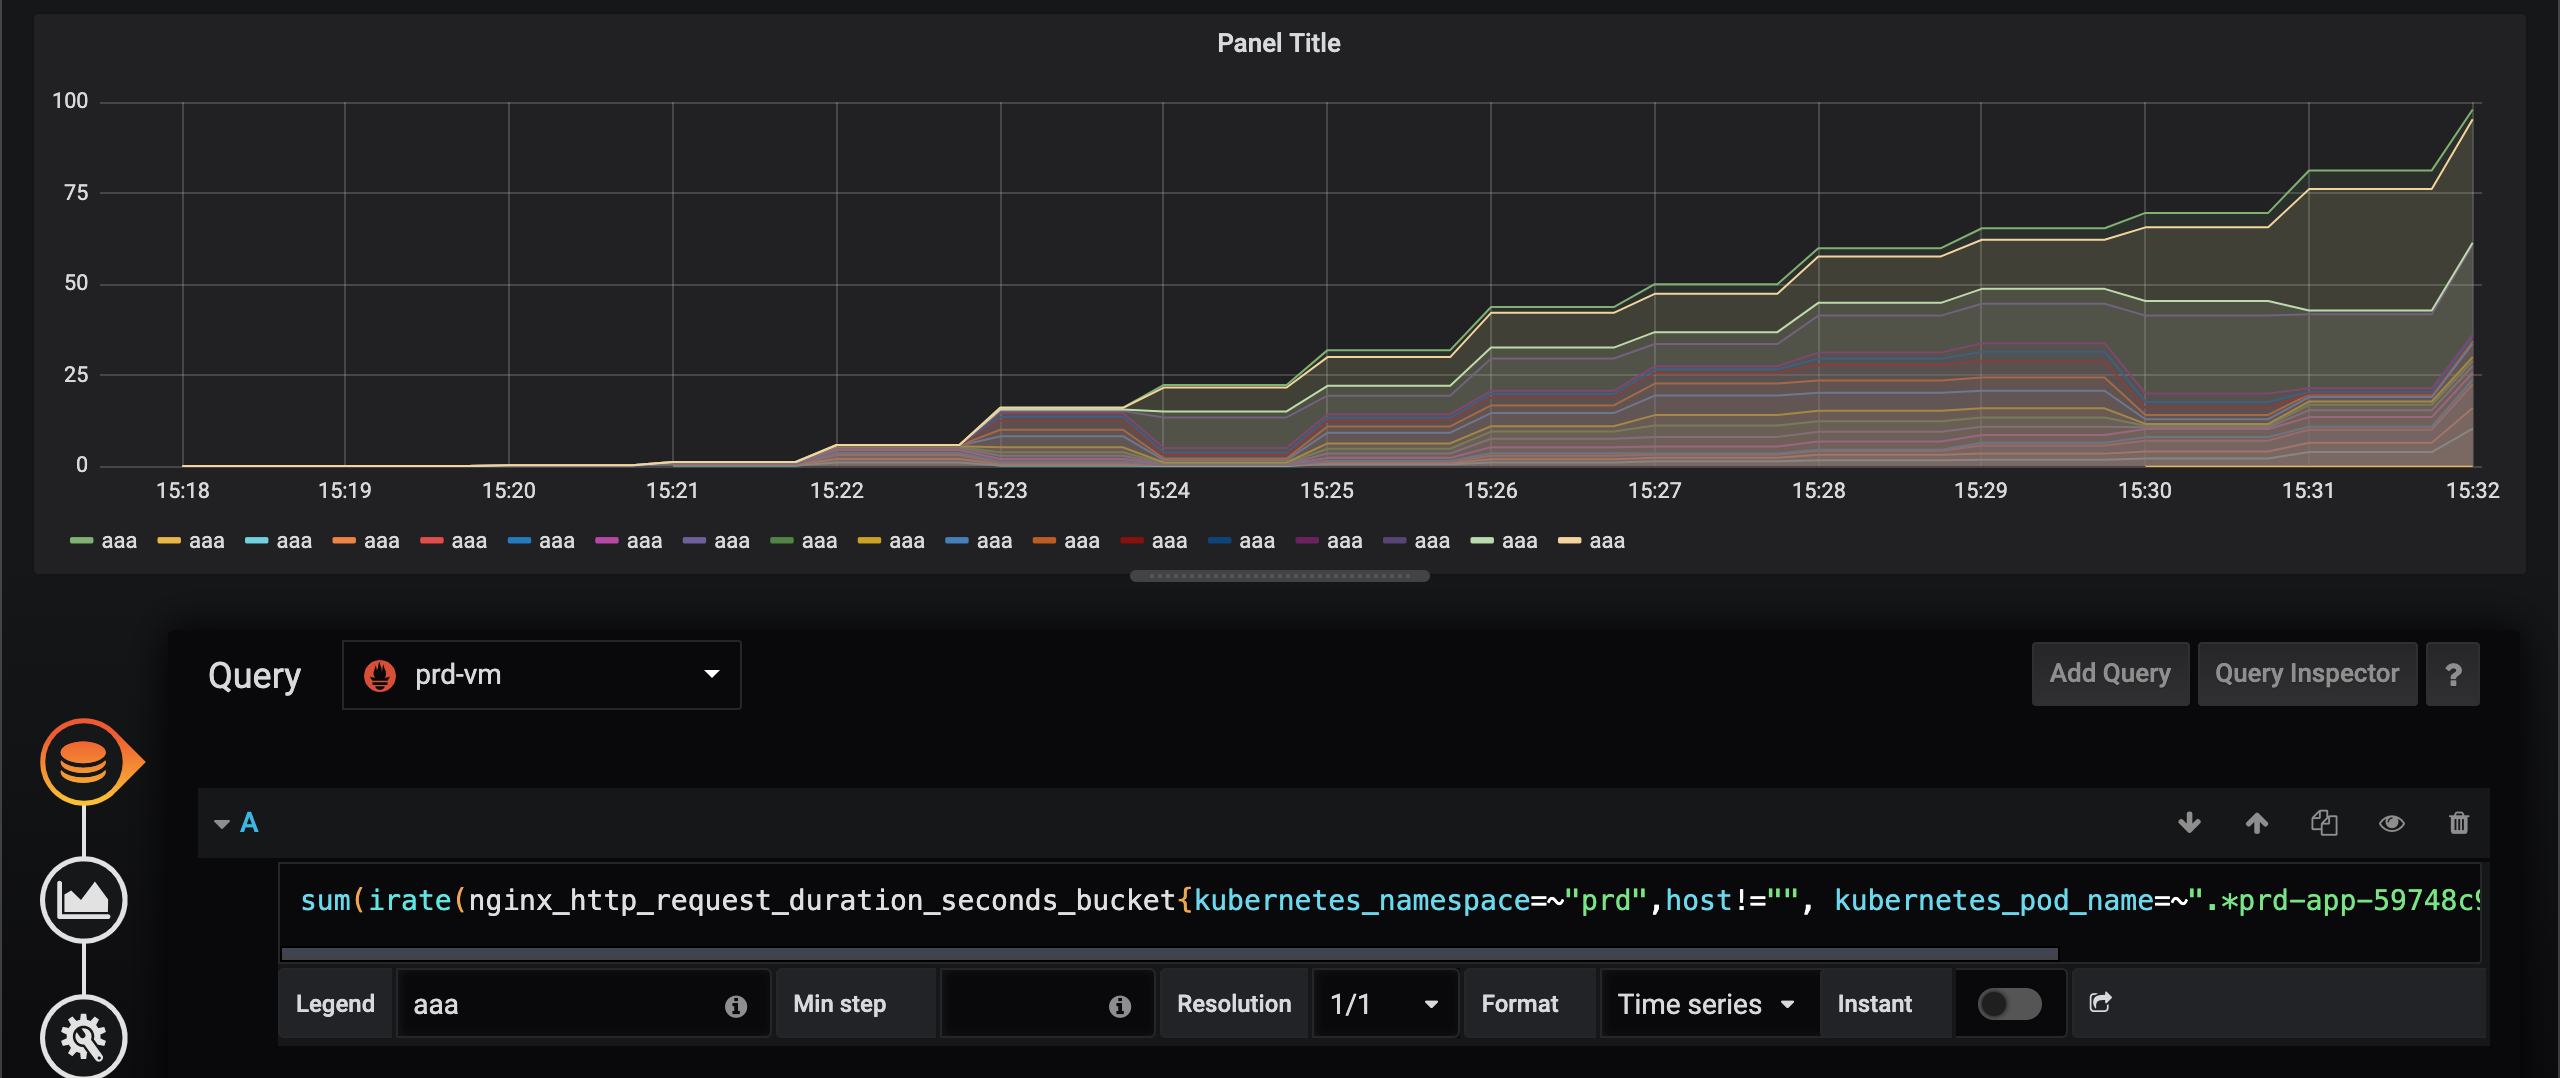
histogram_quantile(0.5, sum(irate(nginx_http_request_duration_seconds_bucket{kubernetes_namespace=~"prd",host!="", kubernetes_pod_name=~".*prd-app-59748c9bdc-25zq5"}[2m])) by (app,le))
Thank you.
 InletOrder
All 5 comments
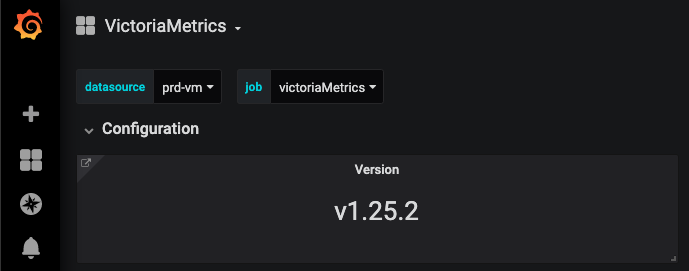
Which version of VictoriaMetrics do you use? It can be located at
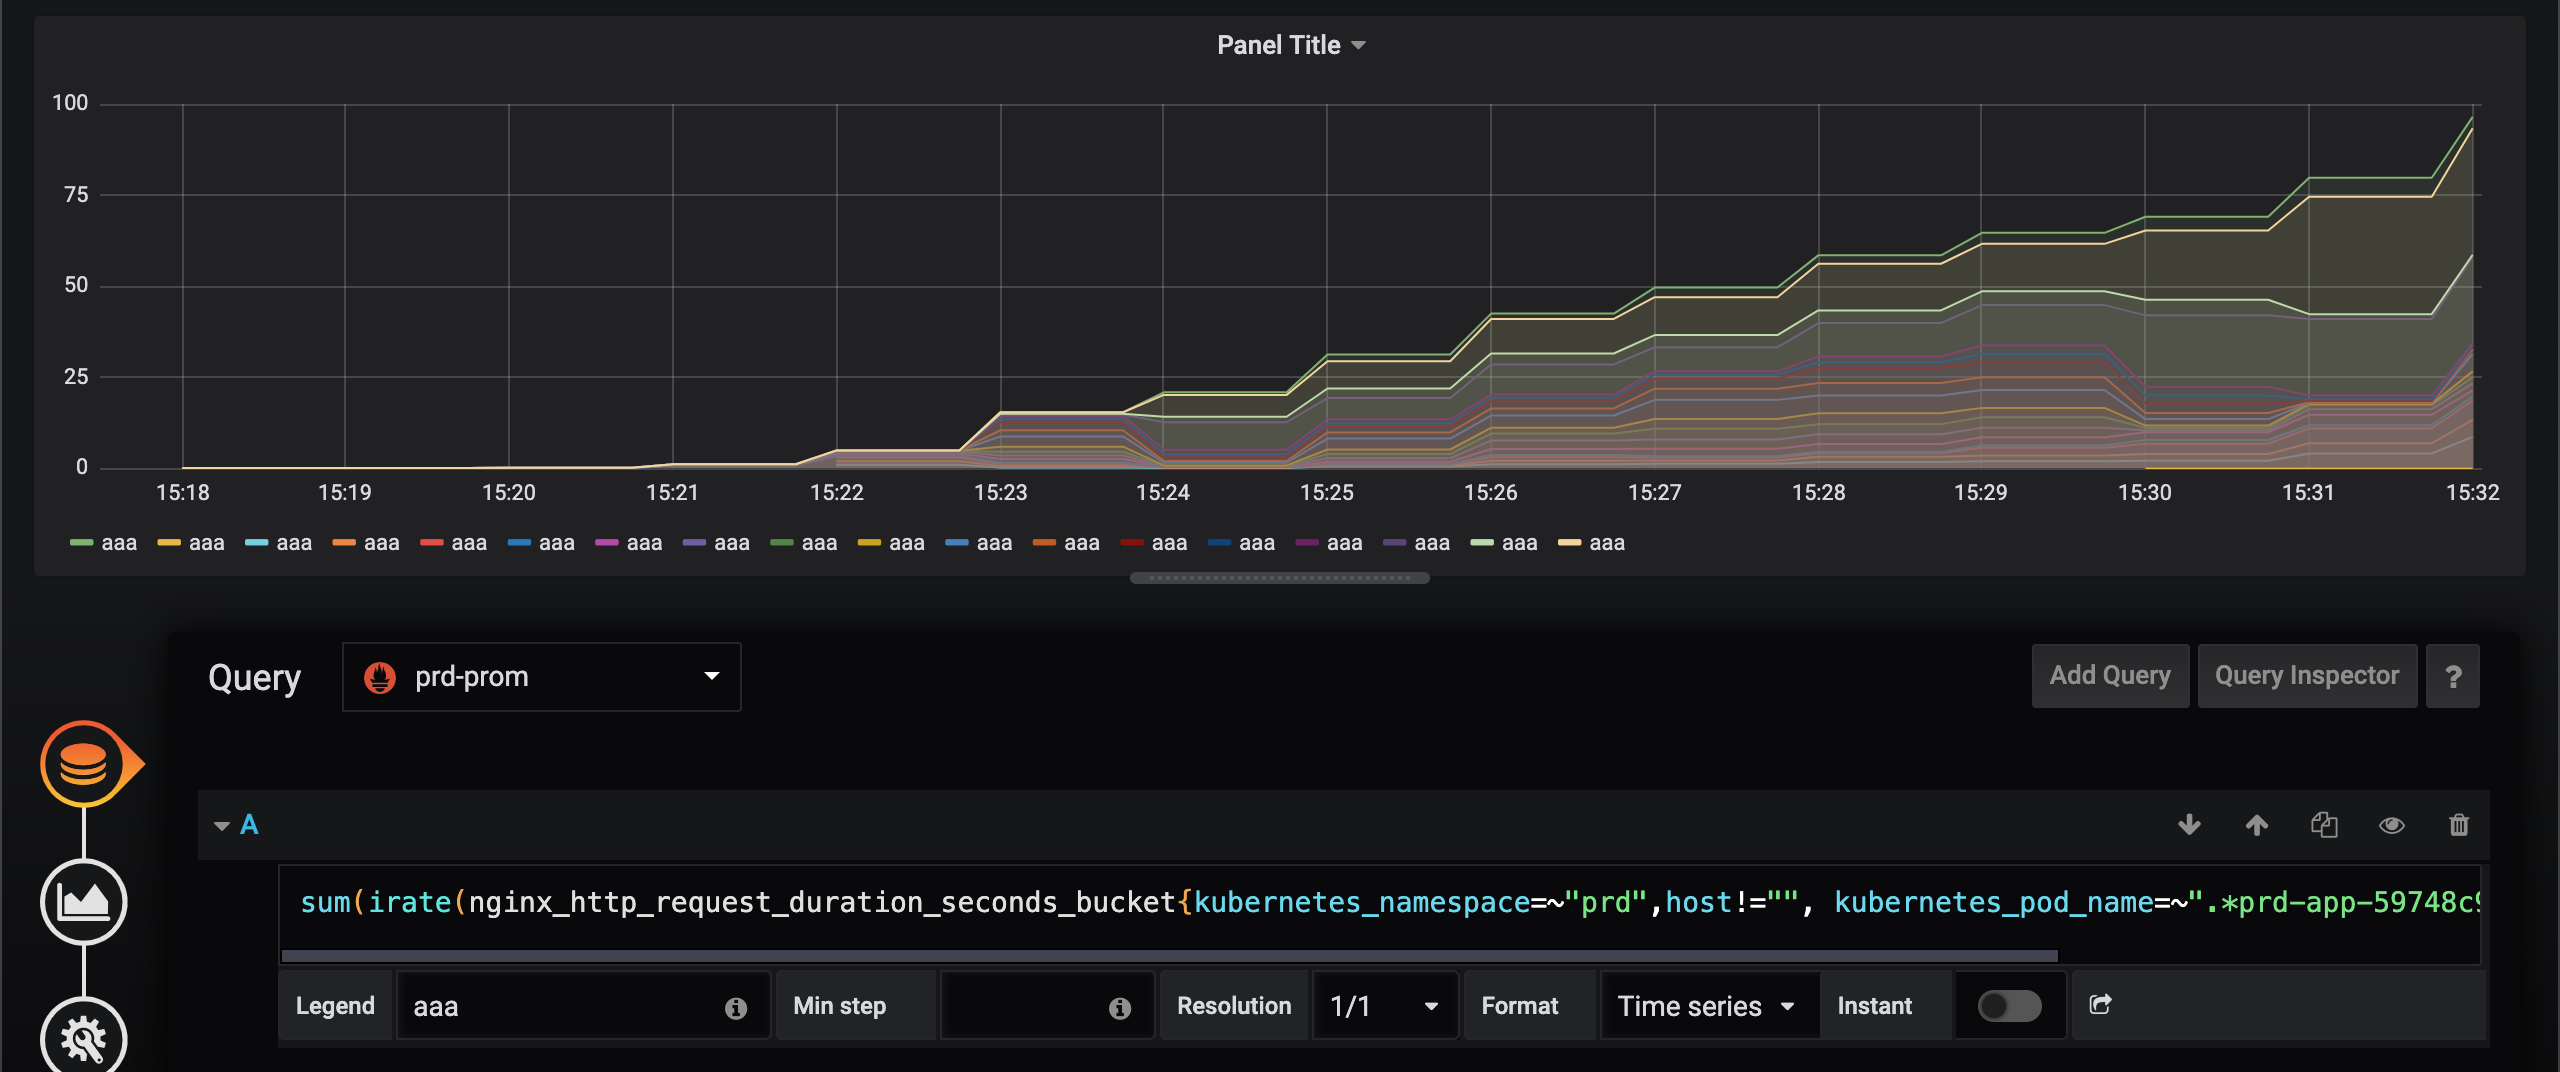
/metricspage viavm_app_versionmetric or it can be obtained via passing-versionargument to VictoriaMetrics binary?Could you attach Prometheus and VictoriaMetrics graphs for
sum(irate(nginx_http_request_duration_seconds_bucket{kubernetes_namespace=~"prd",host!="", kubernetes_pod_name=~".*prd-app-59748c9bdc-25zq5"}[2m])) by (app,le)on the same time range?Try substituting
iratewithratein the query, sinceiratedoesn't play well in this case - https://medium.com/@valyala/why-irate-from-prometheus-doesnt-capture-spikes-45f9896d7832
 valyala
on 21 Aug 2019
valyala
on 21 Aug 2019
Thank you for the reply!
The VictoriaMetrics version is
v1.25.2-clusterand it is running on Kubernetes.
Prometheus version is v2.11.0.
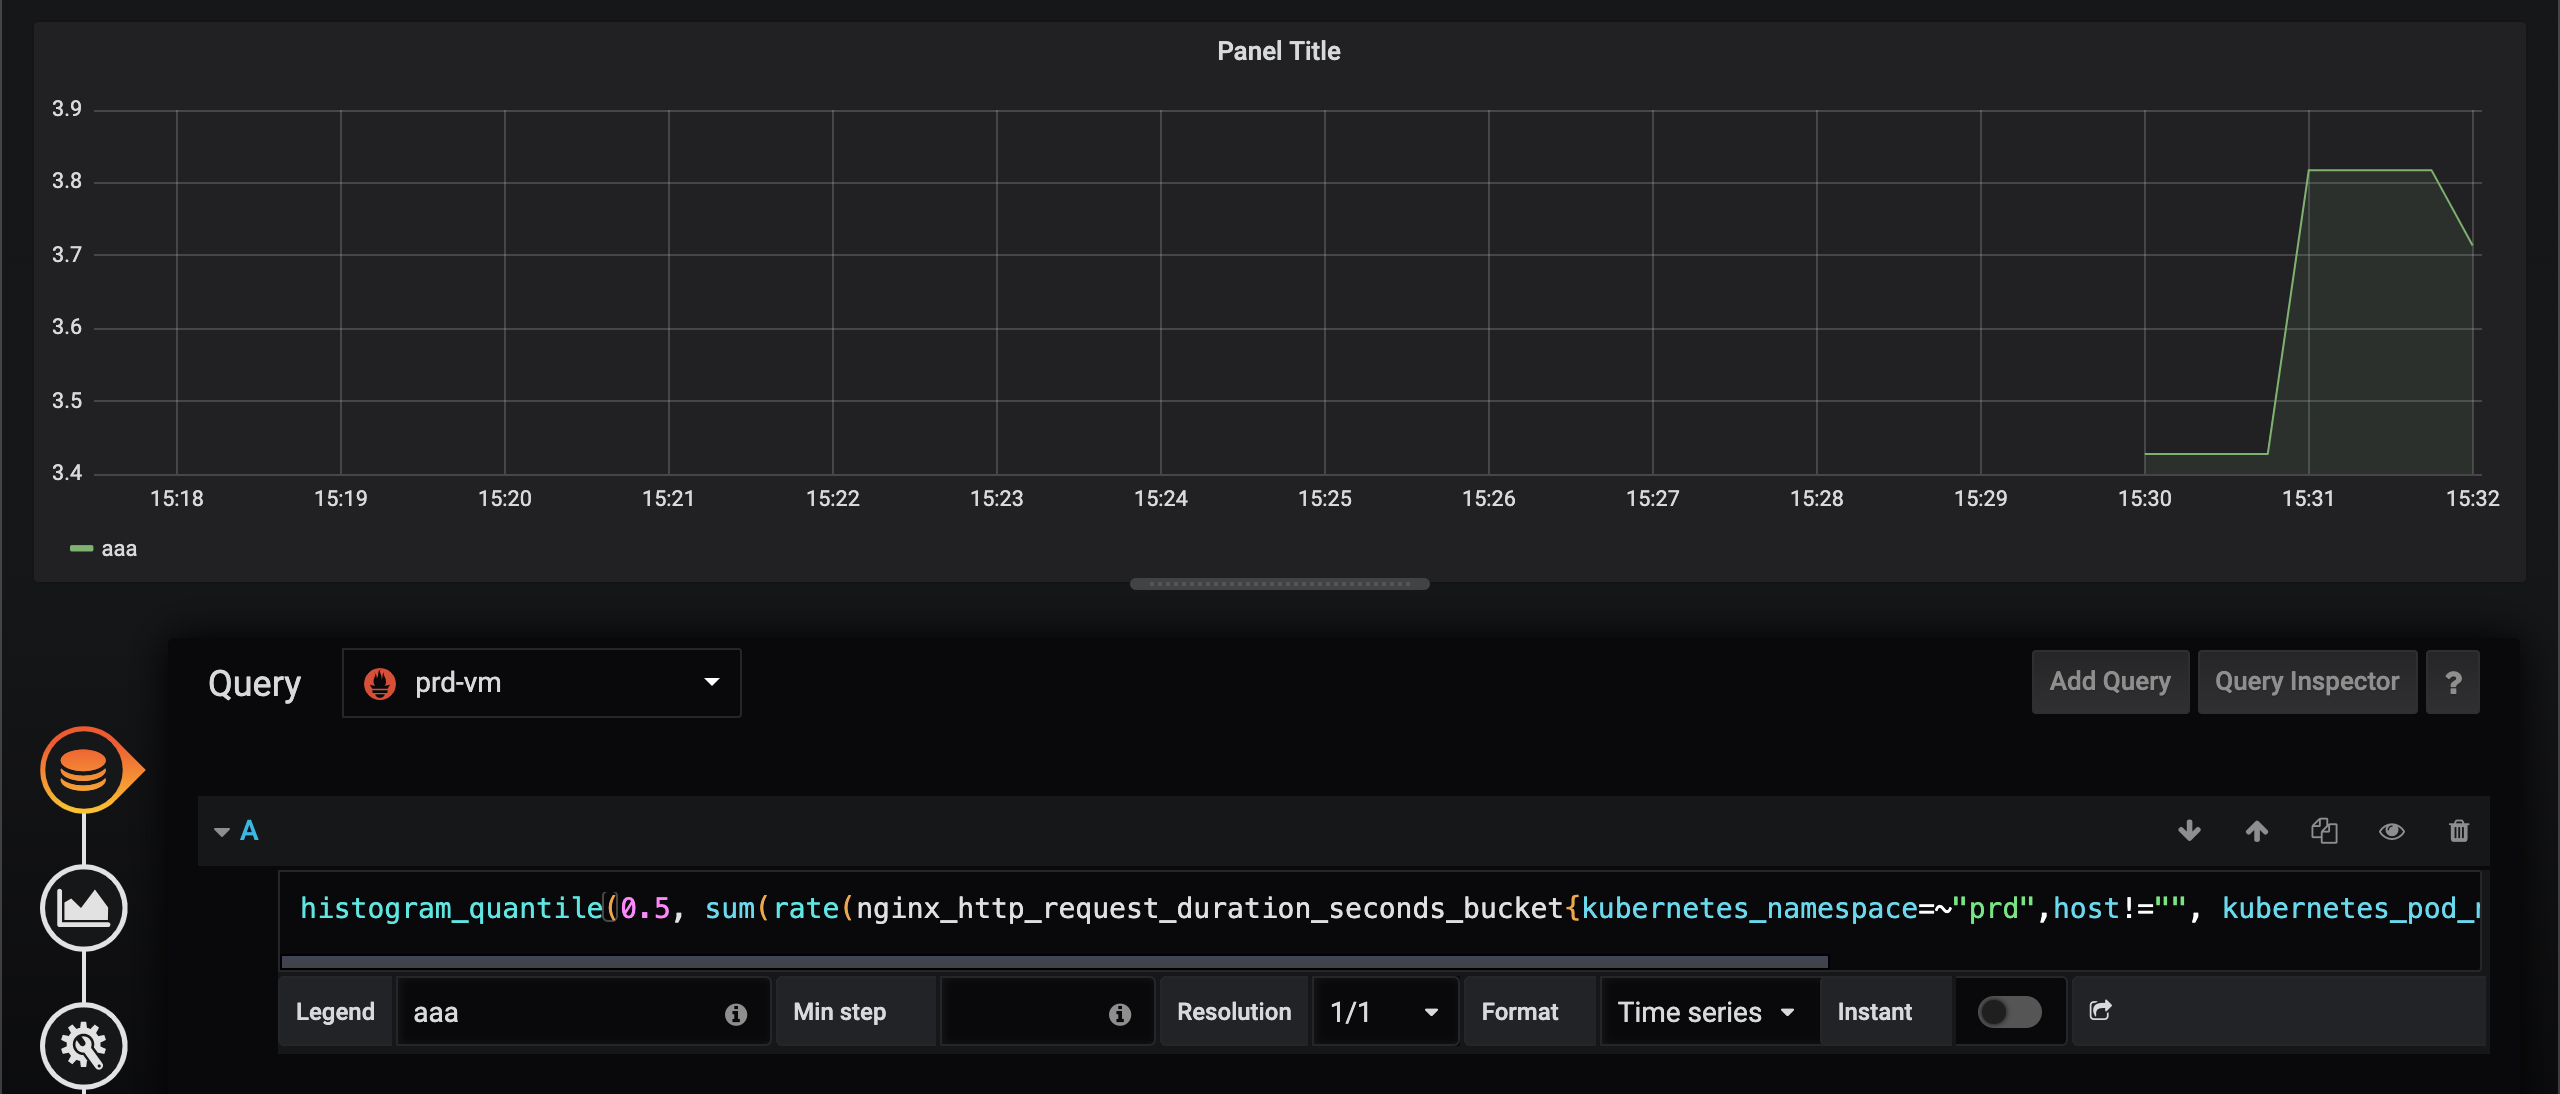
First Prometheus, second VictoriaMetrics.
I substituted irate with rate, but still some data are dropped from the graph.
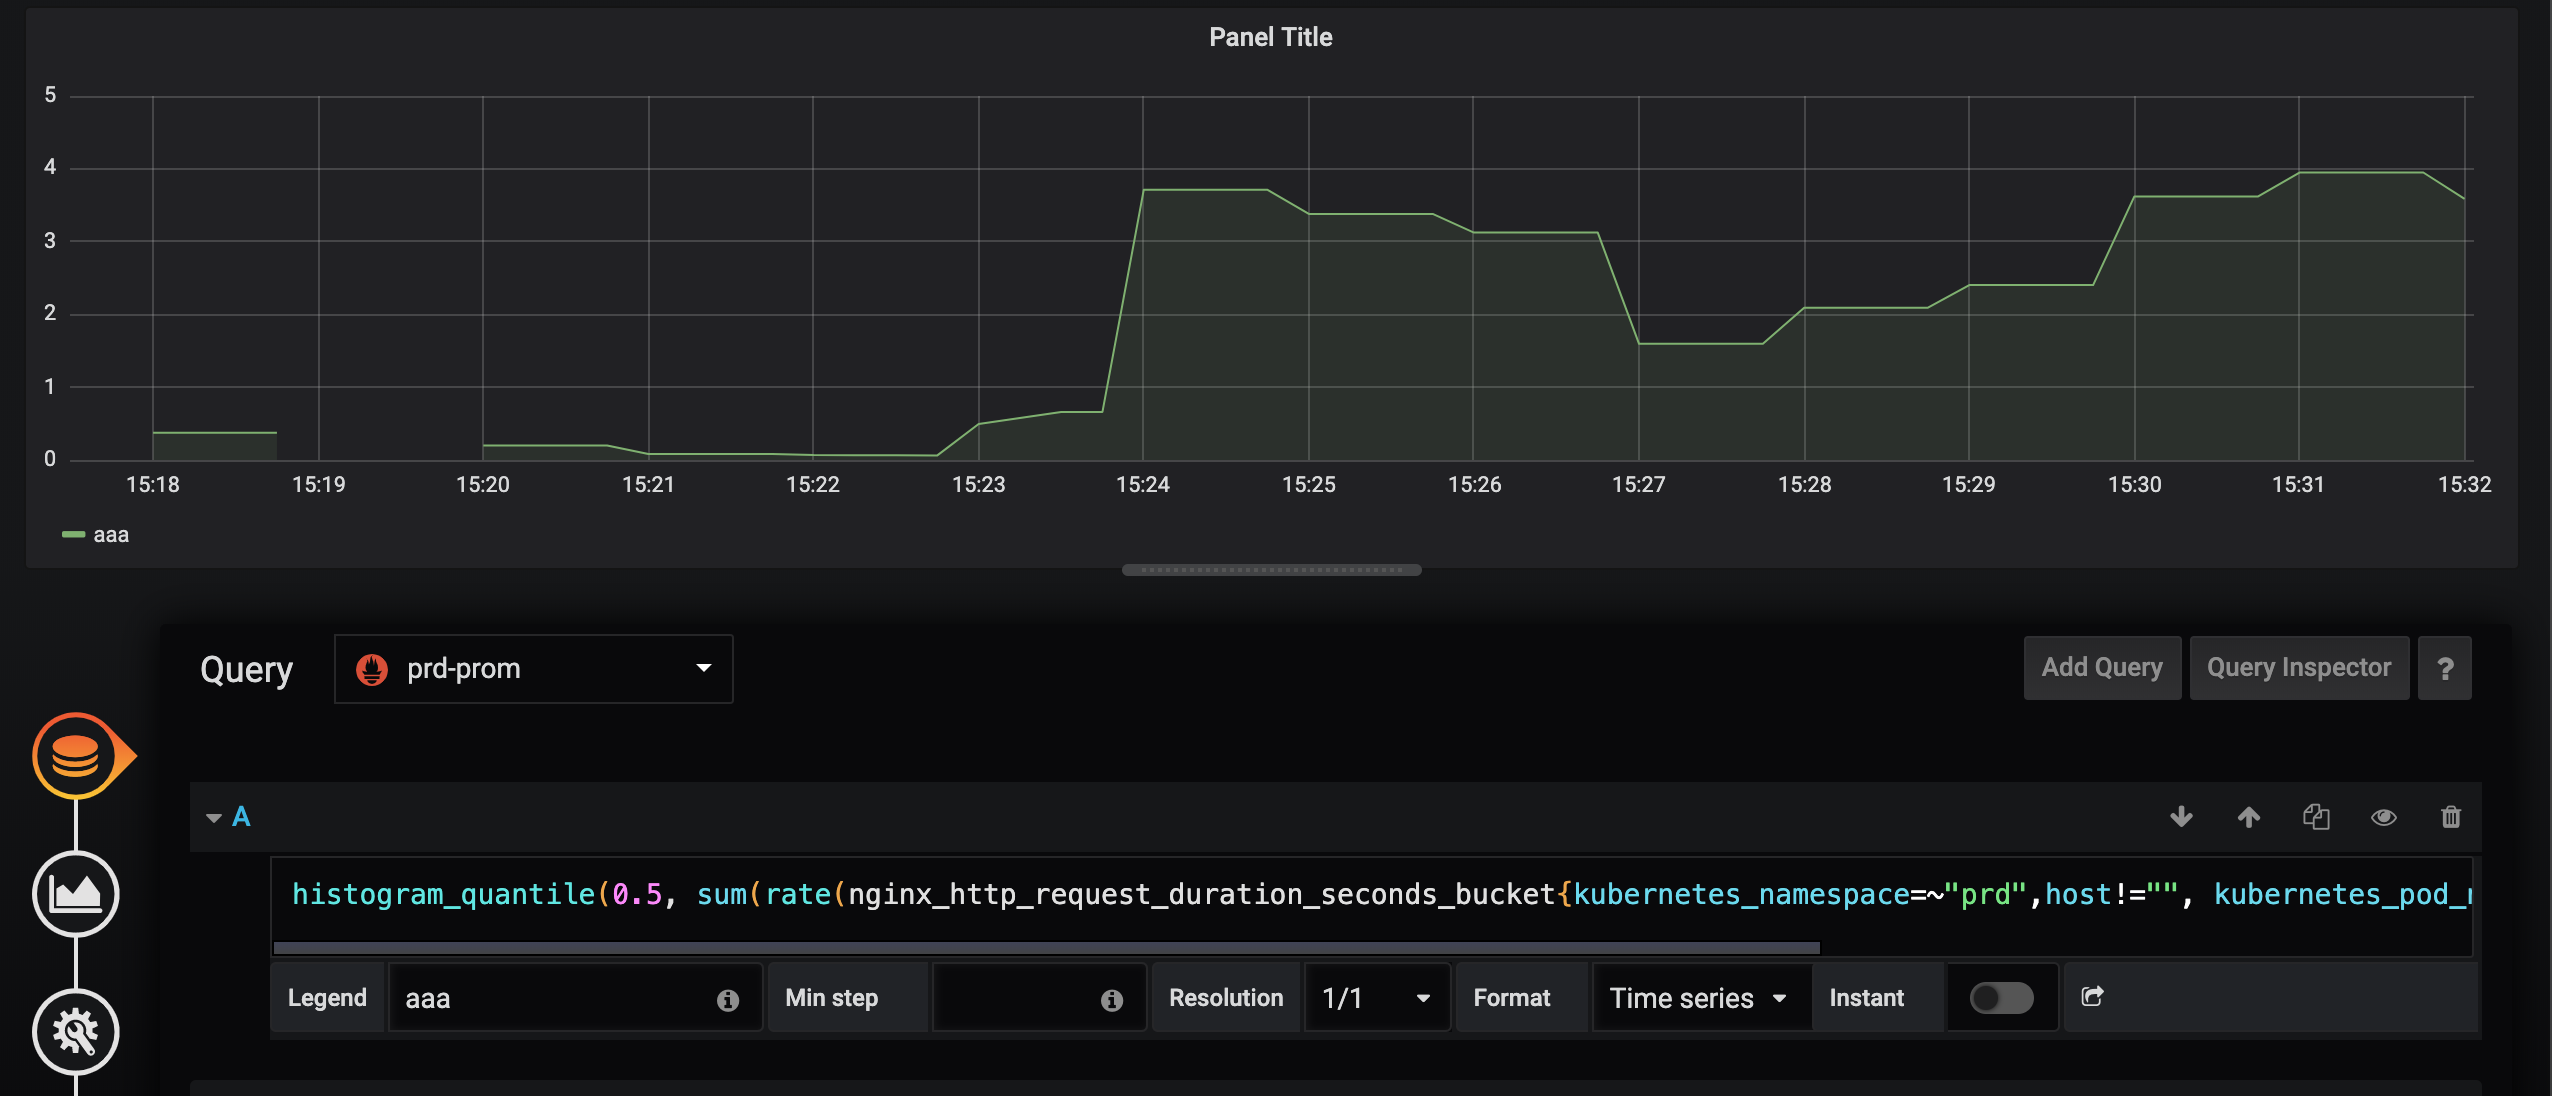
First Prometheus, second VictoriaMetrics.
The query is as follows.
histogram_quantile(0.5, histogram_quantile(0.5, sum(rate(nginx_http_request_duration_seconds_bucket{kubernetes_namespace=~"prd",host!="", kubernetes_pod_name=~".*prd-app-59748c9bdc-25zq5"}[2m])) by (app,le))
@ijij0516 , could you try building VictoriaMetrics from 1272e407b2f62dc4e7e15e3644b76c552eb6b16a (single-node version) or e9db22a551268cfbb2836946f7b756e66c35495e (cluster version) and verifying whether the issue is fixed?
valyala
on 22 Aug 2019
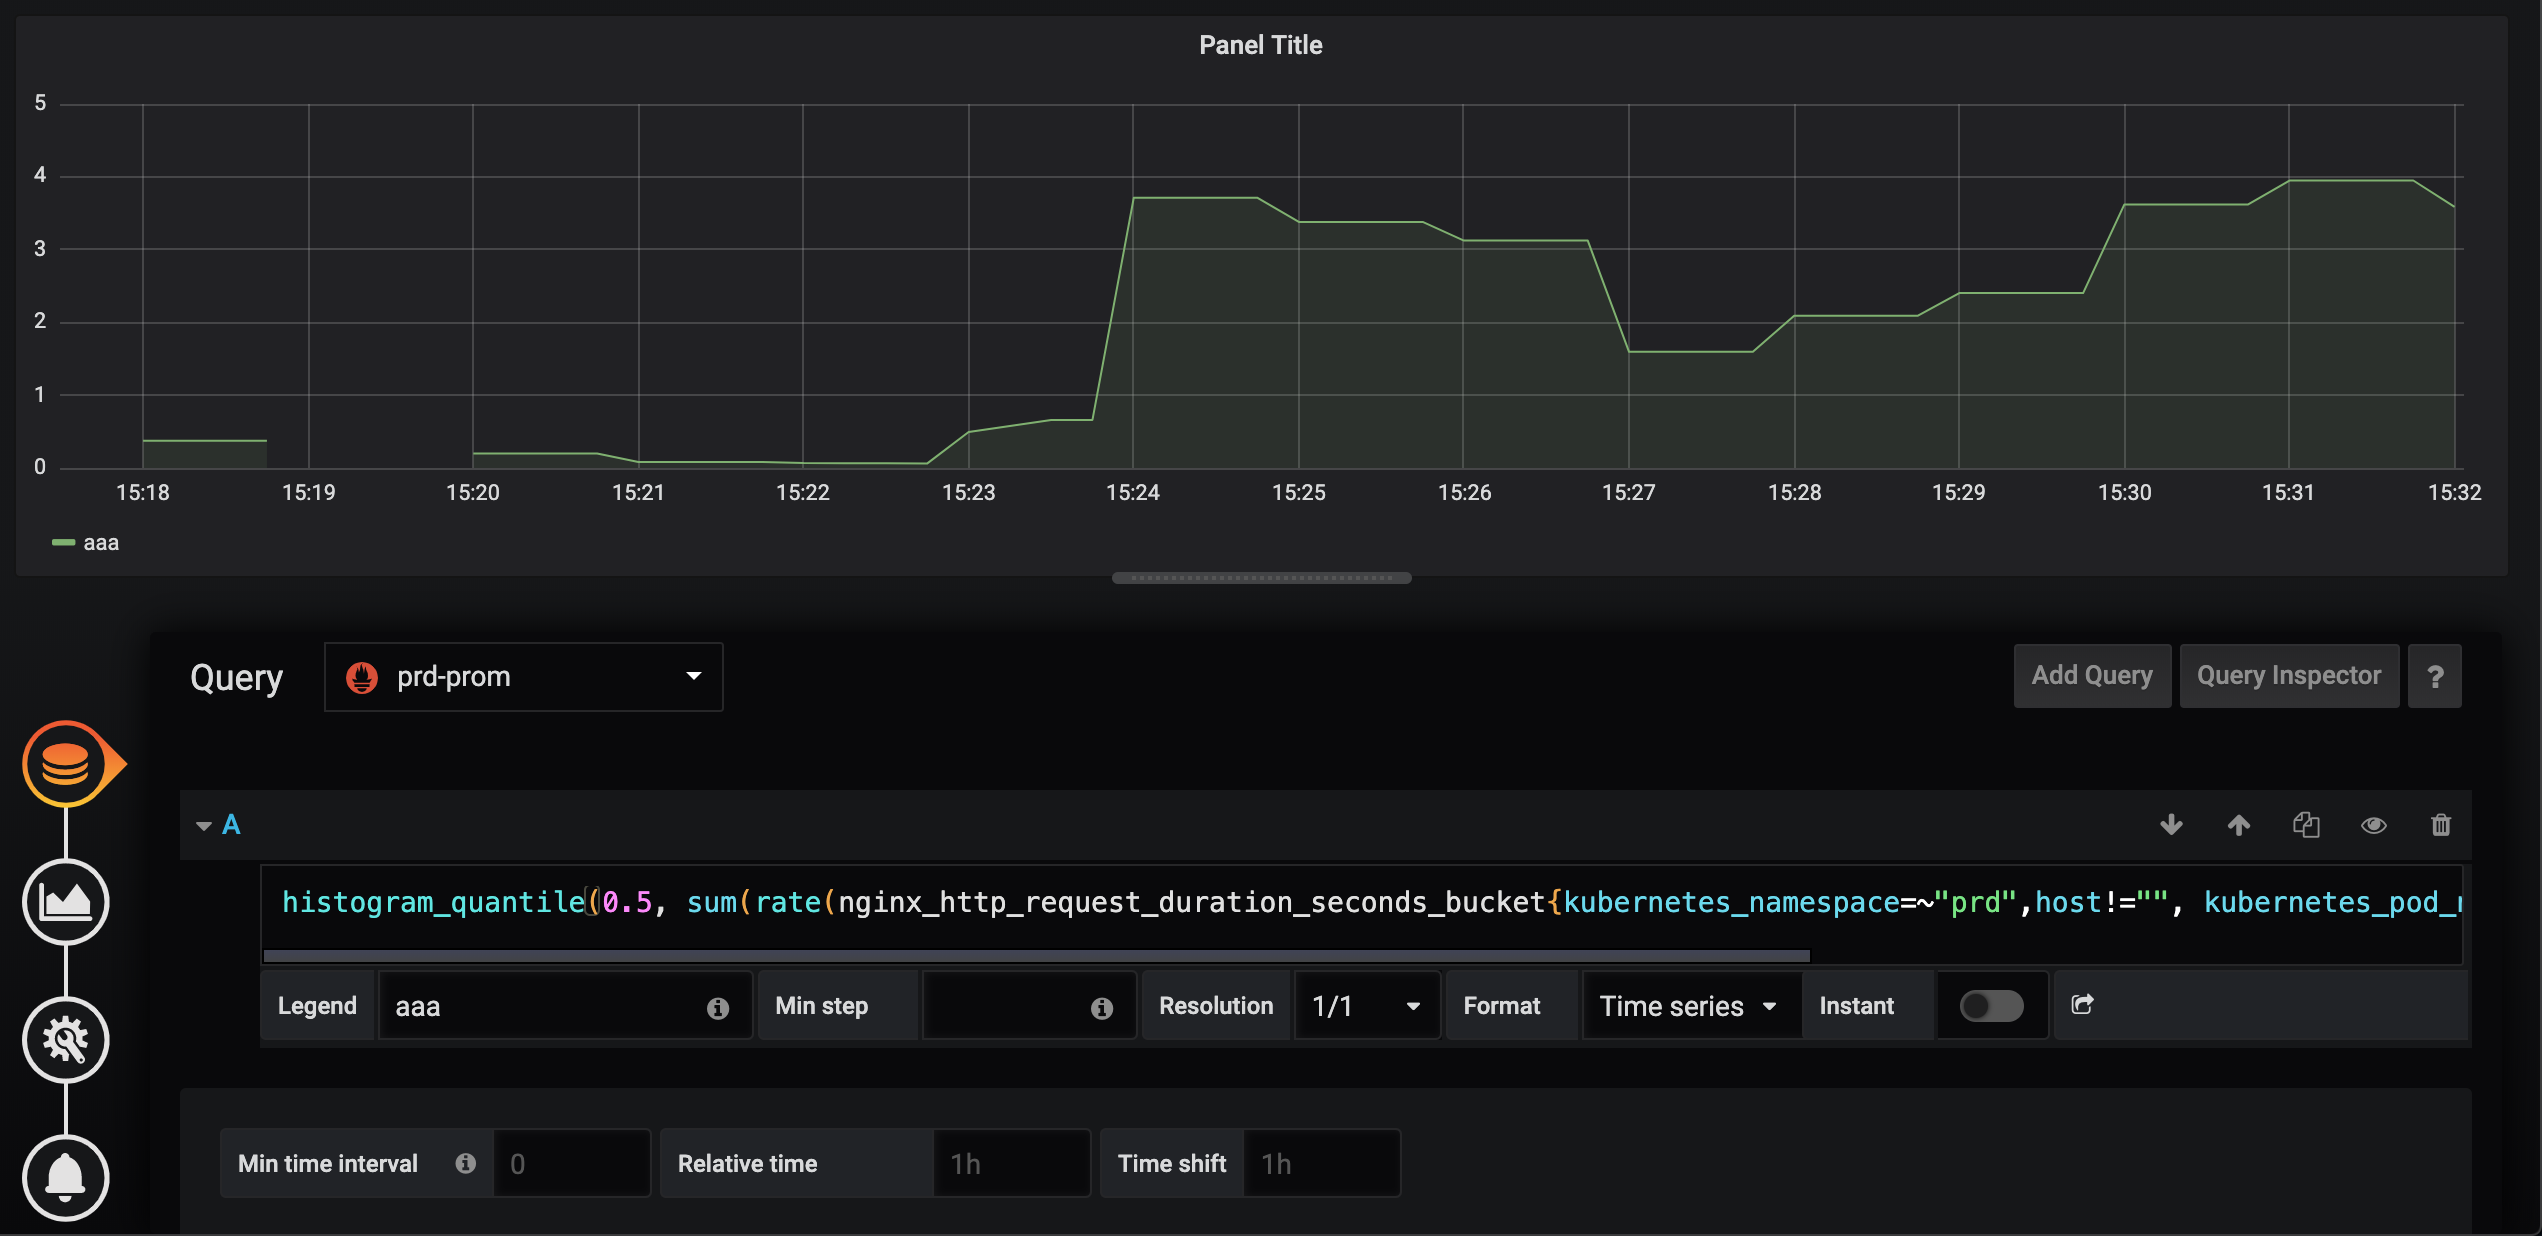
@ijij0516 , the bugfix is available in v1.26.0. Could you verify it there?
valyala
on 22 Aug 2019
@valyala I confirmed that the problem has been solved in v1.26.0. now.
Thank you!
Prometheus
VictoriaMetrics
InletOrder
on 23 Aug 2019
Related issues
 n4mine
·
3Comments
n4mine
·
3Comments
 isality
·
3Comments
isality
·
3Comments
 v98765
·
3Comments
v98765
·
3Comments
 0xBF
·
3Comments
0xBF
·
3Comments
 oOHenry
·
4Comments
oOHenry
·
4Comments