Vetur: High CPU usage from Vetur extension
Info
- Platform: macOS
- Vetur version: 0.12.1
- VS Code version: 1.23.1
Problem
CPU usage is excessively high from the "Code Helper" process. Grabbing the pid from running top and using ps aux | grep 1234, I can see the process is pointing to vetur extension.


I see someone else has reported something similar here: https://github.com/Microsoft/vscode/issues/49883
 emertechie
All 80 comments
Downgrading the vetur extension to v0.11.7 seems to fix the issue for me.
 erodri
on 15 May 2018
erodri
on 15 May 2018
@erodri How to downgrade extension?
 squalsoft
on 15 May 2018
squalsoft
on 15 May 2018
I have the same issue. It uses up to 200% CPU on my Mac OS X High Sierra 10.13.4.
Thanks for the great work btw!
@squalsoft You can go to the releases in the github project and donwload the vsix file. Then you can manually install it in the market place. See the instructions underneath.

But somehow v0.11.8 is also broken. @erodri Where did you get the v0.11.7 vsix file?
 prine
on 15 May 2018
prine
on 15 May 2018
This happened for me after both upgrading Vetur and taking the latest VSCode Insiders. I disabled the extension and reenabled it, seemed to kick it back into normal mode. Not sure if it's just a matter of time before it heats up again.
 cvharris
on 15 May 2018
cvharris
on 15 May 2018
Same issue for me. 😢
 jtr109
on 15 May 2018
jtr109
on 15 May 2018
@squalsoft @prine I used this tutorial to build the link for the previous vetur extension builds.
For example, the link to v0.11.7 is this: https://octref.gallery.vsassets.io/_apis/public/gallery/publisher/octref/extension/vetur/0.11.7/assetbyname/Microsoft.VisualStudio.Services.VSIXPackage
Save it with .vsix extension and install as explained in the tutorial (I just installed it over the current 0.12.1 version).
erodri
on 15 May 2018
i am not sure but i think its related to https://github.com/vuejs/vetur/issues/774 i think the watcher watches also whole node_modules folder or something like that
 cannap
on 15 May 2018
cannap
on 15 May 2018
Same issue here. I have downgraded to previous version (0.11.7 as @erodri suggested). And it became normal. Hope this issue will be solved asap.
 n0m4dz
on 15 May 2018
n0m4dz
on 15 May 2018
The suggestion from @erodri works for me.
By the way, don't forget to disable auto updating extension, otherwise the vetur will be updated to 0.12.1 again.
jtr109
on 16 May 2018
Same issue. After downgrade to 0.11.7 , cpu usage calm down.
 Deguang
on 16 May 2018
Deguang
on 16 May 2018
This is probably caused by chokidar file watcher.
Can any one give a reproduction code repo? It will be very helpful.
 HerringtonDarkholme
on 16 May 2018
HerringtonDarkholme
on 16 May 2018
I have this issue also.
 kwando
on 16 May 2018
kwando
on 16 May 2018
Installing 0.11.7 as suggested works for me too.
kwando
on 16 May 2018
 adrianthedev
on 16 May 2018
adrianthedev
on 16 May 2018
Having the same problem since today. @cvharris disable-enable solution did not work for me.
 iamanders
on 16 May 2018
iamanders
on 16 May 2018
I am having the same issue. If I type,
ps aux | grep 11480
pyaesone         11480 154.5  3.5  3413096 296540   ??  R     2:53PM   0:54.45 /Applications/Visual Studio Code.app/Contents/Frameworks/Code Helper.app/Contents/MacOS/Code Helper /Users/pyaesone/.vscode/extensions/octref.vetur-0.12.1/node_modules/vscode-languageclient/lib/utils/electronForkStart /Users/pyaesone/.vscode/extensions/octref.vetur-0.12.1/server/dist/vueServerMain.js --node-ipc --clientProcessId=11477
pyaesone         11844   0.0  0.0  2432804   1968 s002  S+    2:53PM   0:00.00 grep --color=auto --exclude-dir=.bzr --exclude-dir=CVS --exclude-dir=.git --exclude-dir=.hg --exclude-dir=.svn 11480
It is showing that CPU usage is over 150%
 mgmgpyaesonewin
on 16 May 2018
mgmgpyaesonewin
on 16 May 2018
Same issue for me.
another solution is plan instead of downgrade the extension ?
VS refuse to downgrade it because other extensions depends on it... :(
 sbstnplcn
on 16 May 2018
sbstnplcn
on 16 May 2018
Downgrade is only temporary, when VS reload or reopen, Vetur will update to latest automatically.
before downgrade, must set extensions.autoUpdate": true to false
 luozhihua
on 16 May 2018
luozhihua
on 16 May 2018
I cannot reproduce the problem in https://github.com/bailicangdu/vue2-elm
Can any one give me a GitHub repository where the problem appear.
Or your environment if you can reproduce the problem in https://github.com/bailicangdu/vue2-elm ?
HerringtonDarkholme
on 16 May 2018
The Problem has nothing to do with the code you are writing, but the latest releases of VSCode and Vetur...
Environment for me is:
MacOS 10.13.4
VSCode 1.23.1
Vetur 0.12.1
 DotCoyote
on 16 May 2018
DotCoyote
on 16 May 2018
@CinKon Please tell me your environment.

HerringtonDarkholme
on 16 May 2018
Same here !!! Cpu usage is going crazy since this release.
 ch-lukas
on 16 May 2018
ch-lukas
on 16 May 2018

DotCoyote
on 16 May 2018
Use VSCoe to open vue2-ele with the latest releases of vetur is fine..... but when i open any .vue file of our private project,cpu usage over 200% 😢。。
Deguang
on 16 May 2018

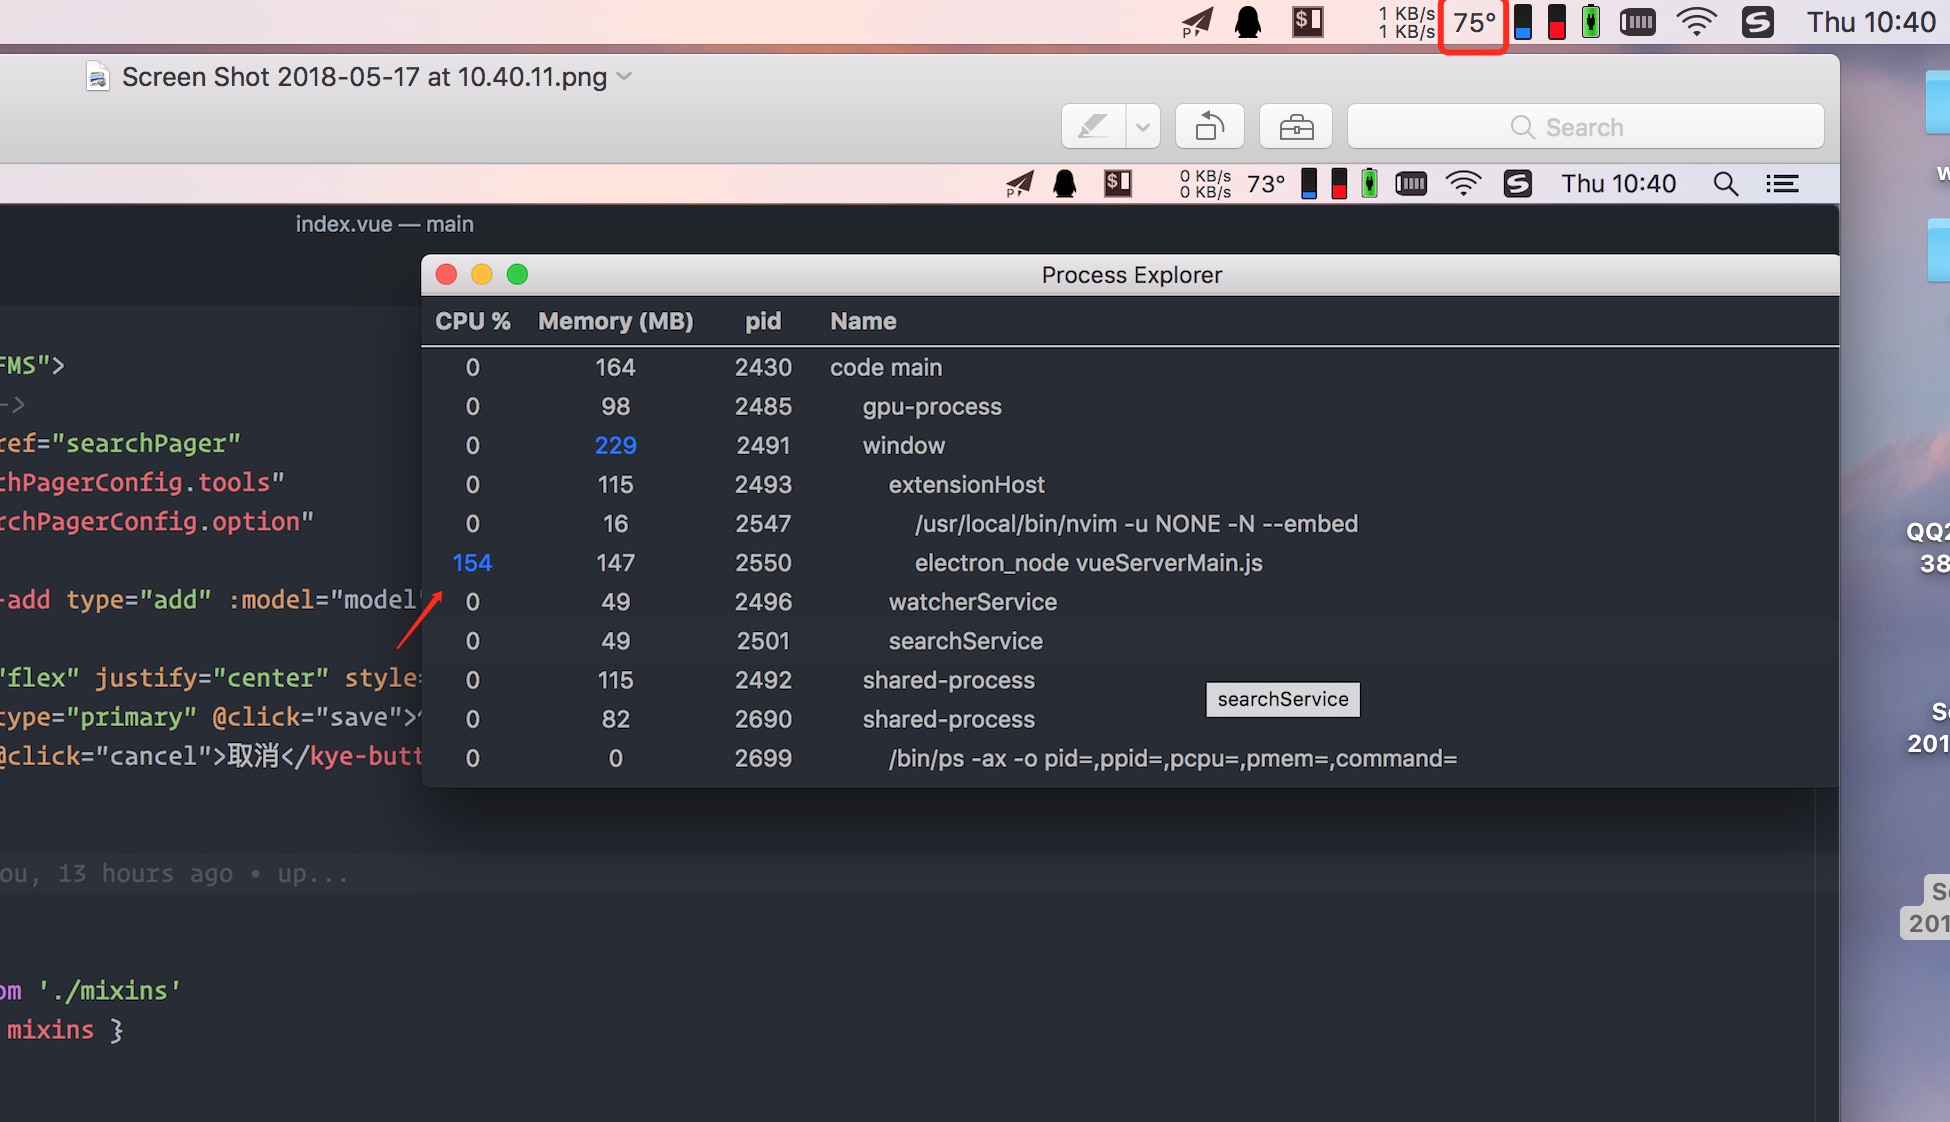
When open any *.vue files, cup usage of electron_node vueServerMain.js is over 140% quickly.

luozhihua
on 16 May 2018
@CinKon @luozhihua Can you reproduce the problem in https://github.com/bailicangdu/vue2-elm ?
HerringtonDarkholme
on 16 May 2018
Nope, with vue-elm everything is fine...
Then the problem might be some lint-modules or something else... All my Projects use ESLint and Prettier...
DotCoyote
on 16 May 2018
After installed dependencies of vue2-elm , reboot vscode ,open some .vue file

Deguang
on 16 May 2018
Thank @Deguang. But my CPU number is already after dependencies installed.
Would you like to give vetur a profile as documented here? https://github.com/Microsoft/vscode/wiki/Performance-Issues#profile-the-running-extensions
You can paste the result .cpuprofile file here so I can analyze it. Thanks!
HerringtonDarkholme
on 16 May 2018
On my side, it was between 150% and 200% this morning (SAST), so I disabled it and used another. I just switched back to test, and its averaging 50% now.
 mikerockett
on 16 May 2018
DotCoyote
on 16 May 2018
mikerockett
on 16 May 2018
DotCoyote
on 16 May 2018
@HerringtonDarkholme Is this what you want?
Deguang
on 16 May 2018
The vue-elm works well in my environment.
Maybe a problem in import depth in vue components?
The profile with my own repo below.
jtr109
on 16 May 2018
Sadly ordinary extension profiling method doesn't work with vetur.
LSP extension has separate process which isn't recorded in default profiling...
HerringtonDarkholme
on 16 May 2018
Same issue here.
macOS 10.13.5 + VSCode 1.23.1 + Vetur 0.12.1
 gonghao
on 16 May 2018
gonghao
on 16 May 2018
On my side, it was between 150% and 200% this morning (SAST), so I disabled it and used another. I just switched back to test, and its averaging 50% now.
I think that part of my problem was Node 10. I encountered a similar issue with a webpack-devserver project this morning, and reverting to Node 8 solved the problem. As such, I imagine it's why the above happened.
mikerockett
on 16 May 2018
I have downgraded node from 9.0.0 to 8.8.1, useless....
Deguang
on 16 May 2018
same issue here! Even after downgrading to 0.11.7 I get 400% CPU usage but then on Kernel instead of Code Helper.
 appinteractive
on 16 May 2018
appinteractive
on 16 May 2018
Same here...
Downgraded to 0.11.8 and still the same high CPU usage.
macOS 10.12.6
node 8.9.1
Code 1.23.1
 fucazu
on 16 May 2018
fucazu
on 16 May 2018
Profiling the true part of Vetur isn't easy. I will document the method here in hope that some one can help me to analyze the problem.
Vetur is powered by Vue language server, which is executed in a separate VS Code process so you cannot profile it by VSCode's builtin profiler.
Instead, you have to download and compile vetur yourself. Instruction is here https://github.com/vuejs/vetur/blob/master/docs/CONTRIBUTING.md#code-dev-guide.
After that, you can click the debugger icon in VS Code's left sidebar. Choose debug client. And then a new VS Code window will spawn, open a vue project there.
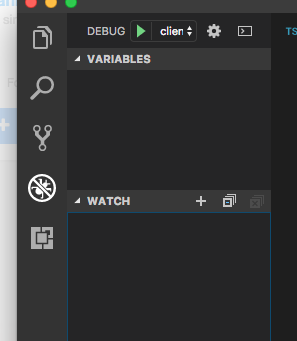
Then open output panel, (press ctrl-p and search "toggle output"). Choose Vue Language server. You can see a debug URL in output.
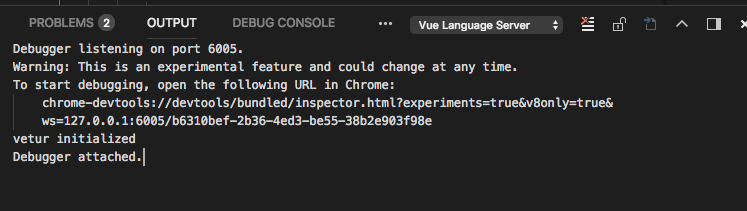
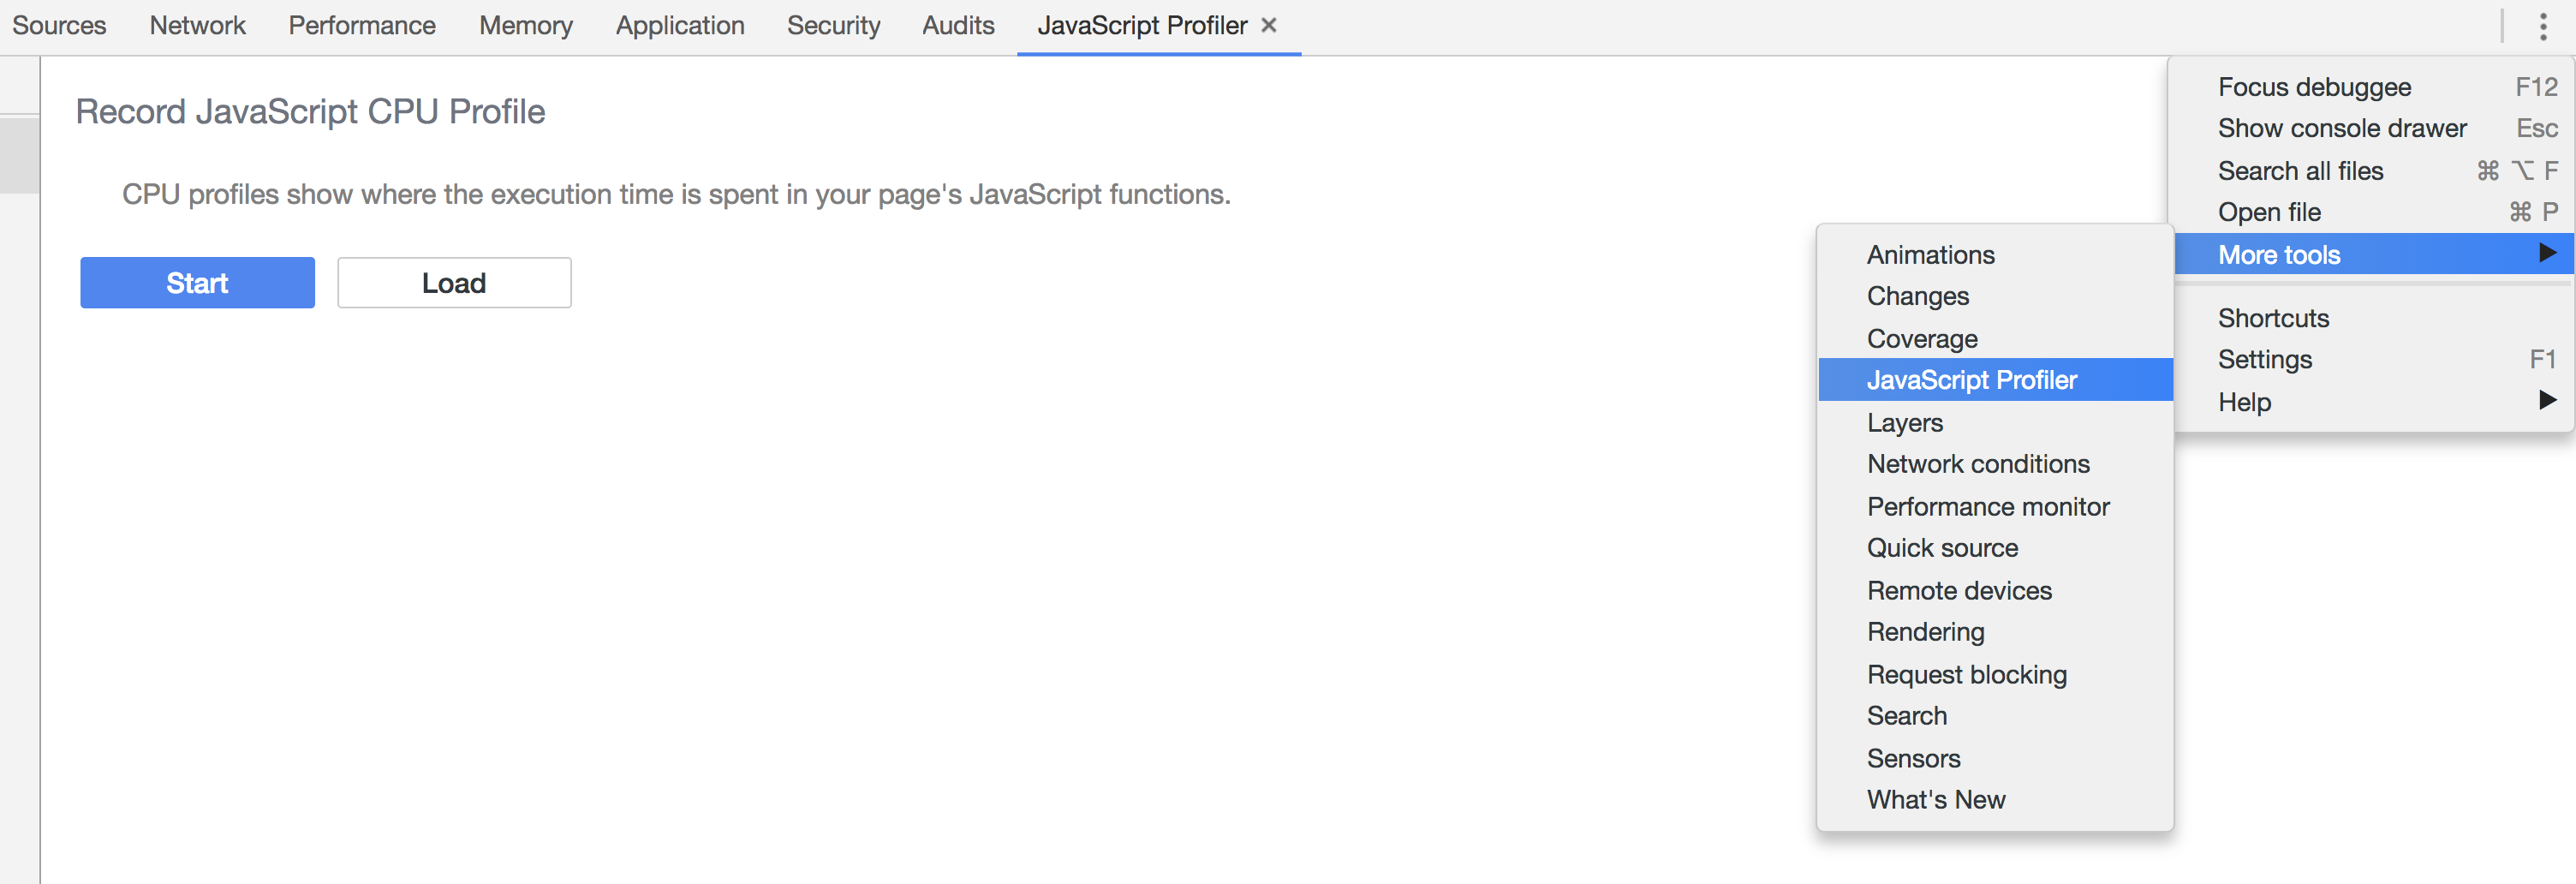
Paste it to chrome and open javascript profiler there. If you cannot see it click the setting button in chrome dev tool and switch on javascript profiler in the more tools menu. Then click start button. Edit your vue project and then end the profiler recording. You can export the profiling and upload it here.
HerringtonDarkholme
on 17 May 2018
Same here...
That makes me crazy...
Have to switch Sublime Text
macOS 10.12.6
Vetur 0.12.1
Vscode 1.23.1
 cycold
on 17 May 2018
cycold
on 17 May 2018
Please make real profiling instead of complaining.
Complaining on Github issue won't help us to solve the problem. If you can provide a repository that reproduces the problem, or you can send me a profiling mentioned above, it will be more beneficial for us to spot the performance pitfall.
HerringtonDarkholme
on 17 May 2018
@cycold
Have a try on the temporary solution above if you do not trend to help.
The issue will be solved sooner or later.
jtr109
on 17 May 2018
This is my front repository which have issue when i open .vue files.
GuardPortal.WebFront.zip
squalsoft
on 17 May 2018
There are a few cases where I can reliably repro this. The file watcher is listening into node_modules despite the ignore patterns. Part of the issue is the repeated patterns of node_modules of different form on chokidar causing problems for it, other issue is we didn't handle the ignore path on Windows correctly.
I have pushed 0.12.2 which temporarily disables this file watcher. So you might be hitting #355 but otherwise all other features should work fine. I'll fix #355 in another way.
@HerringtonDarkholme I'm looking into using VS Code's own file watcher like this (in vueMain.ts)
  const clientOptions: LanguageClientOptions = {
    documentSelector,
    synchronize: {
      // the settings to synchronize
      configurationSection: ['vetur', 'emmet', 'html', 'javascript', 'typescript', 'prettier', 'stylusSupremacy'],
      // file events that go to `connection.onDidChangeWatchedFiles`
      fileEvents: vscode.workspace.createFileSystemWatcher('{**/*.js,**/*.ts}')
    },
    initializationOptions: {
      config
    },
    revealOutputChannelOn: RevealOutputChannelOn.Never
  };
VS Code has a complex solution to file watching (C# + nsfw + chokidar) to expose a consistent file-watching API, so I'd prefer using it. This does mean people consuming VLS need to do their own file-watching on ts/js files, but then the responsibility of managing the overhead of file-watching is on them, not us. (If we do find a cross-platform file-watcher that works reasonably well I don't mind adding it back to VLS).
Another motivation for this is now VLS is still tightly coupled with FS access. I'm working on extracting all FS access into using a FileSystemProvider so Vetur can be used on remote file systems or in browser using a virtual FS.
I'm planning to do some refactoring of ServiceHost so it can be accessed by all modes and VLS interface. It'll do file management for all files (vue/js/ts/css/scss/less).
 octref
on 17 May 2018
octref
on 17 May 2018
For others, in simple words, issue should be fixed in 0.12.2. Let me know if it isn't.
You might hit #355, but at least you can use other functionalities fine. #355 will be fixed soon too.
octref
on 17 May 2018
Let's just stick to VS Code's watcher.
I don't think, or at least not have observed, any actual users who use VLS alone.
HerringtonDarkholme
on 17 May 2018
@octref Can you give me your reproduction code? I wonder why chokidar fails, at least why fails on MacOS.
HerringtonDarkholme
on 17 May 2018
@octref Unfortunately 0.12.2 hasn't fixed it for me. Still getting high cpu usage from Vetur.
 gkdp
on 17 May 2018
gkdp
on 17 May 2018
@octref still exists...
Deguang
on 17 May 2018
Same for me, upgrading to 0.12.2 boosts VSCode CPU use. Reverted to 0.11.7 again.
erodri
on 17 May 2018
Yep, 0.12.2 didn't work here either.
 gonzaloserrano
on 17 May 2018
gonzaloserrano
on 17 May 2018
I had to downgrade to 0.11.7 to stop increasing CPU consumption.
 wistcc
on 17 May 2018
wistcc
on 17 May 2018
Same for me on MacOS Sierra 10.13.4 + Vetur 0.12.2 = high CPU consumption.
 ricardovegamx
on 17 May 2018
ricardovegamx
on 17 May 2018
I had this as well when I installed 0.12.1 directly from github (before it was updated in VS Code extensions). Love the fact that it fixes the Go to definition feature. Hate to see it causing this problem.
 BasitAli
on 17 May 2018
BasitAli
on 17 May 2018
Didn't handle chokidar correctly in 0.12.2. 0.12.3 completely removes chokidar so the problem should be gone. If not, then that's not the file watcher causing the problem.
Would appreciate it if you can confirm 0.12.3 is working for you.
octref
on 17 May 2018
@octref Fixed~! Thanks for your working~

Deguang
on 17 May 2018
Worked for me also with 0.12.3.
 faisalraja
on 17 May 2018
faisalraja
on 17 May 2018
Yeah that seems to have done it. 👍
mikerockett
on 17 May 2018
Yep, 0.12.3 seems to fix the high CPU usage, thanks!
erodri
on 18 May 2018
Yeah, looks like it's fixed with 0.12.3 👌
Thanks a lot for the fix and keep up the good work!
prine
on 18 May 2018
Yeah! It's ok. 0.12.3 Fixes this issue.
squalsoft
on 18 May 2018
Yay, what a relief!!! Thx.
mgmgpyaesonewin
on 18 May 2018
0.12.5 still has high CPU Usage :-1:
 LuisHCK
on 30 Jul 2018
LuisHCK
on 30 Jul 2018
@LuisHCK Would be helpful if you can provide the sample project you are working on, and info such as system spec, OS, node version etc.
octref
on 1 Aug 2018
@octref my CPU went full load while working under this condition:
Node: 8.11.3
VSCode: 1.25.1
Vetur: 0.12.6
MacOSX: 10.13.6(High Sierra)
Happened while working on vue-cli v3.0.0 rc3 project, when I changed the current date of MacOSX to 3~4 days earlier than the real date, in order to test user date related problems. VSCode helper took up most of the load but not really sure if it's due to Vetur or other extensions.
 rabelais88
on 13 Aug 2018
rabelais88
on 13 Aug 2018
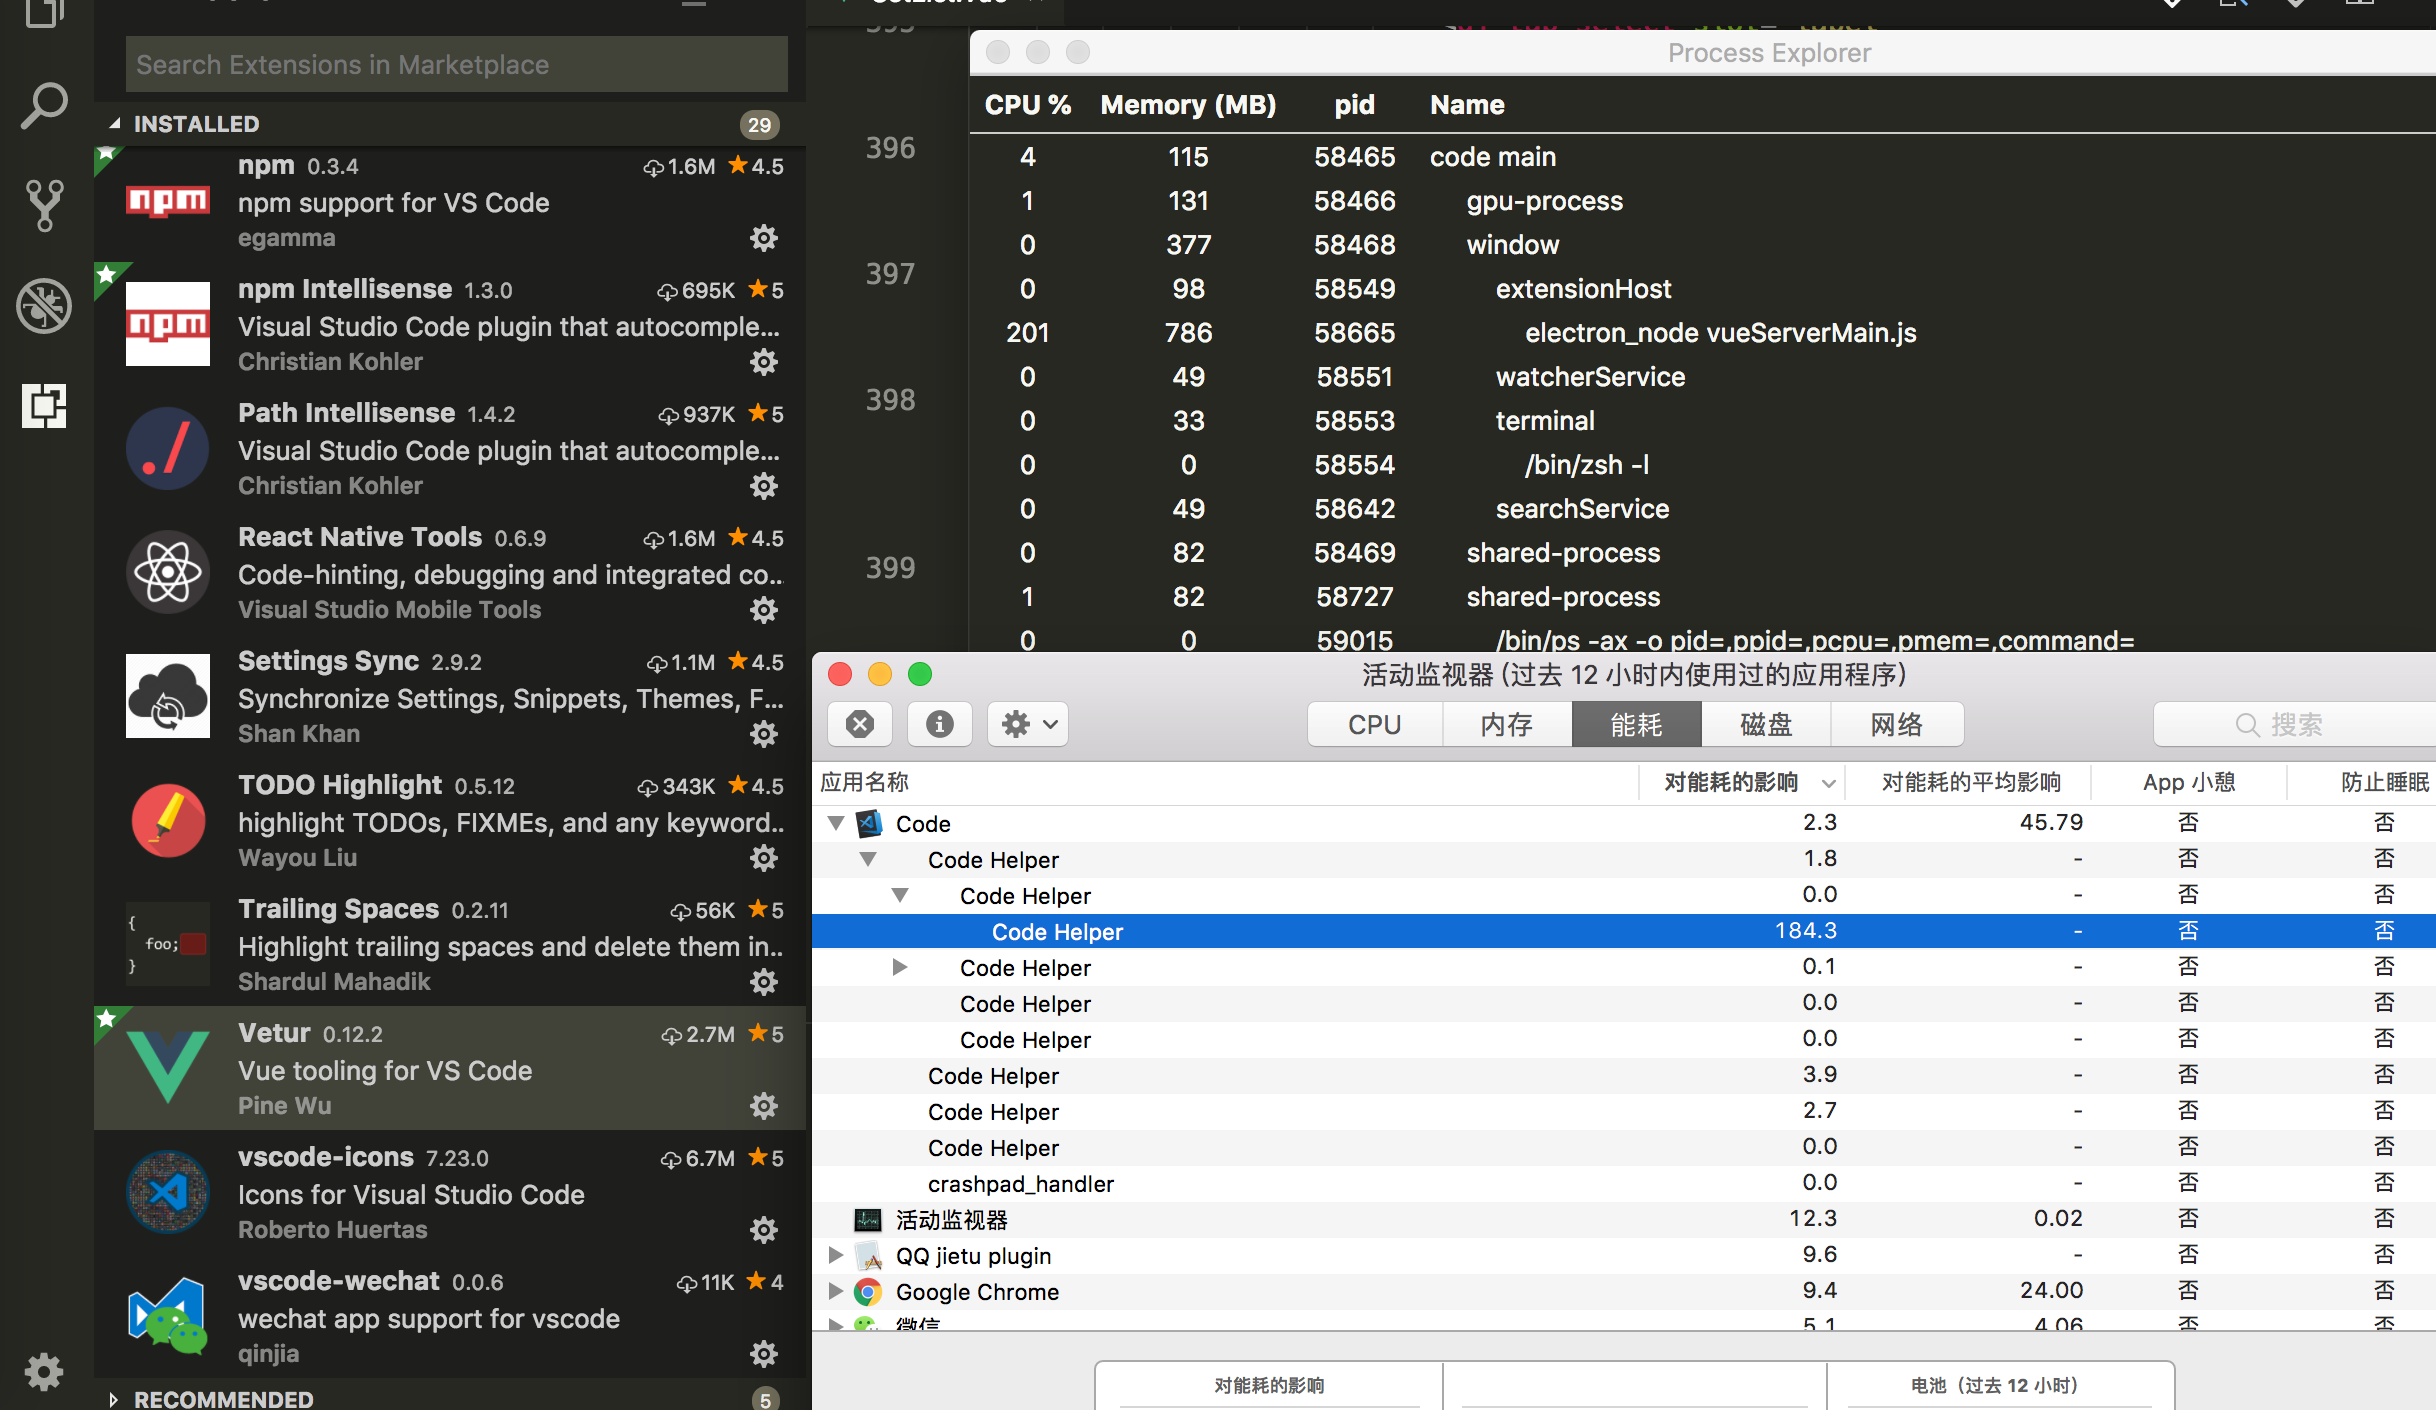
@rabelais88 Try Help -> Process Explorer, and see if Vetur is the issue:

octref
on 13 Aug 2018
@octref it appears that problem has unfortunately returned.
Code version: 1.28.2
Vetur version: 0.13.0

 patzick
on 3 Nov 2018
patzick
on 3 Nov 2018
@patzick Please open a new issue. Also, is it possible for me to get a repro case? Can you modify https://github.com/octref/veturpack to repro the issue?
Also how large is your project?
octref
on 21 Nov 2018
@octref problem has disappeared after two days, i don't know why but it's okey now. Thank you, vetur is great! :)
patzick
on 21 Nov 2018
I am having same problem, Code Helper running 100% using
ps aux | grep <Code Helper PID>
I get the following:
Helper.app/Contents/MacOS/Code Helper /Users/Name/.vscode/extensions/octref.vetur-0.14.2/server/dist/vueServerMain.js --node-ipc --clientProcessId=16278
vetur version 0.14.2
 CaptainMack
on 29 Nov 2018
CaptainMack
on 29 Nov 2018
same here vetur 0.14.5
 MatanYadaev
on 17 Jan 2019
MatanYadaev
on 17 Jan 2019
Not sure if this is the same bug or a different one as this Issue is mostly affecting OSX users.
After having VS-Code running for 1-2 Days, the reaction time as i type gets pretty bad. Sometimes it takes 1-2 seconds till the pressed character appears in VS-Code.
I noticed high CPU usage of Vetur as i type, mostly peaking at 90% CPU.
After restarting VS-Code, the Problem is fixed. Maybe it's a MemoryLeak, also wondering why vs-code's bootstrap-fork process is having 190G of virtual memory...

 marvinside
on 9 Feb 2019
marvinside
on 9 Feb 2019
@marvinside That's actually a problem of VS Code, not Vetur. I created an issue on VS Code side: https://github.com/Microsoft/vscode/issues/68322. It would be great if you can follow up with some more details so we can fix it. Thanks!
octref
on 9 Feb 2019
@octref I'm not sure if this is the problem, as the bootstrap-fork process has not gotten any CPU usage while VS-Code slows down.
marvinside
on 11 Feb 2019
VSCode is literally unusable for Vue project in macOS because of this bug.
 vividvilla
on 22 May 2019
vividvilla
on 22 May 2019
@vividvilla Create new issue following https://github.com/vuejs/vetur/blob/master/.github/PERF_ISSUE.md.
octref
on 23 May 2019
@octref Just a stab in the dark:
Could this be related to the problems which precipitated ForkTsCheckerWebpackPlugin? Obviously _this_ issue is unrelated to webpack, but we ended up switching to the fork-ts-checker-webpack-plugin a while ago because our builds were taking > 15 minutes and it reduced them to < 4 minutes. IIRC it was because the type checking service was being restarted for each SFC that the Vue template compiler consumed, and had to walk the import tree separately for _every single SFC_ and wasn't caching the hits between runs, so it had to hit the filesystem repeatedly for module resolutions.
I don't know the specifics or internals of VSCode's file watching service, or of Vetur itself, but as the project gained more files (especially more entry points/"close to root level" components) the compilation time (and type checking) took longer and longer because the compilation of the SFCs were spawning a huge redundancy in file reads. That seems to also be the case (in my experience) with this Vetur issue, as it doesn't have nearly the same slowdown in a small project as it does in a moderately larger project.
Could it be the same root cause? And would a similar strategy (forking the type checking service or other module-resolving services into their own thread/process so they can take advantage of caching between runs) possibly mitigate the issue?
 kjleitz
on 2 Aug 2019
kjleitz
on 2 Aug 2019
@kjleitz You are correct the module resolution is not cached and optimized. I opened https://github.com/vuejs/vetur/issues/1286 to work on it but didn't finish before I went to vacation. I'll get back to it.
octref
on 7 Aug 2019
@octref 😍 👍
kjleitz
on 8 Aug 2019
Related issues
 LukeLin
·
3Comments
LukeLin
·
3Comments
 shaunc
·
3Comments
shaunc
·
3Comments
 tczhangzhi
·
3Comments
tczhangzhi
·
3Comments
 KokoDoko
·
3Comments
KokoDoko
·
3Comments
 LawrenceQxy
·
3Comments
LawrenceQxy
·
3Comments
Most helpful comment
Didn't handle chokidar correctly in 0.12.2. 0.12.3 completely removes chokidar so the problem should be gone. If not, then that's not the file watcher causing the problem.
Would appreciate it if you can confirm 0.12.3 is working for you.