Vetur: Vetur Intellisense speed compare with .js file and .vue file
Info
- Platform: Win 10
- Vetur version: 0.11.7
- VS Code version: 1.23.0
Problem
new install vscode, Extensions Folder is Empty && new install Vetur,
.js file - so fast

.vue file - so slow

I can't find any solution for this problem
This directly led to me not willing to write vue code in vscode
Reproducible Case
 lizy0329
All 60 comments
Thanks for reporting.
You can also do some profiling according to https://github.com/Microsoft/vscode/wiki/Performance-Issues
Your report will be very helpful!
 HerringtonDarkholme
on 11 May 2018
HerringtonDarkholme
on 11 May 2018
Can you try this?
- Set
vetur.trace.server: "verbose" - Do a few completions
- Open
Vue Language Serveroutput channel and save everything there into a log file and attach to this issue - Create a repo where we can reproduce this issue
Thanks!
 octref
on 10 Aug 2018
octref
on 10 Aug 2018
Same issue here. IntelliSense is slow, autocompletion for variables/funcs/etc, and the "format code" command won't work right away. I can even see the red underlines appear and disappear slowly as ESLint catches up with what I'm typing.
I'll try the steps above tomorrow and report back.
 ffxsam
on 19 Sep 2018
ffxsam
on 19 Sep 2018
@octref Warning: ginormous file ahead:
This was a log of me typing out console.log(this.loading) but partially typing this.loa waiting for the autocomplete. I intentionally put weird line breaks so I could trigger Prettier, which also has a delay before it executes.
I can't give a repo, as this is a proprietary commercial project.
ffxsam
on 19 Sep 2018
I met the same issue
OS:win10
VSCode:1.27.2
Vetur:0.12.6
 parox2014
on 20 Sep 2018
parox2014
on 20 Sep 2018
That's a great example. I get that huge delay a lot, too. macOS 10.13.6.
ffxsam
on 20 Sep 2018
Having the same issue. Every typed symbol takes about 10 seconds to update IntelliSense. Here's my VLS log. I only typed 't' inside the component's method.
- Platform: macOS High SIerra (same issue on Mojave 10.14 (18A391))
- Vetur version: 0.12.7
- VS Code version: 1.27.2
UPD: It's reproducing with TS 3.0+ on VLS. When I manually installed Typescript 2.9.2 on the language server, it started working as expected.
 alwonder
on 26 Sep 2018
alwonder
on 26 Sep 2018
What's the latest on this? Here's another example:

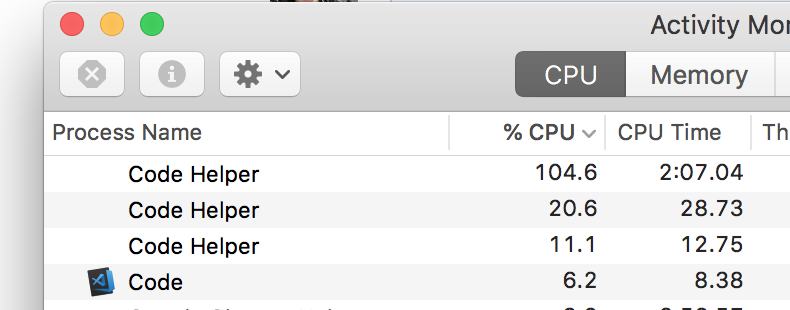
When I mouse over symbols, it says "Loading..." for an extraordinarily long time. During this time (whatever Vetur is doing), I'm unable to format the document via Prettier.
I did notice high CPU usage during this long delay:
ffxsam
on 12 Oct 2018
Sorry to jump on this issue but I appear to be getting the same problem. Image below shows slow responsiveness, I have attached the logs and provided my tsconfig.

{
  "compilerOptions": {
    "target": "es6",
    "module": "esnext",
    "strict": true,
    "jsx": "preserve",
    "moduleResolution": "node",
    "experimentalDecorators": true,
    "emitDecoratorMetadata": true,
    "allowSyntheticDefaultImports": true,
    "sourceMap": true,
    "baseUrl": ".",
    "noImplicitAny": false,
    "types": [
      "node",
      "mocha",
      "chai",
      "cypress"
    ],
    "paths": {
      "@/*": [
        "src/*"
      ]
    }
  },
  "include": [
    "src/**/*.ts",
    "src/**/*.vue",
    "tests/**/*.ts"
  ],
  "exclude": [
    "node_modules"
  ]
}
 cmcnicholas
on 24 Oct 2018
cmcnicholas
on 24 Oct 2018
These issues take time to repro and fix. If some version of Vetur works for you, you can revert & lock to that version for now: https://github.com/vuejs/vetur/blob/master/docs/FAQ.md.
octref
on 29 Oct 2018
I have the same issue when inside .vue files. I resorted to moving out the script into a separate .ts file and then the completion and error reporting is instant.
 bobmoff
on 6 Dec 2018
bobmoff
on 6 Dec 2018
These issues take time to repro and fix.
Understandable. I just would like to know if there is any work currently related to fixing this issue, or is it still just an issue?
 kamerat
on 8 Mar 2019
kamerat
on 8 Mar 2019
Can you try if this repros in latest version of TS?
yarn add -D [email protected]in workspace"vetur.useWorkspaceDependencies": true
octref
on 22 Mar 2019
Can you try if this repros in latest version of TS?
This had no impact for me. Still as slow as before.
kamerat
on 22 Mar 2019
this is a hugh issue, it gets worse with each TS/Vetur version.
TS: 3.4.1 (Workspace version)
Vetur: 0.18.0
VSC:
Version: 1.32.3 (system setup)
Commit: a3db5be9b5c6ba46bb7555ec5d60178ecc2eaae4
Date: 2019-03-14T23:43:35.476Z
Electron: 3.1.6
Chrome: 66.0.3359.181
Node.js: 10.2.0
V8: 6.6.346.32
OS: Windows_NT x64 10.0.17134
 backbone87
on 5 Apr 2019
backbone87
on 5 Apr 2019
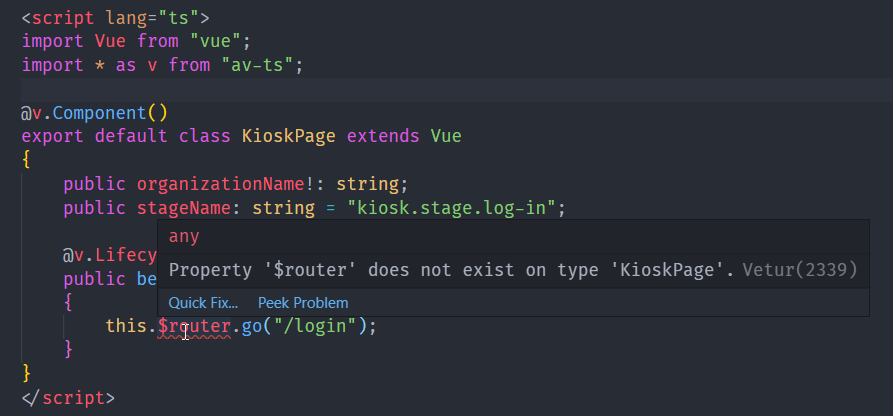
I am also experiencing this issue, and in addition to Vetur's completion being very slow inside of TypeScript blocks in .vue files, I am also getting incomplete resolution. For example, the $router property on my Vue instances is missing, even though I have vue-router installed and it resolves properly in plain TypeScript files.
In a .vue file:
In a .ts file:
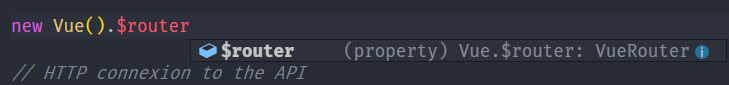
The problem goes away if I import the module manually, but I don't think I should have to do this.
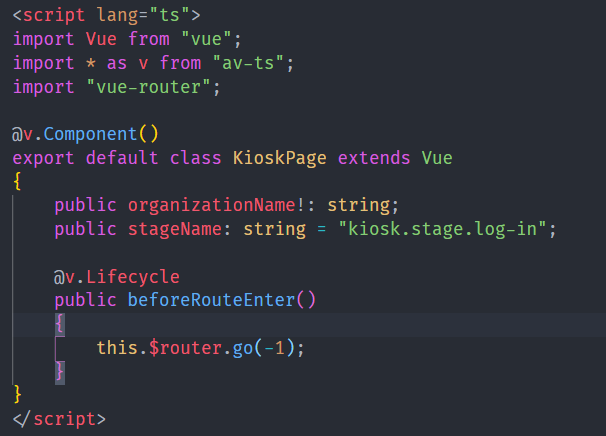
Note: most of my node_modules are two directories above the location of my tsconfig.json, because this is a Lerna monorepo. However, it should still work anyway, as it does in normal TS files.
TS: 3.4.1 (Workspace version)
Vetur: 0.18.1
VSC: 1.33.0
vetur.useWorkspaceDependencies: true
OS: Windows 10
 laptou
on 7 Apr 2019
laptou
on 7 Apr 2019
Note: most of my node_modules are two directories above the location of my tsconfig.json, because this is a Lerna monorepo.
Not really yet, https://github.com/vuejs/vetur/issues/815.
octref
on 9 Apr 2019
@octref I see. This is a multi-root workspace though, and my tsconfig.json is in the root of one of my projects. Is that scenario also not supported yet?
laptou
on 9 Apr 2019
Unfortunately not yet: https://github.com/vuejs/vetur/issues/424
octref
on 9 Apr 2019
Also chiming in, seeing significant slowness in .vue files with intellisense and error checking on typescript. Sometimes I even see the red squiggle line advance character by character, example:
https://www.screencast.com/t/AiPejiuaKv
In my recollection this got noticeable on the upgrade from VSCode 1.29 -> 1.30. Everything else latest here - VS Code 1.33.1, Vetur 0.18.1, Windows 10 1809, typescript 3.4.2.
What can I do to help toward a resolution or workaround? Vetur is awesome except for this issue. Thanks!
 NoahStahl
on 12 Apr 2019
NoahStahl
on 12 Apr 2019
@NoahStahl The problem is multifold, some are fixable and some not yet.
Does setting "vetur.validation.script": false make a difference?
Would it be possible for me to get access to your project to debug? (I can sign NDA if you want).
Or can you create a minimal repro from vue-cli or https://github.com/octref/veturpack so I can test?
octref
on 12 Apr 2019
I could make our project available to you, I believe it highlights the performance issues well (see comment further up)
cmcnicholas
on 13 Apr 2019
@cmcnicholas Thanks, feel free to email me or DM me on Twitter. More info here: https://blog.matsu.io/about.
octref
on 14 Apr 2019
@cmcnicholas Also does setting "vetur.validation.script": false make a difference?
octref
on 14 Apr 2019
@octref In my case, if I set validation to false, the performance is getting better.
Validation false

Validation true

 vip30
on 15 Apr 2019
vip30
on 15 Apr 2019
@cmcnicholas Also does setting "vetur.validation.script": false make a difference?
I have tried that setting and it doesn't seem to impact performance at all for me.
I have also made our repo available and have sent you an email, let me know if there is anything else I can do.
cmcnicholas
on 15 Apr 2019
@octref Disabling Vetur's script validation setting does remove the lag for me, very clear difference between the setting on and off. Definitely seems like validation could be the cause.
I'm not sure I'm allowed to share our project since my company owns it, but I will try to work on a from-scratch repro from clean vue-cli baseline. I'm using class components with property decorators and quite a bit of component inheritance, so maybe it is the overhead of these techniques that is pushing on the validation more than most projects.
NoahStahl
on 16 Apr 2019
@NoahStahl Thanks a lot. That's one factor from which I can optimize the cpu usage.
octref
on 16 Apr 2019
setting vetur.validation.script to false resolves performance problems for me too. What implication has this setting?
backbone87
on 17 Apr 2019
@octref I am also getting very slow autocomplete/Intellisense, error checking and code formatting. the veturpack repo does not reproduce the issue for me. I have also tried disabling all other extensions but the issue still persists. Sadly I can't give you the repo since it's not mine, but it is fairly large with over 60 components, about 25 of them have more than 1000 lines of code. We also have a similar number of typescript files, but these are smallish with 100 lines at the very most. Is there any other information that might help you debug this?
Edit: This issue seems be related with the high CPU usage. Everytime I trigger intellisense the CPU load jumps from 7 to 65 percent.
Edit2: I have tried deleting all the files which are more then 1000 lines long, which sums up to 36k lines of code and the intellisense is now significantly faster with only 1 second of delay (down from ~10).
 gurbindersingh
on 17 Apr 2019
gurbindersingh
on 17 Apr 2019
@backbone87 if you set this to false, seems the error will not be prompted anymore. That means you will not see any red lines in your file
vip30
on 17 Apr 2019
@vip30 That doesn't seem to be the case.
ffxsam
on 17 Apr 2019
Base on my testing, I use '''vue create''' and try vetur. It is very fast. Then, I copy 50 of components in src, it becomes slower but still ok(maybe 1 sec). Then I copy over 100 ts files inside the src folders, it delay about 3 to 4 secs. Finally I installed 30 node dependencies (jest, vue, socket.io...etc)
The intellisense need 6 secs to prompt
vip30
on 17 Apr 2019
@ffxsam sorry about that, but can I confirm that it is a vue file or ts file?
vip30
on 17 Apr 2019
Tested this in .vue files as well as .ts files, it highlights errors and warnings just fine.
ffxsam
on 17 Apr 2019
Can you please hover the line to see is that vetur error or something else?
In my case, after I set validate to false I randomly type something (hwjwi) inside the method on vue file. It doesn't has any error highlighting
After I set true, it prompt error from vetur
vip30
on 17 Apr 2019

ffxsam
on 17 Apr 2019

Validation to true
vip30
on 17 Apr 2019
Ahh, I guess I don't care about the checks from Vetur since I use eslint (you should be, too). 😉
ffxsam
on 17 Apr 2019
@ffxsam Can you please type this.abc inside the vue file to see if there is any error or warning?
Seems I can't get the error highlight from ts if using eslint only
vip30
on 18 Apr 2019
Ah, you're right. With the vetur script validation off, this.abc shows me no warnings or errors.
ffxsam
on 18 Apr 2019
@octref I was able to spend some more time on investigation, and created a video with the behavior and some diagnostics investigation:
https://www.screencast.com/t/4awToWIC
From what I'm seeing, it looks like good evidence this is a behavior related to TypeScript and Vetur alone, not any other factor. Using tools like Process Monitor and Process Explorer, it's clear that the Vetur extension uses CPU and memory heavily on every keystroke into a VUE file, presumably for error checking. Further, there is a huge amount of file system activity on every keystroke, which appears to be a full scan of every TS-related file in the project, including SFCs, node packages, and plain ts files. This happens regardless of the setting vetur.validation.script.
The video shows the behavior even on a brand new vue-cli generated project with the TS option. Based on my project, I'd say the performance impact appears roughly linear to the number of files in the project, so the more files you have, the slower it gets.
I know that info doesn't solve anything, but hopefully it provides some clues or at least a demo of the performance of an actual case. Without knowing how the Vetur code works, it seems like whatever happens per keystroke input may need some attention with regards to impact and work done. Maybe some caching or debounce could provide some breathing room?
If you do have any documentation about how to understand the vetur code and work with the project, I'd be interested to know in case I could help dig further at the code level.
NoahStahl
on 23 Apr 2019
@NoahStahl Thank you so much. This will be really helpful for me to diagnose perf issues.
I have 3 angles to increate perf — will write them in a new issue.
there is a huge amount of file system activity on every keystroke,
That's something I'm unaware of. I'll look into this. Likely cause it TypeScript's module resolution or VS Code's file watcher causing this.
octref
on 26 Apr 2019
@NoahStahl does it happen to TSServer too?
- Run command "Developer: Process Explorer". Find PID of
tsserver:

- Use the file access monitor you have to see its file system access
In my test it seems "lots of file system access" and "short CPU spike" are happening to both TS Server and Vue Language Server. However TS Server is fast and VLS is slow.
Can you also try disabling vetur.validation.script — does it help?
Finally it seems this started happening for you since 0.18.1, which includes this PR. Can you try downloading 0.18.0 and see if it's problematic?
One last thing. For people in this thread, if you can follow https://github.com/vuejs/vetur/blob/master/.github/PERF_ISSUE.md#profiling to get a profile of VLS and attach it to this thread, it would help me a lot diagnosing the issue. Thanks in advance!
octref
on 1 May 2019
Here is some profiling. CPU-20190501T142232.cpuprofile.zip
For the record the target wasn't appearing under "Remote Target", so I clicked "open dedicated DevTools for Node" above and manually added localhost:8000
I also used VSCode Insiders with only Vetur extension, and did some autocompletion on objects (it was lagging quite a bit, our project is big).
 rndmerle
on 1 May 2019
rndmerle
on 1 May 2019
@rndmerle Your issue seems to be the same as https://github.com/vuejs/vetur/issues/1051#issuecomment-488217064, which should be gone after https://github.com/vuejs/vetur/issues/1264.
octref
on 1 May 2019
1264 is fixed. I'll publish later today.
If you are still running into perf issues, please follow https://github.com/vuejs/vetur/blob/master/.github/PERF_ISSUE.md to file a new issue with profiles.
octref
on 2 May 2019
(Sorry for the long comment)
Hi @octref, we just started working with Vue at work, and i noticed this performance issue you've been talking. Debuging a bit the code i notice a few things.
The typescript compiler is a bit aggresive, so every time you request a new program, it calls synchronizeHostData which loops all the files in the service against the new ones (it checks the host cached versions). The root files to exam come from the tsconfig.json, the program knows them all, because its does the pattern matching of the includes and excludes and fileGlobs and other, when the compiler parses the options, and it reads deep all directories, and already lists all the files that it has to have in mind. It ocationally might require more files (at least to know if they exists and things like that), then pretty much all the ts files in your project will be read from disk, parsed into an ast, and diagnosticated (but not transformed into js unless requested).
I've been looking into one of your branches and i think its on the right track.
I have a few questions for you.
why do you guys have multiples languageService. i think. Having everything in one service is better, everything can come from the same place, like resolution of dependencies for example. The typeChecker (i dont know why it doesnt show in the search ) its very well architectured, it caches all the symbol resolutions of every variable, function, interface, class (which is used for example to coerce types), you name it, and after doing some calculations, for example for tslint, you pretty much have everything resolved, thats why the vscode default extension starts a little slow, but then gets much faster.
I would like to give it a try, i already have in mind a few refactors for now and the future. I dont know how you guys work, if you'd like me to create feature request and start working on those pull requests?, or should i just come up with a pull request directly?
My ideas are the following.
1) Have a singleton file system, the fs has two roles, get the content of a file, and watch a file. Files in the tsconfig.json have to be watched. Watchpack is a great tool for watching the file system, It notifies with the now mtime of a watched file when its updated. So you can invalidate the cache. This would increase performance a lot i think, although it comes with a cost, If the user doesn't save the file, the compiler doesn't know it changed, but its something i think happens right now.
2) have a singleton for the language service. files that dont change, never get reparsed or anything. Think of all those vuex stores, and router modules, http services, basically any ts or .d.ts file.
3) I've noticed that the tsconfig options are not correctly read as well, i have the experimentalDecorators set on true, but it still complains about it, only in vue files. Which is a bummer, because we work with class based components on .vue files.
4) this is something for the future. It would be nice to take control of ts entirely. Right now, vetur only "processes" vue files with some weird twists (i dont know why you treat .vue.ts and .vue.template files differently for example, although im new to vue so that might be something). but it would be better to also format, lint, resolve, ts files in general. I've been looking to override the default ts extension, so all typescript files would be handled uniformly by vetur (feature enabled from options). I haven't had the time, but i think in some way or another, we could install the default language server (something like this one ), and re use it with some wrapper. if we find a way, that would speed things l a lot, in the current case, we are reading from disk to load the files to the language service, but the default behavior uses the unsaved one. Having control on all files means only one language services, that caches resolutions of all directives for the whole project, instead of having two that pretty much do the same, but don't know each other.
5) once 2 is done, pretty much anyone could try do to the same thing for other languages (scss, less, css) and use the same fs singleton and watchers, to reduce the noise to the lowest.
i think i can work out 1 and 2 this weekend, then 3 might take time, but i cant really tell.
Let me know what you think
 Ventilador
on 3 May 2019
Ventilador
on 3 May 2019
@octref i tried out the new version and while its improving the symptomes (e.g. the intellisense reacts faster), it still does not fix the root of the problem. The performance compared to plain .ts files is still way off and not in a satisfying state.
According to https://github.com/vuejs/vetur/issues/1051#issuecomment-487062122 the improved function is called many thousand times on change, but i dont see why it even needs to be called for non edited files? shouldnt the TSServer cache those ASTs and dont even request the contents of nonedited files?
backbone87
on 3 May 2019
@octref Thanks for the update! My observation is that the change has made 0.19.4 appear to be faster with intellisense, but has not improved the high system resource usage. For example, I tested opening VSCode and typing same 20 characters into two project files (one .vue, one .ts) and observing usage for VueServer vs TSServer:
VueServer: 181,000 IO reads, ~10% CPU
TSServer: 1800 reads, ~1% CPU
So it appears 10-100x work is being done by Vetur here for same input. I/O in particular is way beyond anything else happening in the system. I will look at submitting a profile per the other performance thread.
Strictly speaking, it doesn't seem that this issue is actually closed, unless it's now being tracked elsewhere? Thanks again for those digging into this one.
NoahStahl
on 3 May 2019
I also have this problem but it is very complicated for me to figure out where really the lag occurs.
The app I am working on is written in TypeScript, transpiled with Babel and built by webpack. The final bundle size is now 10MB. And it is very clear to me that every day development environment gets slower.
First of all, would the chain of compilation, transpilation and bundling affect the intellisense / linting and so on?
Secondly, if I start to write some code like ..
if(item.kind == "questi
I start to realize that some warnings (by Vetur) start to fill the problems tab. Is it possible that vetur checks the problems when I save?
 mustafaekim
on 5 May 2019
mustafaekim
on 5 May 2019
I think I have found a good fix. Can you try the VSIX linked here? https://github.com/vuejs/vetur/issues/1277#issuecomment-489456369
@Ventilador Thanks for your analysis! I think it's better to start with a small set of changes such as https://github.com/vuejs/vetur/pull/1278
- Vetur uses
vscode.workspace.createFileSysmteWatcherfrom VS Code: https://github.com/vuejs/vetur/blob/7fa2ead6831f22beaf6dd0ec87ed888a1c7ed65f/client/client.ts#L43. I won't change it to anything else since it handles many edge cases and limit file system usage as much as possible. It's a pretty advanced mix solution of native C# code (for Windows), nsfw and chokidar. - This is already how Vetur works. Files that don't change don't change version in in the service host are cached.
- Yeah, now I plan to shift away from reading
tsconfig.json, since Vetur shouldn't really read its include/exclude patterns for language service. But if you do setexperimentalDecoratorsin tsconfig.json, Vetur should read it (if it's in the root folder). - https://github.com/Microsoft/TypeScript/wiki/Writing-a-Language-Service-Plugin, it won't likely happen soon. The limitation is complicated so I won't expand here.
octref
on 5 May 2019
Try 0.20.0 which should be much faster.
octref
on 8 May 2019
Try 0.20.0 which should be much faster.
very tks, it's faster than before. but the cpu high usage is also existing when i moved the cursor in vue files or coding. my mac is hot as before.
 dingcang
on 8 May 2019
dingcang
on 8 May 2019
@octref _Much_ better! Wow. Checked out CPU usage on my Mac mini, seemed pretty normal. Even in JS files, hints/autosuggest/etc takes up a bit of CPU. Vetur was comparable.
ffxsam
on 8 May 2019
@dingcang Can you follow https://github.com/vuejs/vetur/blob/master/.github/PERF_ISSUE.md to report a new issue?
octref
on 8 May 2019
Just got to say, thank you @octref!
Really appreciate the amount of work you put in to this.
kamerat
on 8 May 2019
@octref Amazing! The intellisense is back!! Many thanks for your effort
vip30
on 8 May 2019
done!Vetur 0.20.0 Intellisense work perfect!
lizy0329
on 9 May 2019
@octref thank you very much
parox2014
on 9 May 2019
Related issues
 Dealerpriest
·
3Comments
octref
·
3Comments
Dealerpriest
·
3Comments
octref
·
3Comments
 ghost
·
3Comments
ghost
·
3Comments
 gabrielboliveira
·
3Comments
gabrielboliveira
·
3Comments
 shaunc
·
3Comments
shaunc
·
3Comments
Most helpful comment
@octref I was able to spend some more time on investigation, and created a video with the behavior and some diagnostics investigation:
https://www.screencast.com/t/4awToWIC
From what I'm seeing, it looks like good evidence this is a behavior related to TypeScript and Vetur alone, not any other factor. Using tools like Process Monitor and Process Explorer, it's clear that the Vetur extension uses CPU and memory heavily on every keystroke into a VUE file, presumably for error checking. Further, there is a huge amount of file system activity on every keystroke, which appears to be a full scan of every TS-related file in the project, including SFCs, node packages, and plain ts files. This happens regardless of the setting vetur.validation.script.
The video shows the behavior even on a brand new vue-cli generated project with the TS option. Based on my project, I'd say the performance impact appears roughly linear to the number of files in the project, so the more files you have, the slower it gets.
I know that info doesn't solve anything, but hopefully it provides some clues or at least a demo of the performance of an actual case. Without knowing how the Vetur code works, it seems like whatever happens per keystroke input may need some attention with regards to impact and work done. Maybe some caching or debounce could provide some breathing room?
If you do have any documentation about how to understand the vetur code and work with the project, I'd be interested to know in case I could help dig further at the code level.