Describe the bug
Syncing the chain as a new node is quite slow
To Reproduce
Steps to reproduce the behavior:
- init a new node
- start the new node
Expected behavior
chain to sync fast
This is somewhat expected right now because our current sync algorithm fetches one block at a time, but it actually looks like fetching the data is not the bottleneck right now. (its still slow, but not the slowest part)
Investigating this further shows that processing the state transitions is very fast most of the time, but periodically (on my machine) it takes 6 seconds. I havent determined the exact cause of this, but i'm guessing its proofs related.
In addition, the time around state transition processing is significant, often about 500ms. This is likely coming from state tree flushing or loading. I'll investigate that further as well.
 whyrusleeping
All 27 comments
cbor marshaling appears to be killer here: https://ipfs.io/ipfs/Qme93usPHPtqZSPXx2vUo22yPuJmhzfvHyrvbsfcB4STpA
whyrusleeping
on 21 Feb 2019
looks like reading groth parameters from the cache takes 6 seconds... that would explain the messages taking six seconds to process. kinda.
cc @porcuquine @laser
whyrusleeping
on 21 Feb 2019
The groth params is a know issue, you can get around it by linking the require params to /tmp/filecoin-proof-parameters/params.out (which will result in them being loaded and kept in memory). A more generic solution is being tracked over on issue 477 of rust-fil-proofs (https://github.com/filecoin-project/rust-fil-proofs/issues/477)
 travisperson
on 21 Feb 2019
travisperson
on 21 Feb 2019
Closing this in favor of #477.
 rosalinekarr
on 21 Feb 2019
rosalinekarr
on 21 Feb 2019
cbor marshaling appears to be killer here: https://ipfs.io/ipfs/Qme93usPHPtqZSPXx2vUo22yPuJmhzfvHyrvbsfcB4STpA
Impressions:
GC is taking 27% of the total (sum the runtime.mallocgc total plus the runtime.mcall total).
To detect any major (and hopefully low-hanging fruit) bottlenecks that might be in refmt and might be easily fixed there, I'm looking for any single node that has >5% in the top/local number. There are none :/ No easy issues.
(Which is not to say there aren't improvements possible in refmt -- it is owning 53% of the total time. But whatever they are, they're not easy or obvious quickfix territory.)
 warpfork
on 21 Feb 2019
warpfork
on 21 Feb 2019
cbor marshaling appears to be killer here: https://ipfs.io/ipfs/Qme93usPHPtqZSPXx2vUo22yPuJmhzfvHyrvbsfcB4STpA
Some other things that are interesting-looking:
go-ipld-cbor.WrapObjectowns a total of 23.41s...
- it passes 12.54s down to the
refmt.Clonecall below it. That's about half. - (first of all, Clone? Not unmarshalling? How much of this is going to go away when we are able to migrate to an IPLD library that's a little less... copyhappy?)
- the other dottedlines out to the side fly pretty far and all go to more or less memory-management functions:
- 0.29s to
runtime.newobject - 1.67s to
go-ipld-cbor.traverse(lotta stringconcat time under there, incidentally) - 0.05s to flat out
runtime.memmove - ... wait, we're outta arrows? what?
- ... there's... 23.41-12.54-0.29-1.67-0.05 = 8.86s left unaccounted for here. That's 38% of this node! And the node itself is labeled as taking 0s for itself? What gives?
- it passes 12.54s down to the
pprof graphs can be hard to read. Am I reading that node and it's connections right? If I am, and there's an eight second large mystery in there, where'd it go?
One guess is that it disappears into GC time. This kind of prof graph is gathered by probing that looks at where the stack is at any one quanta of time. If there's a function that triggers a lot of GC, but doesn't otherwise do a lot of work, then... it can show up like this: no blame on the function, just a weird... gap, where code in this area happens to take longer overall despite not showing up on the callgraphs for as much time as it should.
warpfork
on 21 Feb 2019
@warpfork Yeah, I think the copy stuff is pretty sketch. In addition, I think we're unmarshaling stuff and then re-marshaling it a bunch. The main reason I don't rip that out immediately is because we need to be sure that the encodings are canonical. Does refmt have a 'error if the things not canonically encoded' option?
whyrusleeping
on 21 Feb 2019
This is getting weirder as I look at code side-by-side with the prof graph.
go-ipld-cbor.WrapObject calls both a Marshal and a Clone. Only the Clone is showing up in the graph. That seems odd. If either of those is doing substantial work, then both should be doing substantial work. Maybe I was too hasty to blame a bunch of mystery-time on GC. Maybe this graph just trimmed a bunch of (important!) nodes and doesn't visualize it very politely. :grapes:
So let's suppose an (unlisted) Marshal took those 8.86s remaining mystery-seconds. And we see the Clone takes 12.54s.
Well, this is an interesting benchmark, I guess. Cloning an object into golang memory can be slower than serializing it to a byte slice. That... checks out, I guess. Many more granular mallocs for the receiving side of the object clone -> gonna take time.
Ohhh. And refmt/shared/TokenPump.Run has a total of 23.9s flowing through it despite only having arrows for 4.12s and 12.28s flowing into it. Well shucks, there's 7.50s mystery-seconds there, that's almost the whole missing set! It's as if the pprof tool just elided a super semantically relevant node that channeled all this through a Marshal call and left no indications of its malfeasance, good cool oh my god pprof if you had an anatomy I don't know pprof but it would not be good
. . . . Yeah. Okay. So, big takeaway: less copying would be more good.
warpfork
on 21 Feb 2019
Does refmt have a 'error if the things not canonically encoded' option?
I don't think it does at the moment, but if that's the main thing it would take to let us rip some of these other copies out, then yeah, we should get on that.
warpfork
on 21 Feb 2019
@rosalinekarr this issue is definitely not a duplicate of #477...
whyrusleeping
on 21 Feb 2019
@whyrusleeping Taking off the "bug" label and title since this is more of an optimization than a problem blocking users.
rosalinekarr
on 21 Feb 2019
@rosalinekarr no, its a bug that a chain thats been running for maybe a week takes many hours to sync.
whyrusleeping
on 22 Feb 2019
some PRs to improve things:
- https://github.com/filecoin-project/go-filecoin/pull/2069
- https://github.com/filecoin-project/go-filecoin/pull/2067
- https://github.com/filecoin-project/go-filecoin/pull/2068
In addition, I wrote up and merged some improvements to the chain sync documented in the spec, and filed an issue to implement all that here: https://github.com/filecoin-project/go-filecoin/issues/2065
whyrusleeping
on 22 Feb 2019
@whyrusleeping please self-assign if you're taking responsibility for this
 anorth
on 22 Feb 2019
anorth
on 22 Feb 2019
Also this issue definitely doesnt help: https://github.com/filecoin-project/go-filecoin/issues/2064
@anorth I'm no longer looking into this. The PRs i submitted could use a shepherd, and theres still more work to do to resolve this.
whyrusleeping
on 22 Feb 2019
@whyrusleeping It's unfortunate, and it's certainly not the behavior we want for main net, but chain syncing is still working, albeit painfully slowly. The bug label should be reserved for issues that break functionality. I'm relabelling as technical debt.
rosalinekarr
on 22 Feb 2019
no. seriously. unacceptably low performance must be considered a bug.
whyrusleeping
on 22 Feb 2019
technical debt is: "This function is kinda weird and should be refactored" or "This ThingDoer is tightly coupled and is hard to test, we should rewrite it". "Chain takes a full day to sync" is a bug.
whyrusleeping
on 23 Feb 2019
While I understand its not _that_ important at this moment, it does really need to get better.
I've been running a machine for 22 hours now;
AMD FX-6300 @ 3,5 - 4,1GHz
8GB DDR3 @ 1333mhz
1TB SAMSUNG HD103SJ (This is the location of the chain and OS)
3TB WDC WD30EFRX-68E (reserved for hosting space)
500 megabit up / down internet connection
Here's what the top of htop looks like:
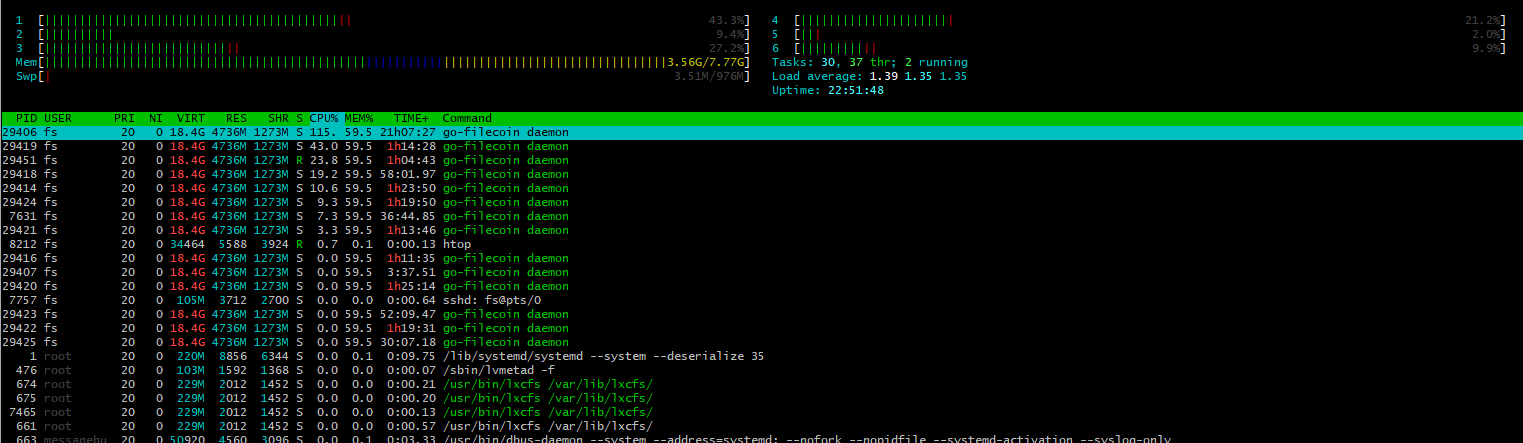
Somehow its only on block 29784.
The Peer ID is QmQ7WoVLeEFUgMmQeFiF6ogyrWSw6YQWK47MXE8C9WucVX
Since this chain is only 17 days old, thats going to be a real problem if the chain would be like 2 years old.
Also for people wanting to test, try and help develop this will slow things down. I think I have to agree with @whyrusleeping that is actually should be classified as bug. Its a major inconvenience. On the other hand it doesn't seem break anything, so there's that..
I hope I can get up to speed quickly and help out either way :) Cheers!
 RobQuistNL
on 12 Apr 2019
RobQuistNL
on 12 Apr 2019
I suppose the big amounts of resource usage is also included in this issue, so won't open up a new issue for that. I couldn't find any, but I think the resource issue (CPU / Memory) will be tackled as well.
RobQuistNL
on 18 Apr 2019
@whyrusleeping @ZenGround0 @frrist and others: I am attempting to corral the issues about chain sync into a fuller picture so we can plan an attack. Some questions:
- As you understand it now, is the major bottleneck downloading the chain data or subsequently loading and validating the messages?
- Is the discussion with @warpfork above primarily related to downloading and storing the chain data, or validating it?
- Can/should we retarget this issue into a narrower outcome, or perhaps close it in favour of a raft of more specific stories?
anorth
on 29 Apr 2019
1 month late but
- loading and validating the messages
- validating it
- yes, I'm in favor of closing this down in favor of @frrist's more up to date issues
 ZenGround0
on 28 May 2019
ZenGround0
on 28 May 2019
It is difficult to sync data from Devnets, so crazy! I suggest close the test network.
 taylorshuang
on 11 Jun 2019
taylorshuang
on 11 Jun 2019
Chain Sync is very very slowly! I have run devnet newwork two weeks, but i find my block height is lower than the test network forever. This is a very bad experience for me.
taylorshuang
on 11 Jun 2019
Thanks for your comments. We understand the difficulty and are working to resolve it.
anorth
on 12 Jun 2019
Want to know the process. Any doubt about this problem? May i can do some testing and find out why, for i don't want to stop my filecoin journey...
 songjinli8
on 9 Jul 2019
songjinli8
on 9 Jul 2019
The 0.3.2 release improved things somewhat, and we're actively working on this problem for the 0.4 release (August).
I am closing this issue in favour of some more specific and actionable stories currently and to be filed. We intend to address both the downloading and validation latency.
anorth
on 17 Jul 2019
Related issues
 steven004
·
6Comments
steven004
·
6Comments
 mishmosh
·
6Comments
mishmosh
·
6Comments
 ognots
·
7Comments
ognots
·
7Comments
 phritz
·
6Comments
phritz
·
7Comments
phritz
·
6Comments
phritz
·
7Comments
Most helpful comment
While I understand its not _that_ important at this moment, it does really need to get better.
I've been running a machine for 22 hours now;
Here's what the top of

htoplooks like:Somehow its only on block 29784.
The Peer ID is
QmQ7WoVLeEFUgMmQeFiF6ogyrWSw6YQWK47MXE8C9WucVXSince this chain is only 17 days old, thats going to be a real problem if the chain would be like 2 years old.
Also for people wanting to test, try and help develop this will slow things down. I think I have to agree with @whyrusleeping that is actually should be classified as bug. Its a major inconvenience. On the other hand it doesn't seem break anything, so there's that..
I hope I can get up to speed quickly and help out either way :) Cheers!