Velero: Velero / Restic backup fails for PVC after a few days
Hello together,
we have following problem with velero and restic backups.
What steps did you take and what happened:
[A clear and concise description of what the bug is, and what commands you ran.)
At the moment we have four OKD v3.11 Cluster which are running in Azure.
For the PVCs we're using Azure File and Azure Disk.
On all four Cluster we're doing the same backups with velero and restic.
Now here is the problem on one cluster we don't have any problem and on the other three cluster we have this problem:
The Backup is running without any problem for a few days, after a few days we get problems with the restic backups.
We get PartiallyFailed errors for the backup of the PVCs.
To fix the problem we have to delete all restic pods, but some restic pods couldn't get terminated, so we have to restared the whole node to fix it.
After this was done the backup is running a few days without any problem:
velero backup get
NAME STATUS CREATED EXPIRES STORAGE LOCATION SELECTOR
cluster-20200514180050 PartiallyFailed (52 errors) 2020-05-14 18:02:30 +0000 UTC 29d default
cluster-20200514120050 PartiallyFailed (52 errors) 2020-05-14 12:01:39 +0000 UTC 29d default
cluster-20200514060050 PartiallyFailed (62 errors) 2020-05-14 06:00:50 +0000 UTC 29d default
cluster-20200513180049 PartiallyFailed (57 errors) 2020-05-13 18:01:37 +0000 UTC 28d default
cluster-20200513120049 PartiallyFailed (51 errors) 2020-05-13 12:00:49 +0000 UTC 28d default
cluster-20200513060049 Completed 2020-05-13 06:00:49 +0000 UTC 28d default
cluster-20200512180049 Completed 2020-05-12 18:00:49 +0000 UTC 27d default
cluster-20200512120049 Completed 2020-05-12 12:00:49 +0000 UTC 27d default
cluster-20200512060012 PartiallyFailed (52 errors) 2020-05-12 06:00:12 +0000 UTC 27d default
cluster-20200511180012 PartiallyFailed (52 errors) 2020-05-11 18:01:44 +0000 UTC 26d default
cluster-20200511120012 PartiallyFailed (52 errors) 2020-05-11 12:00:58 +0000 UTC 26d default
cluster-20200511060012 PartiallyFailed (52 errors) 2020-05-11 06:00:12 +0000 UTC 26d default
cluster-20200510180012 PartiallyFailed (52 errors) 2020-05-10 18:01:41 +0000 UTC 25d default
cluster-20200510120012 PartiallyFailed (52 errors) 2020-05-10 12:00:56 +0000 UTC 25d default
cluster-20200510060012 PartiallyFailed (52 errors) 2020-05-10 06:00:12 +0000 UTC 25d default
cluster-20200509180011 PartiallyFailed (52 errors) 2020-05-09 18:01:40 +0000 UTC 24d default
cluster-20200509120011 PartiallyFailed (52 errors) 2020-05-09 12:00:56 +0000 UTC 24d default
cluster-20200509060011 PartiallyFailed (52 errors) 2020-05-09 06:00:11 +0000 UTC 24d default
cluster-20200508180011 PartiallyFailed (52 errors) 2020-05-08 18:01:41 +0000 UTC 23d default
cluster-20200508120011 PartiallyFailed (52 errors) 2020-05-08 12:00:57 +0000 UTC 23d default
cluster-20200508060011 PartiallyFailed (52 errors) 2020-05-08 06:00:12 +0000 UTC 23d default
cluster-20200507180010 PartiallyFailed (52 errors) 2020-05-07 18:01:44 +0000 UTC 22d default
cluster-20200507120010 PartiallyFailed (52 errors) 2020-05-07 12:00:57 +0000 UTC 22d default
cluster-20200507060010 PartiallyFailed (52 errors) 2020-05-07 06:00:10 +0000 UTC 22d default
cluster-20200506180010 PartiallyFailed (51 errors) 2020-05-06 18:00:10 +0000 UTC 21d default
cluster-20200506120010 Completed 2020-05-06 12:00:10 +0000 UTC 21d default
cluster-20200506060010 Completed 2020-05-06 06:00:10 +0000 UTC 21d default
cluster-20200505180010 Completed 2020-05-05 18:00:10 +0000 UTC 20d default
cluster-20200505120009 Completed 2020-05-05 12:00:09 +0000 UTC 20d default
cluster-20200505060009 Completed 2020-05-05 06:00:09 +0000 UTC 20d default
cluster-20200504180009 Completed 2020-05-04 18:00:09 +0000 UTC 19d default
cluster-20200504120009 Completed 2020-05-04 12:00:09 +0000 UTC 19d default
What did you expect to happen:
That the backup is running without any problem and we don't get the issue every few days.
The output of the following commands will help us better understand what's going on:
kubectl logs deployment/velero -n velero
We only get following log entries in the velero pod
`(Pasting long output into a [GitHub gist](https://gist.github.com) or other pastebin is fine.) time="2020-05-15T04:02:00Z" level=debug msg="Checking repository for stale locks" controller=restic-repository logSource="pkg/controller/restic_repository_controller.go:140" name=div7-**** namespace=openshift-backup time="2020-05-15T04:02:01Z" level=debug msg="Ran restic command" command="restic unlock --repo=azure:okd-c1-1eu1-b-p:/restic/div7-**** --password-file=/tmp/velero-restic-credentials-div7--**** --cache-dir=/scratch/.cache/restic" logSource="pkg/restic/repository_manager.go:275" repository=div7-**** stderr= stdout="successfully removed locks\n" time="2020-05-15T04:02:01Z" level=debug msg=resticRepositoryController.runMaintenanceIfDue controller=restic-repository logSource="pkg/controller/restic_repository_controller.go:217" name=div7--**** namespace=openshift-backup time="2020-05-15T04:02:01Z" level=debug msg="not due for maintenance" controller=restic-repository logSource="pkg/controller/restic_repository_controller.go:222" name=div7--**** namespace=openshift-backup time="2020-05-15T04:02:01Z" level=debug msg="Checking for existing backup storage locations to sync into cluster" controller=backup-sync logSource="pkg/controller/backup_sync_controller.go:124" time="2020-05-15T04:02:01Z" level=debug msg="Checking if backups need to be synced at this time for this location" backupLocation=default controller=backup-sync logSource="pkg/controller/backup_sync_controller.go:156" time="2020-05-15T04:02:31Z" level=debug msg="Checking for existing backup storage locations to sync into cluster" controller=backup-sync logSource="pkg/controller/backup_sync_controller.go:124" time="2020-05-15T04:02:31Z" level=debug msg="Checking if backups need to be synced at this time for this location" backupLocation=default controller=backup-sync logSource="pkg/controller/backup_sync_controller.go:156" time="2020-05-15T04:02:31Z" level=debug msg="Checking backup location for backups to sync into cluster" backupLocation=default controller=backup-sync logSource="pkg/controller/backup_sync_controller.go:163" time="2020-05-15T04:02:31Z" level=debug msg="looking for plugin in registry" controller=backup-sync kind=ObjectStore logSource="pkg/plugin/clientmgmt/manager.go:99" name=velero.io/azure time="2020-05-15T04:02:31Z" level=debug msg="creating new restartable plugin process" command=/plugins/velero-plugin-for-microsoft-azure controller=backup-sync kind=ObjectStore logSource="pkg/plugin/clientmgmt/manager.go:114" name=velero.io/azure time="2020-05-15T04:02:31Z" level=debug msg="starting plugin" args="[/plugins/velero-plugin-for-microsoft-azure --log-level debug]" cmd=/plugins/velero-plugin-for-microsoft-azure controller=backup-sync logSource="pkg/plugin/clientmgmt/logrus_adapter.go:74" path=/plugins/velero-plugin-for-microsoft-azure time="2020-05-15T04:02:31Z" level=debug msg="plugin started" cmd=/plugins/velero-plugin-for-microsoft-azure controller=backup-sync logSource="pkg/plugin/clientmgmt/logrus_adapter.go:74" path=/plugins/velero-plugin-for-microsoft-azure pid=13825 time="2020-05-15T04:02:31Z" level=debug msg="waiting for RPC address" cmd=/plugins/velero-plugin-for-microsoft-azure controller=backup-sync logSource="pkg/plugin/clientmgmt/logrus_adapter.go:74" path=/plugins/velero-plugin-for-microsoft-azure time="2020-05-15T04:02:31Z" level=debug msg="using plugin" cmd=/plugins/velero-plugin-for-microsoft-azure controller=backup-sync logSource="pkg/plugin/clientmgmt/logrus_adapter.go:74" version=2 time="2020-05-15T04:02:31Z" level=debug msg="plugin address" address=/tmp/plugin136593745 cmd=/plugins/velero-plugin-for-microsoft-azure controller=backup-sync logSource="pkg/plugin/clientmgmt/logrus_adapter.go:74" network=unix pluginName=velero-plugin-for-microsoft-azure time="2020-05-15T04:02:31Z" level=debug msg="Got backups from backup store" backupCount=62 backupLocation=default controller=backup-sync logSource="pkg/controller/backup_sync_controller.go:178" time="2020-05-15T04:02:31Z" level=debug msg="Got backups from cluster" backupCount=62 backupLocation=default controller=backup-sync logSource="pkg/controller/backup_sync_controller.go:185" time="2020-05-15T04:02:31Z" level=debug msg="No backups found in the backup location that need to be synced into the cluster" backupLocation=default controller=backup-sync logSource="pkg/controller/backup_sync_controller.go:198" time="2020-05-15T04:02:31Z" level=debug msg="plugin process exited" cmd=/plugins/velero-plugin-for-microsoft-azure controller=backup-sync logSource="pkg/plugin/clientmgmt/logrus_adapter.go:74" path=/plugins/velero-plugin-for-microsoft-azure pid=13825 time="2020-05-15T04:02:31Z" level=debug msg="plugin exited" cmd=/plugins/velero-plugin-for-microsoft-azure controller=backup-sync logSource="pkg/plugin/clientmgmt/logrus_adapter.go:74" time="2020-05-15T04:02:50Z" level=debug msg="Running processSchedule" controller=schedule key=openshift-backup/cluster logSource="pkg/controller/schedule_controller.go:139" time="2020-05-15T04:02:50Z" level=debug msg="Getting Schedule" controller=schedule key=openshift-backup/cluster logSource="pkg/controller/schedule_controller.go:145" time="2020-05-15T04:02:50Z" level=debug msg="Cloning schedule" controller=schedule key=openshift-backup/cluster logSource="pkg/controller/schedule_controller.go:163" time="2020-05-15T04:02:50Z" level=debug msg="Schedule is not due, skipping" controller=schedule logSource="pkg/controller/schedule_controller.go:250" nextRunTime="2020-05-15 06:00:00 +0000 UTC" schedule=openshift-backup/cluster time="2020-05-15T04:14:01Z" level=debug msg="Backup has not expired yet, skipping" backup=openshift-backup/cluster-20200424120035 controller=gc-controller expiration="2020-05-24 12:00:35 +0000 UTC" logSource="pkg/controller/gc_controller.go:133"velero backup describe <backupname>orkubectl get backup/<backupname> -n velero -o yaml
`Name: cluster-20200514180050
Namespace: openshift-backup
Labels: velero.io/schedule-name=cluster
velero.io/storage-location=default
Annotations:
Phase: PartiallyFailed (run velero backup logs cluster-20200514180050 for more information)
Errors: 52
Warnings: 0
Namespaces:
Included: *
Excluded: openshift-logging, openshift-monitoring, openshift-backup, cocdit-opendistro, lens-metrics, monitoring
Resources:
Included: *
Excluded: storageclasses.storage.k8s.io, groups.user.openshift.io, identities.user.openshift.io, useridentitymappings.user.openshift.io, users.user.openshift.io, images.image.openshift.io
Cluster-scoped: included
Label selector:
Storage Location: default
Snapshot PVs: false
TTL: 720h0m0s
Hooks:
Backup Format Version: 1
Started: 2020-05-14 18:02:30 +0000 UTC
Completed: 2020-05-15 00:03:22 +0000 UTC
Expiration: 2020-06-13 18:02:30 +0000 UTC
Persistent Volumes:
Restic Backups (specify --details for more information):
Completed: 14
New: 38`
velero backup logs <backupname>
time="2020-05-15T00:02:50Z" level=info msg="Executing podAction" backup=openshift-backup/cluster-20200514180050 cmd=/velero logSource="pkg/backup/pod_action.go:51" pluginName=velero
time="2020-05-15T00:02:50Z" level=info msg="Done executing podAction" backup=openshift-backup/cluster-20200514180050 cmd=/velero logSource="pkg/backup/pod_action.go:77" pluginName=velero
time="2020-05-15T00:02:50Z" level=debug msg="Skipping action because it does not apply to this resource" backup=openshift-backup/cluster-20200514180050 group=v1 logSource="pkg/backup/item_backupper.go:311" name=livewriter-12-ljwsz namespace=div7-**** resource=pods
time="2020-05-15T00:02:50Z" level=debug msg="Skipping action because it does not apply to this resource" backup=openshift-backup/cluster-20200514180050 group=v1 logSource="pkg/backup/item_backupper.go:311" name=livewriter-12-ljwsz namespace=div7-**** resource=pods
time="2020-05-15T00:02:50Z" level=debug msg="Executing post hooks" backup=openshift-backup/cluster-20200514180050 group=v1 logSource="pkg/backup/item_backupper.go:247" name=livewriter-12-ljwsz namespace=div7-**** resource=pods
time="2020-05-15T00:02:50Z" level=info msg="Backing up item" backup=openshift-backup/cluster-20200514180050 group=v1 logSource="pkg/backup/item_backupper.go:169" name=reverse-proxy-dashboard-9-fwtgb namespace=div7-**** resource=pods
time="2020-05-15T00:02:50Z" level=debug msg="Executing pre hooks" backup=openshift-backup/cluster-20200514180050 group=v1 logSource="pkg/backup/item_backupper.go:171" name=reverse-proxy-dashboard-9-fwtgb namespace=div7-**** resource=pods
time="2020-05-15T00:02:50Z" level=debug msg="Skipping action because it does not apply to this resource" backup=openshift-backup/cluster-20200514180050 group=v1 logSource="pkg/backup/item_backupper.go:311" name=reverse-proxy-dashboard-9-fwtgb namespace=div7-**** resource=pods
time="2020-05-15T00:02:50Z" level=info msg="Executing custom action" backup=openshift-backup/cluster-20200514180050 group=v1 logSource="pkg/backup/item_backupper.go:330" name=reverse-proxy-dashboard-9-fwtgb namespace=div7-**** resource=pods
time="2020-05-15T00:02:50Z" level=info msg="Executing podAction" backup=openshift-backup/cluster-20200514180050 cmd=/velero logSource="pkg/backup/pod_action.go:51" pluginName=velero
time="2020-05-15T00:02:50Z" level=info msg="Done executing podAction" backup=openshift-backup/cluster-20200514180050 cmd=/velero logSource="pkg/backup/pod_action.go:77" pluginName=velero
time="2020-05-15T00:02:50Z" level=debug msg="Skipping action because it does not apply to this resource" backup=openshift-backup/cluster-20200514180050 group=v1 logSource="pkg/backup/item_backupper.go:311" name=reverse-proxy-dashboard-9-fwtgb namespace=div7-**** resource=pods
time="2020-05-15T00:02:50Z" level=debug msg="Skipping action because it does not apply to this resource" backup=openshift-backup/cluster-20200514180050 group=v1 logSource="pkg/backup/item_backupper.go:311" name=reverse-proxy-dashboard-9-fwtgb namespace=div7-**** resource=pods
time="2020-05-15T00:02:50Z" level=debug msg="Executing post hooks" backup=openshift-backup/cluster-20200514180050 group=v1 logSource="pkg/backup/item_backupper.go:247" name=reverse-proxy-dashboard-9-fwtgb namespace=div7-**** resource=pods
time="2020-05-15T00:02:50Z" level=info msg="Backing up item" backup=openshift-backup/cluster-20200514180050 group=v1 logSource="pkg/backup/item_backupper.go:169" name=saml-service-provider-9-5wrc4 namespace=div7-**** resource=pods
time="2020-05-15T00:02:50Z" level=debug msg="Executing pre hooks" backup=openshift-backup/cluster-20200514180050 group=v1 logSource="pkg/backup/item_backupper.go:171" name=saml-service-provider-9-5wrc4 namespace=div7-**** resource=pods
time="2020-05-15T00:02:50Z" level=debug msg="Skipping action because it does not apply to this resource" backup=openshift-backup/cluster-20200514180050 group=v1 logSource="pkg/backup/item_backupper.go:311" name=saml-service-provider-9-5wrc4 namespace=div7-**** resource=pods
time="2020-05-15T00:02:50Z" level=info msg="Executing custom action" backup=openshift-backup/cluster-20200514180050 group=v1 logSource="pkg/backup/item_backupper.go:330" name=saml-service-provider-9-5wrc4 namespace=div7-**** resource=pods
time="2020-05-15T00:02:50Z" level=info msg="Executing podAction" backup=openshift-backup/cluster-20200514180050 cmd=/velero logSource="pkg/backup/pod_action.go:51" pluginName=velero
time="2020-05-15T00:02:50Z" level=info msg="Adding pvc session-pvc to additionalItems" backup=openshift-backup/cluster-20200514180050 cmd=/velero logSource="pkg/backup/pod_action.go:67" pluginName=velero
time="2020-05-15T00:02:50Z" level=info msg="Done executing podAction" backup=openshift-backup/cluster-20200514180050 cmd=/velero logSource="pkg/backup/pod_action.go:77" pluginName=velero
time="2020-05-15T00:02:50Z" level=info msg="Backing up item" backup=openshift-backup/cluster-20200514180050 group=v1 logSource="pkg/backup/item_backupper.go:169" name=session-pvc namespace=div7-**** resource=persistentvolumeclaims
time="2020-05-15T00:02:50Z" level=debug msg="Executing pre hooks" backup=openshift-backup/cluster-20200514180050 group=v1 logSource="pkg/backup/item_backupper.go:171" name=session-pvc namespace=div7-**** resource=persistentvolumeclaims
time="2020-05-15T00:02:50Z" level=debug msg="Skipping action because it does not apply to this resource" backup=openshift-backup/cluster-20200514180050 group=v1 logSource="pkg/backup/item_backupper.go:311" name=session-pvc namespace=div7-**** resource=persistentvolumeclaims
time="2020-05-15T00:02:50Z" level=debug msg="Skipping action because it does not apply to this resource" backup=openshift-backup/cluster-20200514180050 group=v1 logSource="pkg/backup/item_backupper.go:311" name=session-pvc namespace=div7-**** resource=persistentvolumeclaims
time="2020-05-15T00:02:50Z" level=info msg="Executing custom action" backup=openshift-backup/cluster-20200514180050 group=v1 logSource="pkg/backup/item_backupper.go:330" name=session-pvc namespace=div7-**** resource=persistentvolumeclaims
time="2020-05-15T00:02:50Z" level=info msg="Executing PVCAction" backup=openshift-backup/cluster-20200514180050 cmd=/velero logSource="pkg/backup/backup_pv_action.go:49" pluginName=velero
time="2020-05-15T00:02:50Z" level=info msg="Backing up item" backup=openshift-backup/cluster-20200514180050 group=v1 logSource="pkg/backup/item_backupper.go:169" name=pvc-69581993-6f34-11ea-8d0a-000d3aaaafab namespace= resource=persistentvolumes
time="2020-05-15T00:02:50Z" level=debug msg="Executing pre hooks" backup=openshift-backup/cluster-20200514180050 group=v1 logSource="pkg/backup/item_backupper.go:171" name=pvc-69581993-6f34-11ea-8d0a-000d3aaaafab namespace= resource=persistentvolumes
time="2020-05-15T00:02:50Z" level=debug msg="Skipping action because it does not apply to this resource" backup=openshift-backup/cluster-20200514180050 group=v1 logSource="pkg/backup/item_backupper.go:311" name=pvc-69581993-6f34-11ea-8d0a-000d3aaaafab namespace= resource=persistentvolumes
time="2020-05-15T00:02:50Z" level=debug msg="Skipping action because it does not apply to this resource" backup=openshift-backup/cluster-20200514180050 group=v1 logSource="pkg/backup/item_backupper.go:311" name=pvc-69581993-6f34-11ea-8d0a-000d3aaaafab namespace= resource=persistentvolumes
time="2020-05-15T00:02:50Z" level=debug msg="Skipping action because it does not apply to this resource" backup=openshift-backup/cluster-20200514180050 group=v1 logSource="pkg/backup/item_backupper.go:311" name=pvc-69581993-6f34-11ea-8d0a-000d3aaaafab namespace= resource=persistentvolumes
time="2020-05-15T00:02:50Z" level=debug msg="Skipping action because it does not apply to this resource" backup=openshift-backup/cluster-20200514180050 group=v1 logSource="pkg/backup/item_backupper.go:311" name=pvc-69581993-6f34-11ea-8d0a-000d3aaaafab namespace= resource=persistentvolumes
time="2020-05-15T00:02:50Z" level=info msg="Executing takePVSnapshot" backup=openshift-backup/cluster-20200514180050 group=v1 logSource="pkg/backup/item_backupper.go:400" name=pvc-69581993-6f34-11ea-8d0a-000d3aaaafab namespace= resource=persistentvolumes
time="2020-05-15T00:02:50Z" level=info msg="Backup has volume snapshots disabled; skipping volume snapshot action." backup=openshift-backup/cluster-20200514180050 group=v1 logSource="pkg/backup/item_backupper.go:403" name=pvc-69581993-6f34-11ea-8d0a-000d3aaaafab namespace= resource=persistentvolumes
time="2020-05-15T00:02:50Z" level=debug msg="Executing post hooks" backup=openshift-backup/cluster-20200514180050 group=v1 logSource="pkg/backup/item_backupper.go:247" name=pvc-69581993-6f34-11ea-8d0a-000d3aaaafab namespace= resource=persistentvolumes
time="2020-05-15T00:02:50Z" level=debug msg="Skipping action because it does not apply to this resource" backup=openshift-backup/cluster-20200514180050 group=v1 logSource="pkg/backup/item_backupper.go:311" name=session-pvc namespace=div7-**** resource=persistentvolumeclaims
time="2020-05-15T00:02:50Z" level=debug msg="Executing post hooks" backup=openshift-backup/cluster-20200514180050 group=v1 logSource="pkg/backup/item_backupper.go:247" name=session-pvc namespace=div7-**** resource=persistentvolumeclaims
time="2020-05-15T00:02:50Z" level=debug msg="Skipping action because it does not apply to this resource" backup=openshift-backup/cluster-20200514180050 group=v1 logSource="pkg/backup/item_backupper.go:311" name=saml-service-provider-9-5wrc4 namespace=div7-**** resource=pods
time="2020-05-15T00:02:50Z" level=debug msg="Skipping action because it does not apply to this resource" backup=openshift-backup/cluster-20200514180050 group=v1 logSource="pkg/backup/item_backupper.go:311" name=saml-service-provider-9-5wrc4 namespace=div7-**** resource=pods
time="2020-05-15T00:02:50Z" level=debug msg="Executing post hooks" backup=openshift-backup/cluster-20200514180050 group=v1 logSource="pkg/backup/item_backupper.go:247" name=saml-service-provider-9-5wrc4 namespace=div7-**** resource=pods
time="2020-05-15T00:02:50Z" level=info msg="1 errors encountered backup up item" backup=openshift-backup/cluster-20200514180050 group=v1 logSource="pkg/backup/resource_backupper.go:283" name=saml-service-provider-9-5wrc4 namespace= resource=pods
time="2020-05-15T00:02:50Z" level=error msg="Error backing up item" backup=openshift-backup/cluster-20200514180050 error="timed out waiting for all PodVolumeBackups to complete" error.file="/go/src/github.com/vmware-tanzu/velero/pkg/restic/backupper.go:172" error.function="github.com/vmware-tanzu/velero/pkg/restic.(*backupper).BackupPodVolumes" group=v1 logSource="pkg/backup/resource_backupper.go:287" name=saml-service-provider-9-5wrc4 namespace= resource=pods
Anything else you would like to add:
[Miscellaneous information that will assist in solving the issue.]
- For each PVC we got following error message so we have increased the restic timeout at first to 6 hours and then to 12 hours but this doesn't solved the issue:
time="2020-05-15T00:02:55Z" level=info msg="1 errors encountered backup up item" backup=openshift-backup/cluster-20200514180050 group=v1 logSource="pkg/backup/resource_backupper.go:283" name=saml-service-provider-22-sgnh6 namespace= resource=pods
time="2020-05-15T00:02:55Z" level=error msg="Error backing up item" backup=openshift-backup/cluster-20200514180050 error="timed out waiting for all PodVolumeBackups to complete" error.file="/go/src/github.com/vmware-tanzu/velero/pkg/restic/backupper.go:172" error.function="github.com/vmware-tanzu/velero/pkg/restic.(*backupper).BackupPodVolumes" group=v1 logSource="pkg/backup/resource_backupper.go:287" name=saml-service-provider-22-sgnh6 namespace= resource=pods
velero restic repo get
NAME                                                    STATUS   LAST MAINTENANCE
div1-c4*                             Ready    2020-05-11 12:08:17 +0000 UTC
div1-cb*                     Ready    2020-05-08 12:08:48 +0000 UTC
div7-b*wb     Ready    2020-05-08 12:03:19 +0000 UTC
div7-b*bd     Ready    2020-05-08 12:08:52 +0000 UTC
div7-b*kb     Ready    2020-05-14 00:02:03 +0000 UTC
div7-b*jr     Ready    2020-05-08 12:08:10 +0000 UTC
div7-b*gv     Ready    2020-05-08 12:10:57 +0000 UTC
div7-b*h7     Ready    2020-05-08 12:08:22 +0000 UTC
div7-b*g2   Ready    2020-05-08 12:08:39 +0000 UTC
div7-b*rh   Ready    2020-05-08 12:11:12 +0000 UTC
div7-b*kv    Ready    2020-05-08 12:09:55 +0000 UTC
div7-b*5r    Ready    2020-05-12 13:06:58 +0000 UTC
div7-b*mz    Ready    2020-05-08 12:10:27 +0000 UTC
seed-g2*                           Ready    2020-05-08 12:10:47 +0000 UTC
oc describe sc block
Name:            block
IsDefaultClass:  No
Provisioner:           kubernetes.io/azure-disk
Parameters:            kind=Managed,storageaccounttype=Standard_LRS
AllowVolumeExpansion:  <unset>
MountOptions:          <none>
ReclaimPolicy:         Delete
VolumeBindingMode:     Immediate
Events:                <none>
oc describe sc file
Name:            file
IsDefaultClass:  Yes
Provisioner:           kubernetes.io/azure-file
Parameters:            storageAccount=azurefileb96695
AllowVolumeExpansion:  <unset>
MountOptions:
nouser_xattr
dir_mode=0777
file_mode=0777
uid=1000
gid=2000
ReclaimPolicy:      Delete
VolumeBindingMode:  Immediate
Events:             <none>
Environment:
- Velero version (use
velero version):
Client:
Version: v1.3.2
Git commit: 55a9914a3e4719fb1578529c45430a8c11c28145
Server:
Version: v1.3.2 - Velero features (use
velero client config get features):
features: - Kubernetes version (use
kubectl version):
oc v3.11.0+39132cb-398
kubernetes v1.11.0+d4cacc0 - Cloud provider or hardware configuration:
AZURE - OS (e.g. from
/etc/os-release):
NAME="CentOS Linux"
VERSION="7 (Core)"
Thanks for your help!
Regards
Tobias
 burkhat
All 29 comments
I wonder if you need to increase limits:
https://velero.io/docs/v1.4/customize-installation/#customize-resource-requests-and-limits
 carlisia
on 28 May 2020
carlisia
on 28 May 2020
Hello @carlisia,
we had following limit settings for velero and restic:
velero:
resources:
limits:
cpu: "2"
memory: 2Gi
requests:
cpu: "1"
memory: 512Mi
restic:
resources:
limits:
cpu: "2"
memory: 1Gi
requests:
cpu: 500m
memory: 512Mi
I've now increased the limits as follows:
velero:
resources:
limits:
cpu: "4"
memory: 4Gi
requests:
cpu: "1"
memory: 512Mi
restic:
resources:
limits:
cpu: "4"
memory: 4Gi
requests:
cpu: 500m
memory: 512Mi
I will update you next week if we still have the problems.
Thanks & Regards
Tobias
burkhat
on 29 May 2020
Hello @carlisia,
The increasing of the limts doesn't solves the issue.
The problem occurred again.
Regards
Tobias
burkhat
on 2 Jun 2020
Hello @carlisia,
Do you have any other ideas to fix this problem or to debug it?
Regards
Tobias
burkhat
on 8 Jun 2020
It looks like the PodVolumeBackups are staying in the New phase and not getting processed at all by the restic daemonset. I'm not sure why that would be happening after a few days of successful runs, as you're seeing.
To debug this further, it would be helpful to see the logs of the restic daemonset pods (you can get a list of all the daemonset pods via kubectl -n velero get pods -l name=restic and then get the logs for them).
Could you put the output in a Gist and link to it here? Just makes it easier to review the issue.
 skriss
on 9 Jun 2020
skriss
on 9 Jun 2020
@skriss I've now cleared all logs from the Pods and I'm now waiting until the error occurs again. I will send you the logs as soon as the error appears again.
burkhat
on 10 Jun 2020
@skriss at the moment it is still working fine I will update you at the end of this week
burkhat
on 16 Jun 2020
cc @vmware-tanzu/velero-maintainers
skriss
on 16 Jun 2020
@skriss yesterday the error appeared again, I've uploaded all logs from the restic pods to gist: https://gist.github.com/burkhat/8417c6351898250291209937853b4461
oc -n openshift-backup get pods -l name=restic -o wide
NAME READY STATUS RESTARTS AGE IP NODE NOMINATED NODE
restic-4mmzw 1/1 Running 0 9d 10.128.0.10 master-0
restic-5plcs 1/1 Running 0 9d 10.131.3.237 node-4
restic-8qm99 1/1 Running 0 9d 10.129.2.185 node-0
restic-8r7ll 1/1 Running 0 9d 10.129.7.5 node-5
restic-clsf5 1/1 Running 0 9d 10.129.1.32 master-1
restic-d87j5 1/1 Running 0 9d 10.130.7.40 node-8
restic-hqr24 1/1 Running 0 9d 10.131.1.204 node-7
restic-hsdrj 1/1 Running 0 9d 10.128.7.187 node-2
restic-jlwjd 1/1 Running 0 9d 10.131.5.82 node-3
restic-lxgzp 1/1 Running 0 9d 10.130.0.81 master-2
restic-p68cn 1/1 Running 0 9d 10.128.2.128 node-6
restic-qnw4h 1/1 Running 0 9d 10.129.5.124 infra-0
restic-qtbd2 1/1 Running 0 9d 10.130.5.221 infra-2
restic-zfmtp 1/1 Running 0 9d 10.128.5.148 node-1
restic-zx9dz 1/1 Running 0 9d 10.130.3.140 infra-1
burkhat
on 19 Jun 2020
I'm going to pass this off to someone else on @vmware-tanzu/velero-maintainers, but ping me if you need anything.
skriss
on 19 Jun 2020
Does anyone have updates to this issue?
burkhat
on 25 Jun 2020
@skriss Can you forward it again to your colleagues that someone have a look on it, please?
burkhat
on 7 Jul 2020
cc @vmware-tanzu/velero-maintainers
skriss
on 7 Jul 2020
@burkhat Thank you for your patience. I've added this to my list. Will take a look at it today.
 ashish-amarnath
on 7 Jul 2020
ashish-amarnath
on 7 Jul 2020
@burkhat Thank you for sharing these logs.
Unfortunately, I don't see anything stand out in the logs indicative of a problem here other than some podvolumebackups not being re-enqueued.
time="2020-06-19T05:23:17Z" level=debug msg="Backup is not new, not enqueuing" backup=openshift-backup/cluster-20200615120019 controller=pod-volume-backup logSource="pkg/controller/pod_volume_backup_controller.go:123" name=cluster-20200615120019-bk2wd namespace=openshift-backup
I wasn't able to correlate the timestamps on the backup logs on those from on the restic daemonset pods.
However, based on the fact that this is happening after a few days of successful runs, here are a few things to troubleshoot:
- What is the load on the nodes in your cluster?
kubectl describe node <nodeName> - Are you able to get metrics around the status of the nodes in your cluster when this happens and is there a correlation between the occurrence of the problem and the node status?
- Are there any nodes that are flip to
NotReady? - Are there any errors in the kublet logs of that node?
ashish-amarnath
on 8 Jul 2020
Hello @ashish-amarnath,
Thanks for your update, I will reply your questions:
- Load of the nodes:
_Resource Requests Limits
-------- -------- ------
cpu 2950m (36%) 4750m (59%)
cpu 3200m (40%) 8 (100%)
cpu 2600m (32%) 4800m (60%)
cpu 1550m (38%) 4800m (120%)
cpu 1350m (33%) 4600m (114%)
cpu 1100m (27%) 4200m (105%)
cpu 5070m (63%) 10760m (134%)
cpu 5244m (65%) 12080m (151%)
cpu 4680m (58%) 11410m (142%)
cpu 4590m (57%) 9750m (121%)
cpu 11560m (72%) 19310m (120%)
cpu 10900m (68%) 16990m (106%)
cpu 9290m (58%) 18250m (114%)
cpu 9280m (57%) 17540m (109%)
Resource Requests Limits
-------- -------- ------
memory 20524Mi (64%) 23588Mi (73%)
memory 19340Mi (60%) 25796Mi (80%)
memory 19328Mi (60%) 23754099200 (70%)
memory 2680Mi (16%) 6476Mi (40%)
memory 2580Mi (16%) 6376Mi (40%)
memory 2068Mi (12%) 5452Mi (34%)
memory 7154Mi (22%) 16598Mi (51%)
memory 15252Mi (47%) 22636Mi (70%)
memory 11638Mi (36%) 18342Mi (57%)
memory 6330745856 (18%) 15967032320 (47%)
memory 18598Mi (28%) 33514Mi (52%)
memory 26522Mi (41%) 46520Mi (72%)
memory 24900Mi (38%) 51232Mi (79%)
memory 17868Mi (27%) 34842Mi (54%)_
Yes we have some metrics about the nodes and the nodes are available during the backup and doesn't have any high cpu or memory load:
e.g. Last 7 days
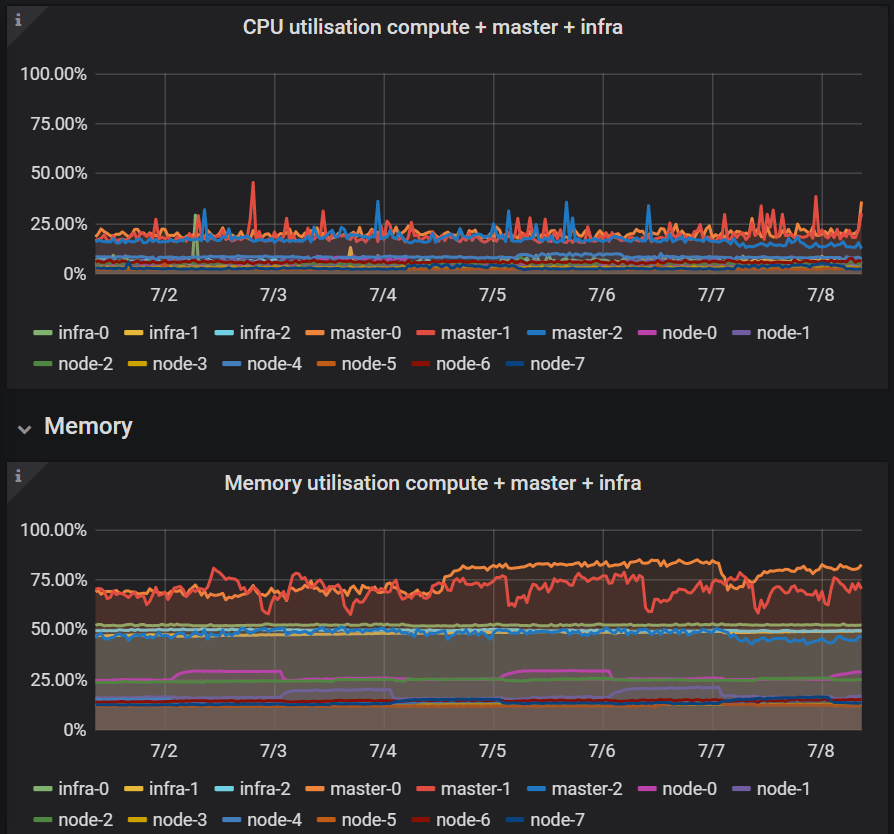
No all nodes are ready, we also have written an node-check which send us a message if a node is unavailable:
_NAME STATUS ROLES AGE VERSION INTERNAL-IP EXTERNAL-IP OS-IMAGE KERNEL-VERSION CONTAINER-RUNTIME
infra-0 Ready infra 263d v1.11.0+d4cacc0 100.66.41.149CentOS Linux 7 (Core) 3.10.0-1127.el7.x86_64 docker://1.13.1
infra-1 Ready infra 263d v1.11.0+d4cacc0 100.66.41.151CentOS Linux 7 (Core) 3.10.0-1127.el7.x86_64 docker://1.13.1
infra-2 Ready infra 263d v1.11.0+d4cacc0 100.66.41.150CentOS Linux 7 (Core) 3.10.0-1127.el7.x86_64 docker://1.13.1
master-0 Ready master 263d v1.11.0+d4cacc0 100.66.41.135CentOS Linux 7 (Core) 3.10.0-1127.el7.x86_64 docker://1.13.1
master-1 Ready master 263d v1.11.0+d4cacc0 100.66.41.134CentOS Linux 7 (Core) 3.10.0-1127.el7.x86_64 docker://1.13.1
master-2 Ready master 263d v1.11.0+d4cacc0 100.66.41.133CentOS Linux 7 (Core) 3.10.0-1127.el7.x86_64 docker://1.13.1
node-0 Ready compute 263d v1.11.0+d4cacc0 100.66.41.7CentOS Linux 7 (Core) 3.10.0-1127.el7.x86_64 docker://1.13.1
node-1 Ready compute 263d v1.11.0+d4cacc0 100.66.41.11CentOS Linux 7 (Core) 3.10.0-1127.el7.x86_64 docker://1.13.1
node-2 Ready compute 263d v1.11.0+d4cacc0 100.66.41.4CentOS Linux 7 (Core) 3.10.0-1127.el7.x86_64 docker://1.13.1
node-3 Ready compute 263d v1.11.0+d4cacc0 100.66.41.5CentOS Linux 7 (Core) 3.10.0-1127.el7.x86_64 docker://1.13.1
node-4 Ready compute 263d v1.11.0+d4cacc0 100.66.41.9CentOS Linux 7 (Core) 3.10.0-1127.el7.x86_64 docker://1.13.1
node-5 Ready compute 263d v1.11.0+d4cacc0 100.66.41.10CentOS Linux 7 (Core) 3.10.0-1127.el7.x86_64 docker://1.13.1
node-6 Ready compute 263d v1.11.0+d4cacc0 100.66.41.6CentOS Linux 7 (Core) 3.10.0-1127.el7.x86_64 docker://1.13.1
node-7 Ready compute 263d v1.11.0+d4cacc0 100.66.41.8CentOS Linux 7 (Core) 3.10.0-1127.el7.x86_64 docker://1.13.1_ I've looked in the journalctl log of a node for a pod which hangs in termination state:
_restic-hsdrj 1/1 Terminating 0 28d 10.128.7.187 node-2_
During the backup we only have following error in the log files of this node:
_Jul 08 05:59:52 node-2 origin-node[31893]: E0708 05:59:52.860968 31893 pod_workers.go:186] Error syncing pod 6d8825b9-afc3-11ea-b776-000d3a29bd7e ("-78-8fswj_(6d8825b9-afc3-11ea
Jul 08 05:59:52 node-2 origin-node[31893]: E0708 05:59:52.860942 31893 kubelet.go:1495] error killing pod: failed to "KillContainer" for "" with KillContainerError: "rpc error: code = Unknow_
_Jul 08 06:48:15 node-2 origin-node[31893]: W0708 06:48:15.273303 31893 status_manager.go:482] Failed to get status for pod "-78-8fswj*(6d8825b9-afc3-11ea-b776-000d3a29bd7e)": Ge
Jul 08 06:48:15 node-2 origin-node[31893]: E0708 06:48:15.273098 31893 kubelet_node_status.go:391] Error updating node status, will retry: error getting node "node-2": Get https://okd.c1.1eu1.apps-_
Regards
Tobias
burkhat
on 8 Jul 2020
@burkhat Thank you for sharing that info.
Your cluster definitely has load!
Looking at the kubelet logs, it seems like it had issues with updating its status momentarily
Jul 08 06:48:15 node-2 origin-node[31893]: E0708 06:48:15.273098 31893 kubelet_node_status.go:391] Error updating node status, will retry: error getting node "node-2": Get https://okd.c1.1eu1.apps-
This could have sent the node into being NotReady.
I know you said you get paged when a node become NotReady but, may be the node was in NotReady for a period lower than your alert threshold.
The node becoming NotReady could have relocated the application pod. That, however, would have failed the backup and not stalled and eventually timed out.
It is still not clear to me what might be happening and it had to remote debug such issue!
To narrow down the problem though, when this happens can you please
- Identify what node that pod is running on
kubectl get po -owide - Identify the restic daemonset pod that is running on that node.
kubectl -n velero get pods -l name=restic | grep <NODE_NAME> - Get the logs from that pod and the corresponding logs from the velero pod.
kubctl -n velero logs deploy/velero
I would like to see both the velero logs and the restic pod logs from the same time.
Further, I have some other questions:
- Can you also please tell us if this issue occur more often on some nodes more than others?
- Do you see any errors in the azure disk driver logs?
ashish-amarnath
on 8 Jul 2020
Hello @ashish-amarnath,
I've restarted all pods so I've to wait until the problem appears again, I will update you on Monday
Regards
Tobias
burkhat
on 10 Jul 2020
Hello @ashish-amarnath,
Sorry for my late reply but yesterday I had a lot to do.
I've collected all logs and then I've deleted all pods to find out which pod is in hanging state and can't be terminated:
restic-m576l 1/1 Terminating 0 6d 10.128.2.89 node-6
oc get pods -o wide
NAME READY STATUS RESTARTS AGE IP NODE NOMINATED NODE
restic-2blrj 1/1 Running 0 32s 10.130.3.188 infra-1
restic-2mzg5 1/1 Running 0 43s 10.131.4.141 node-3
restic-5h5d6 1/1 Running 0 42s 10.128.0.12 master-0
restic-7xgzg 1/1 Running 0 44s 10.130.5.227 infra-2
restic-8jwh7 1/1 Running 0 32s 10.128.4.246 node-1
restic-bn8ps 1/1 Running 0 35s 10.129.7.11 node-5
restic-fxqbp 1/1 Running 0 37s 10.129.5.138 infra-0
restic-ggwnc 1/1 Running 0 31s 10.129.1.47 master-1
restic-m576l 1/1 Terminating 0 6d 10.128.2.89 node-6
restic-m95w5 1/1 Running 0 38s 10.131.0.201 node-7
restic-q5bhp 1/1 Running 0 35s 10.128.7.104 node-2
restic-rbtww 1/1 Running 0 39s 10.129.2.69 node-0
restic-sxq4j 1/1 Running 0 42s 10.130.0.110 master-2
restic-zrvjz 1/1 Running 0 38s 10.131.3.97 node-4
velero-6b6cbdb75f-svhvf 1/1 Running 0 44s 10.131.0.200 node-7
I've uploaded the logs of velero-6b6cbdb75f-svhvf and restic-m576l to gist.
Also I've collected the origin-node.service logs from node-6 and grepped for azure.
In the master-controller-log I also found an entry to azure-file but this issue was fixed by me today morning.
https://gist.github.com/burkhat/015271e29bf569024a1e00ba212d8e2e
The issue can occur on every worker-node (node-*) I can't see if it happens on some node more than on others.
Regards
Tobias
burkhat
on 14 Jul 2020
@burkhat Thanks for sending that over. I'll take a look at this today
ashish-amarnath
on 14 Jul 2020
@burkhat Thanks for sharing those logs.
Based on what I saw in the logs, here is what I think might be happening.
It seems like backups are being triggered at a constant frequency, as though on a schedule.
It also appears like a previous backup is running while a new one is being created. This means that the restic pod volume backup controller for the new backup is not picked up until the previous backup is reconciled. This eats into the timeout period of the new backup, and eventually causing it to timeout.
This also explains why we saw the PodVolumeBackups stay in New phase for a long time.
Now coming to the fact that, we don't run into this issue initially, but we see a rise in the frequency of this issue happening as time passes could be because, initially the backups might be able to make quicker progress, but with time and load, the restic backup process might slow down, causing the pending backup list to grow. Once the backup list grows beyond a certain threshold, all the backups might time out.
This is my hypothesis. Few things to try out is, make the backup schedule less aggressive, to see if this problem goes away, or decreases.
As far as Velero is concerned, I think we will benefit from surfacing latency metrics for restic commands.
ashish-amarnath
on 16 Jul 2020
Hello @ashish-amarnath,
Thanks for your reply so at the moment I schedule the backup at 6 am, 12 pm and 18 pm.
I will change the schedule to only schedule the backup at 6 am.
I will update you if the issue appears again or not, I will you not later than next Friday 24-07-20.
Regards
Tobias
burkhat
on 16 Jul 2020
Hello @ashish-amarnath,
I've changed the schedule on Thursday 16-07-2020 to schedule the backup at 6 am.
On Friday 17-07-2020 we get the same error again:
"Name: cluster-20200717060037
Namespace: openshift-backup
Labels: velero.io/schedule-name=cluster
velero.io/storage-location=default
Annotations:
Phase: PartiallyFailed (run velero backup logs cluster-20200717060037 for more information)
Errors: 50
Warnings: 0
Namespaces:
Included: *
Excluded: openshift-logging, openshift-monitoring, openshift-backup, cocdit-opendistro, lens-metrics, monitoring
Resources:
Included: *
Excluded: storageclasses.storage.k8s.io, groups.user.openshift.io, identities.user.openshift.io, useridentitymappings.user.openshift.io, users.user.openshift.io, images.image.openshift.io
Cluster-scoped: included
Label selector:
Storage Location: default
Snapshot PVs: false
TTL: 720h0m0s
Hooks:
Backup Format Version: 1
Started: 2020-07-17 06:00:37 +0000 UTC
Completed: 2020-07-17 07:01:31 +0000 UTC
Expiration: 2020-08-16 06:00:37 +0000 UTC
Persistent Volumes:
Restic Backups (specify --details for more information):
Completed: 20
Failed: 3
In Progress: 3
New: 11"
Regards
Tobias
burkhat
on 21 Jul 2020
@burkhat I am not entirely sure what is going on here.
I would suggest comparing the cluster where this is working as expected and the one where it is not.
A few things to consider in the comparison:
- Are the workloads being backed up the same: double check that the inclusion and exclusion namespaces and resources are the same.
- Are the sizes of the volumes, that are being backed up using restic, the same?
- Are the cluster comparable: in-terms of number of nodes, kinds of the nodes, load on the cluster.
This ensures that the comparison is between identical cluster.
We've also added some metrics into to help us get more information into what might be going on in this case. https://github.com/vmware-tanzu/velero/pull/2719 This PR was merged and should be available in the 1.5 release, eta Aug 2020.
ashish-amarnath
on 22 Jul 2020
@ashish-amarnath
We've now the problem that we have deleted the cluster where it is working because we don't use it at the moment, but I can tell you the differences.
- Yes we use for every cluster the same schedule:
"# Please edit the object below. Lines beginning with a '#' will be ignored,
# and an empty file will abort the edit. If an error occurs while saving this file will be
# reopened with the relevant failures.
#
apiVersion: velero.io/v1
kind: Schedule
metadata:
  creationTimestamp: "2020-01-16T07:05:45Z"
  generation: 1
  name: cluster
  namespace: openshift-backup
  resourceVersion: "116874225"
  selfLink: /apis/velero.io/v1/namespaces/openshift-backup/schedules/cluster
  uid: 9d852cb6-382e-11ea-9ab3-000d3a29b151
spec:
  schedule: 0 6 * * *
  template:
    excludedNamespaces:
    - openshift-logging
    - openshift-monitoring
    - openshift-backup
    - cocdit-opendistro
    - lens-metrics
    - monitoring
    excludedResources:
    - storageclasses.storage.k8s.io
    - groups.user.openshift.io
    - identities.user.openshift.io
    - useridentitymappings.user.openshift.io
    - users.user.openshift.io
    - images.image.openshift.io
    includeClusterResources: true
    includedNamespaces:
    - '*'
    includedResources:
    - '*'
    snapshotVolumes: false
    storageLocation: default
    ttl: 720h
status:
  lastBackup: "2020-07-23T06:00:40Z"
  phase: Enabled"
The sizes were different on the two cluster.
On the cluster which was deleted the biggest size of a pv was 10 GB. Also we had only round about 15 pvs on the cluster in 3 namespaces.
On the cluster with the problem the biggest pv is 200 GB. All other pvs are 1 GB, 5 GB or 10 GB and we have 60 pvs to backup in 15 namespaces.On the cluster which was deleted we had 3 master-, 3 infra- and 3 worker-nodes.
On the cluster with the problem we had 3 master-, 3 infra- and 7 worker-nodes.
The size of the nodes were the same on both clusters.
Thanks for the information, so will update in August to 1.5 asap.
burkhat
on 23 Jul 2020
@ashish-amarnath
Just for your information I'm on vacation from 01.08. - 17.08.20.
If you need some logfiles or information to this issue my colleagues @Mr-iX and @philipp1992 can help you.
Regards
Tobias
burkhat
on 29 Jul 2020
@ashish-amarnath
We've now deployed velero version 1.5.1 on our cluster and now we will have a look if the error appears again.
I will update you next week
burkhat
on 2 Oct 2020
Revisiting this, I think I agree with @ashish-amarnath's hypothesis that some restic job is still running and overwhelms the timeout. But also, this really highlights a need to have better logging and easier surfacing of that logging for restic.
Still, based on the limits of 4 CPU/4Gi each for restic and Velero, the increased timeout, and daily schedules, I would think that the restic operations would finish faster unless the cluster is super busy.
@burkhat Have you observed this issue again? Does it continue to happen?
 nrb
on 22 Oct 2020
nrb
on 22 Oct 2020
Sorry I've forgotten to reply again.
The issue doesn't appear again you can close this issue.
Thanks for your help
burkhat
on 22 Oct 2020
Related issues
 ncdc
·
29Comments
ncdc
·
29Comments
 jhamilton1
·
26Comments
jhamilton1
·
26Comments
 zeieri
·
29Comments
zeieri
·
29Comments
 thdrnsdk
·
23Comments
skriss
·
26Comments
thdrnsdk
·
23Comments
skriss
·
26Comments
Most helpful comment
@ashish-amarnath
Just for your information I'm on vacation from 01.08. - 17.08.20.
If you need some logfiles or information to this issue my colleagues @Mr-iX and @philipp1992 can help you.
Regards
Tobias