Velero: Create example Grafana dashboard
Once Ark has exposed prometheus metrics (#84 / #531), it would be great if we had an example Grafana dashboard for visualizing the state of Ark.
In the simplest form, this could be checked into the Ark repo. It could also be published to the Grafana dashboard community (https://grafana.com/dashboards).
Variables:
- Backup Name
- Schedule Name
Potential end-user graphs:
- Gauge showing number of active backups
- Gauge showing number of active restores
- Backup success rate (completions / attempts) over time
- Restore success rate (completions / attempts) over time
- Rate of backups over time
- Rate of restores over time
- {99, 95, 50}% duration for Restores over time
- {99, 95, 50}% duration for Backups over time
- {99, 95, 50} percentiles of backup byte size over time
- {99, 95, 50} percentiles of restore byte size over time
 rosskukulinski
All 14 comments
@ashish-amarnath if you're working on #531 and find yourself creating a grafana dashboard to test with, here's an initial take at what some useful graphs might be.
rosskukulinski
on 8 Jun 2018
Good idea!
 ashish-amarnath
on 8 Jun 2018
ashish-amarnath
on 8 Jun 2018
Hi! Does a Grafana dashboard for Velero/Ark exist yet? I managed to have Prometheus operator scrape the Velero metrics but I don't know how to use them. Thanks
 vitobotta
on 18 May 2019
vitobotta
on 18 May 2019
@vitobotta we don't have a sample one, but maybe another user has something they can share.
 skriss
on 20 May 2019
skriss
on 20 May 2019
see also #1136
 bryanlarsen
on 11 Jul 2019
bryanlarsen
on 11 Jul 2019
bryanlarsen
on 11 Jul 2019
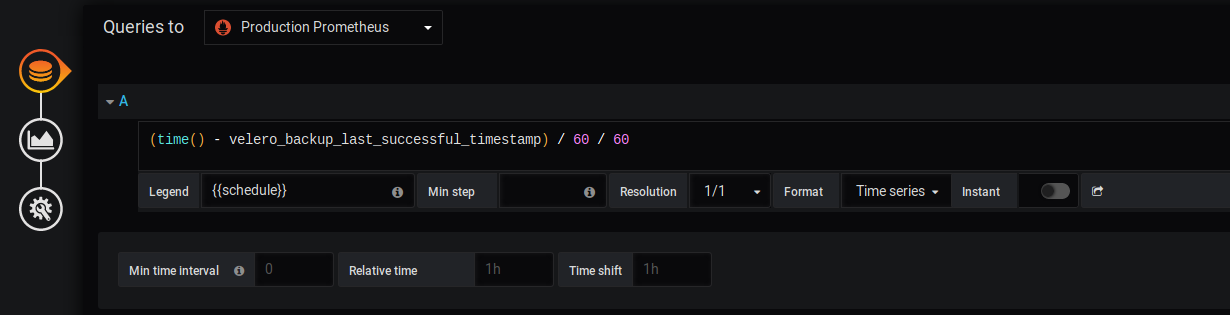
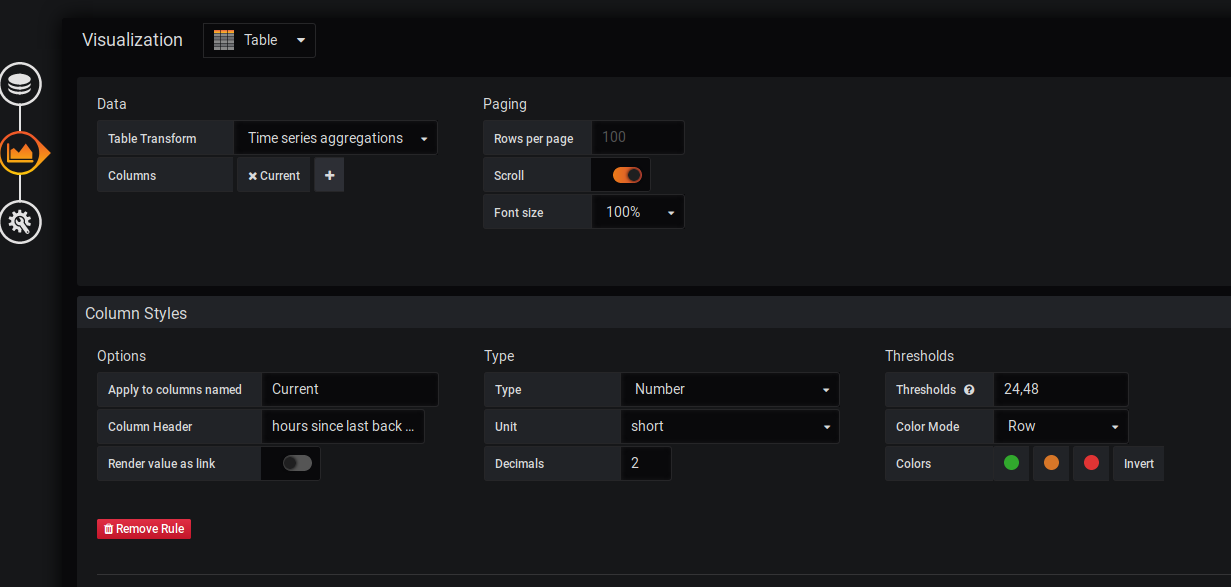
Hi i created a velero dashboard but the following metrics are missing:
velero_restore_duration_seconds_bucket
velero_restore_tarball_size_bytes
Maybe it will be useful as blueprint. Any suggestions are welcome.
https://gist.github.com/HaveFun83/57b41e85fde4249daab74a9850885f6a#file-kubernetes-_-addons-_-velero-stats-1568113703354-json
 HaveFun83
on 10 Sep 2019
HaveFun83
on 10 Sep 2019
Hi i created a velero dashboard but the following metrics are missing:
velero_restore_duration_seconds_bucket
velero_restore_tarball_size_bytesMaybe it will be useful as blueprint. Any suggestions are welcome.
https://gist.github.com/HaveFun83/57b41e85fde4249daab74a9850885f6a#file-kubernetes-_-addons-_-velero-stats-1568113703354-json
Hi @HaveFun83 , thanks for a dashboard!
I see you calculate 'Active backup' with sum(rate(velero_backup_attempt_total[15m])) / sum(rate(velero_backup_success_total[15m]))
May I kindly ask you to spread some light on that? Thanks in advnace!
 CarpathianUA
on 10 Sep 2019
CarpathianUA
on 10 Sep 2019
Hi i created a velero dashboard but the following metrics are missing:
velero_restore_duration_seconds_bucket
velero_restore_tarball_size_bytes
Maybe it will be useful as blueprint. Any suggestions are welcome.
https://gist.github.com/HaveFun83/57b41e85fde4249daab74a9850885f6a#file-kubernetes-_-addons-_-velero-stats-1568113703354-jsonHi @HaveFun83 , thanks for a dashboard!
I see you calculate 'Active backup' withsum(rate(velero_backup_attempt_total[15m])) / sum(rate(velero_backup_success_total[15m]))
May I kindly ask you to spread some light on that? Thanks in advnace!
the graph should represent @rosskukulinski suggestion:
Gauge showing number of active backups
But you are right this expression makes no sense i changed it but currently only active scheduled backups will be count
HaveFun83
on 11 Sep 2019
Hi @HaveFun83 ! Thanks for the dashboard, very useful. What is "Backup Time"? I thought it's the duration but it only shows a flat bar on the zero for me. Also, what does "Backup Success" show in case there are failed backups? Thanks!
vitobotta
on 5 Dec 2019
Hi @HaveFun83 ! Thanks for the dashboard, very useful. What is "Backup Time"? I thought it's the duration but it only shows a flat bar on the zero for me. Also, what does "Backup Success" show in case there are failed backups? Thanks!
Backup Time shows the "velero_backup_duration_seconds_bucket" metric can you check your Prometheus if there is any data available?
Backup Success rate must be 1 if its below something is wrong.
Failed backups should be visible in "Backup Total Count"
HaveFun83
on 7 Dec 2019
@mtritabaugh You can work on this if you would like. I am not finding a way to assign this to you either :)
ashish-amarnath
on 4 Aug 2020
@nrb @ashish-amarnath Please assign this to me, thank you.
 mtritabaugh
on 4 Aug 2020
mtritabaugh
on 4 Aug 2020
Hello @mtritabaugh, thanks for working on this topic !!
May I ask you if everything goes well ?
if you already have a draft, I would be glad to test it !
 link-webcreations
on 21 Oct 2020
link-webcreations
on 21 Oct 2020
Related issues
 gkdba87
·
28Comments
gkdba87
·
28Comments
 ncdc
·
27Comments
ncdc
·
34Comments
ncdc
·
133Comments
ncdc
·
27Comments
ncdc
·
34Comments
ncdc
·
133Comments
 immesys
·
28Comments
immesys
·
28Comments
Most helpful comment
Hi i created a velero dashboard but the following metrics are missing:
velero_restore_duration_seconds_bucket
velero_restore_tarball_size_bytes
Maybe it will be useful as blueprint. Any suggestions are welcome.
https://gist.github.com/HaveFun83/57b41e85fde4249daab74a9850885f6a#file-kubernetes-_-addons-_-velero-stats-1568113703354-json