Follow previous conversation to support jittering/dodge in #396, I'm creating this new issue to propose that x/yOffset channel is the solution.
(The old issue is getting too long).
Here are a few demonstrative use cases:
Grouped Bar

To replicate a group bar chart like this one in Vega (ignoring the text for now), the syntax should be the following:
{
  data: ..., // same as the vega example
  mark: 'bar',
  encoding: {
     x: {field: "value", type: "quantitative"},
     y: {field: "category", type: "nominal"},
     yOffset: {field: "position", type: "nominal"},
     color: {field: "position", type: "nominal"}
  }
}
Basically yOffset can have its own scale _without_ an axis. The scale will be a band scale by default for nominal.
This is better than allowing row/column to have axis as the row and column encoding should only have header as its guide. This way, the types for all channels (row/column, x/y, x/yOffset) have consistent types.
To determine the default range for y and yOffset, yOffset could just use the default rangeStep. When there is yOffset encoding, y-encoding then uses a formula to calculate its rangeStep from yOffset's padding, cardinality, and rangeStep.
Users can still override one or both of the scale's range.
Jittering
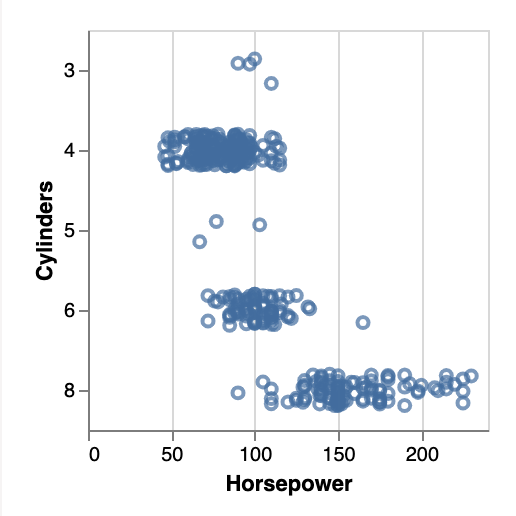
With this offset channel, we can do jittering using the following spec.
{
  "data": {"url": "data/cars.json"},
  "transform": [{calculate: "random()", as: "random"}],
  "mark": "point",
  "encoding": {
    "x": {"field": "Horsepower", "type": "quantitative"},
    "y": {"field": "Cylinders", "type": "ordinal"},
    "yOffset": {"field": "random", "type": "quantitative"}
  }
}
The range of yOffset linear scale should be within the boundary of the y-scale's rangeStep. For example, we could do [- (1 - yPaddingInner) * rangeStep / 2, (1 - yPaddingInner) * rangeStep / 2] (simply +/- (1 - yPaddingInner) * rangeStep / 2) by default.
We can later add syntactic sugar / macro to make jitter even more convenient, but this should demonstrate that offset is a general building blocks.
A macro could be just as simple as "yOffset": {"random": true} (which I think is more straightforward for readers than adding a jargon like "jitter").
In any case, the first PR would focus on the xOffset/yOffset channel first, a macro can come later.
Conditional Offset for Bar Labeling
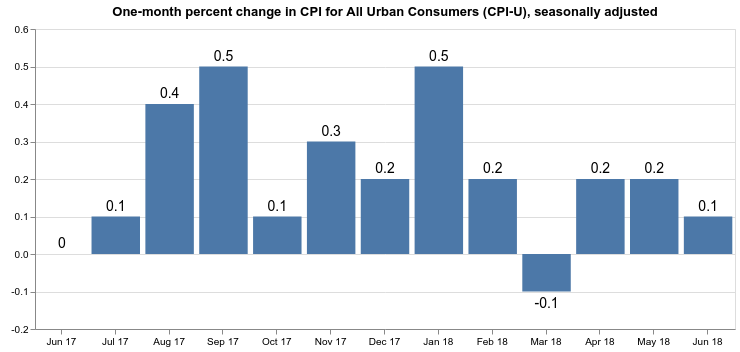
{
  data: ...,
  encoding: {
     x: ...
     y: ...
  },
  layer: [
    {mark: 'bar'}
    {
      mark: 'text',
      encoding: {
        yOffset: {
          condition: {
            test: {field: "y_field", gte: 0},
            value: 10
          },
          value: -10
        },
        text: ...
      }
    }
  ]
}
Nudge
In #396, we also discuss about nudge.
However, we already have xOffset/yOffset as mark definition properties. So nudge is already supported. See https://vega.github.io/vega-lite/docs/mark.html#offset.
cc: @domoritz @jheer @arvind -- let me know what you think.
Grouped bar is a very common chart that we don't do well. I want to provide better support for it.
 kanitw
All 11 comments
Thanks for starting this! I’ll think more about this design. What you describe with labels above is already supported (in Vega, not Vega-Lite) using the dx and dy channels, do that might be an alternative naming scheme.
 jheer
on 10 Mar 2019
jheer
on 10 Mar 2019
FYI, we intentionally name them xOffset and yOffset rather than dx / dy because dx and dy for text in Vega shift text on a rotated plane. For example, I duplicate text and set angle = 45, dx=5 in this Vega plot:
We want this xOffset/yOffset to be always parallel to x/y. With this setup, users can shift text along the original xy-plane with xOffset/yOffset and along the rotated plane with dx/dy.
Plus, we can simply use offset in Vega like this:
// Vega output
x: {scale: 'x', field: ..., offset: {scale: 'xOffset', field: ...}}
Note that, unlike Vega, xOffset shouldn't be an offset property in the Vega-Lite x channel as it's breaking the encoding structure in VL---namely that one channel should have one field (see https://github.com/vega/vega-lite/issues/396#issuecomment-362867869).
kanitw
on 10 Mar 2019
The proposed specification for grouped bar looks perfect! Is the intention to have other marks also support x/yOffset? I assume so, as that would make it very easy to support the bar+label example from Vega, right?
 eibanez
on 14 Jul 2020
eibanez
on 14 Jul 2020
Yes, that's the plan.
 domoritz
on 14 Jul 2020
domoritz
on 14 Jul 2020
I'd love to see this feature, I was just trying to jitter some errorbars for a plot, and I think for now it is back to ggplot2 ;) The proposal here seems perfect for the use-case I'm trying to solve right now.
 davidanthoff
on 3 Aug 2020
davidanthoff
on 3 Aug 2020
We need to bribe @kanitw to finish https://github.com/vega/vega-lite/pull/4969 ;-)
domoritz
on 4 Aug 2020
How can he be bribed? I'm all ears :)
davidanthoff
on 4 Aug 2020
I am also really looking forward to this feature being available in vega-lite and altair as it will make it much easier for me to use these libraries for teaching. Thank you for working on it @kanitw !
 joelostblom
on 4 Aug 2020
joelostblom
on 4 Aug 2020
If anyone comes across this issue looking for a temporary fix while this issue is still outstanding, here's the closest thing I was able to do riffing on the "grouped bar chart" example^:
import altair as alt
from vega_datasets import data

source = data.barley()

alt.Chart(source).mark_bar().encode(
    alt.X('year:O', axis=None),
    alt.Y('sum(yield):Q', axis=alt.Axis(grid=True)),
    alt.Facet('site:N',title="Facet title Here",),
    color='year:N',
).properties(height=150, width=80).configure_view(
    stroke='transparent'
).configure_scale(bandPaddingInner=0,
                  bandPaddingOuter=0.1,
).configure_header(labelOrient='bottom',
                   labelPadding = 3).configure_facet(spacing=5
)
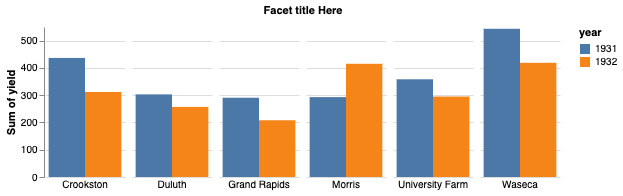
Other than the break in the x-axis (which I'm sure some enterprising Altair expert can tweak that so the gap is 0 and it looks like a single x-axis) this at least, accomplishes one of the goals.
^ Mostly, I didn't want to just comment to add a +1 comment on this issue as I too, am waiting for this as I intend to teach Altair again to my students this year.
 firasm
on 6 Oct 2020
firasm
on 6 Oct 2020
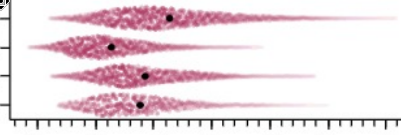
For the jittering implementation, could it be made flexible to support jittering within the extent of a KDE in addition to a uniform distribution? This would allow to make density/violin point/scatter plots which are both very informative and solve many of the issues with violin, swarm, and stripplots.
joelostblom
on 4 Feb 2021
I wrote a function that fixues up the breaks on the axis by manipulating the svg dom. It could be a starting point if someone needs to do something similar:
https://github.com/NBISweden/encam/blob/cdb5bf695f8498c14aa7280a476096faa99b7951/frontend/src/Vega/EmbedInner.tsx#L59-L113
 danr
on 5 Feb 2021
danr
on 5 Feb 2021
Related issues
 swanderz
·
4Comments
swanderz
·
4Comments
 mcnuttandrew
·
3Comments
kanitw
·
4Comments
mcnuttandrew
·
3Comments
kanitw
·
4Comments
 fuglede
·
4Comments
fuglede
·
4Comments
 mcadams92
·
3Comments
mcadams92
·
3Comments
Most helpful comment
FYI, we intentionally name them
xOffsetandyOffsetrather thandx/dybecausedxanddyfor text in Vega shift text on a rotated plane. For example, I duplicate text and set angle = 45, dx=5 in this Vega plot:We want this xOffset/yOffset to be always parallel to x/y. With this setup, users can shift text along the original xy-plane with xOffset/yOffset and along the rotated plane with dx/dy.
Plus, we can simply use
offsetin Vega like this:Note that, unlike Vega,
xOffsetshouldn't be anoffsetproperty in the Vega-Litexchannel as it's breaking the encoding structure in VL---namely that one channel should have one field (see https://github.com/vega/vega-lite/issues/396#issuecomment-362867869).