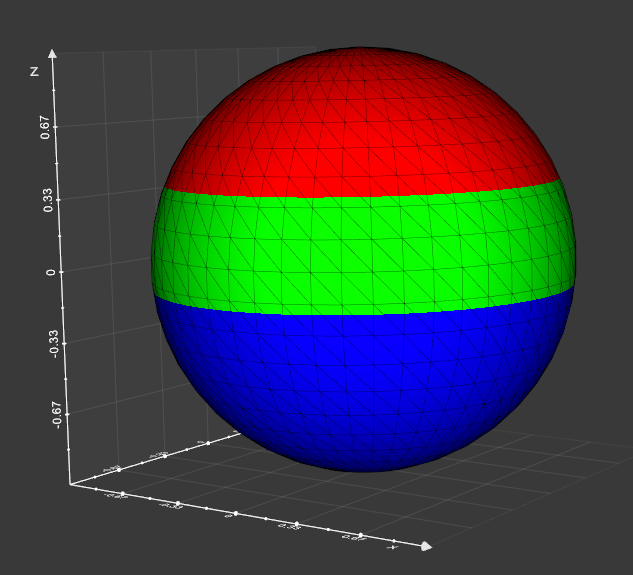
Hi Marco, i have been trying to visualize a mesh segmentation. That is: vertices with y-coordinate bellow y_n get a color/class c_1, vertices with y-coordinate between y_n and y_m get a color c_2, and so forth but no success. The "bands" feature does not work because the intervals have the same length.
Is there a way to accomplish this?
help wanted
 neoglez
All 2 comments
You can use cellColors() this way:
from vtkplotter import Sphere, settings
# settings.useDepthPeeling=True # not necessary if alpha=1

sv = Sphere().lw(0.1)

cols, alphas = [], []
for p in sv.cellCenters():
    if        p[2]>0.3:
        cols.append([1,0,0]) #rgb
    elif -0.2<p[2]<0.3:
        cols.append([0,1,0])
    else:
        cols.append([0,0,1])
    alphas.append(1)

sv.cellColors(cols, alpha=alphas, mode='colors')
sv.mapCellsToPoints() #optional
sv.show(axes=1, viewup='z')
 marcomusy
on 25 Sep 2019
marcomusy
on 25 Sep 2019
Thanks! You saved my day!

neoglez
on 25 Sep 2019
🎉1
👍1
Was this page helpful?
0 / 5 - 0 ratings
Related issues
 MarkusRosen
·
5Comments
MarkusRosen
·
5Comments
 vigji
·
3Comments
vigji
·
3Comments
 FedeClaudi
·
6Comments
FedeClaudi
·
6Comments
 drew-parsons
·
7Comments
drew-parsons
·
7Comments
 m-albert
·
7Comments
m-albert
·
7Comments
Most helpful comment
Thanks! You saved my day!
