Vector: Datadog logs sink not sending data after some time/high traffic
Vector Version
Sep 16 10:53:02 ip-172-18-152-185 vector[9617]: Sep 16 10:53:02.215 INFO vector: Vector is starting. version="0.10.0" git_version="v0.9.0-377-g0f0311a" released="Wed, 22 Jul 2020 19:45:24 +0000" arch="x86_64"
Vector Configuration File
[sinks.datadog_logs_nginx]
  # General
  type = "datadog_logs" # required
  inputs = ["nginx-access","nginx-error"] # required
  api_key = "${DATADOG_API_KEY}" # required
  endpoint = "intake.logs.datadoghq.com:10516" # optional, default
  healthcheck = true # optional, default

  # Buffer
  buffer.type = "memory" # memory/disk optional, default
  buffer.max_events = 500 # optional, default, events, relevant when type = "memory"
  #buffer.max_size = 573741824 # required, bytes, required when type = "disk"
  buffer.when_full = "block" # optional, default

  # Encoding
  encoding.codec = "json" # required
  encoding.except_fields = [] # optional, no default
  encoding.timestamp_format = "rfc3339" # optional, default

  tls.enabled = true
  tls.verify_certificate = true # optional, default
  tls.verify_hostname = true # optional, default
Debug Output
Sep 16 10:25:34 ip-172-18-152-185 vector[10681]: Sep 16 10:25:34.938 ERROR connection{host=intake.logs.datadoghq.com port=10516}: vector::internal_events::tcp: connection disconnected. error=Connection reset by peer (os error 104)
but sometimes this is not visible and traffic not going to Datadog logs
Expected Behavior
Send logs in a high throughput stream without any interruptions. Any reconnects or Datadog connection issues that are possible from the Dataddog side should be handled.
Actual Behavior
This is not confirmed in 100%, but with hight traffic, we see that with Datadog logs sink sometimes silently stop sending data. sometimes there is disconnected, sometimes not, and still no logs visible. After vector restart, all start working like before. This issue connected with higher traffic is visible on our side like in less than 24h and every day we have such issues with random hosts - we see black holes in stats from logs.
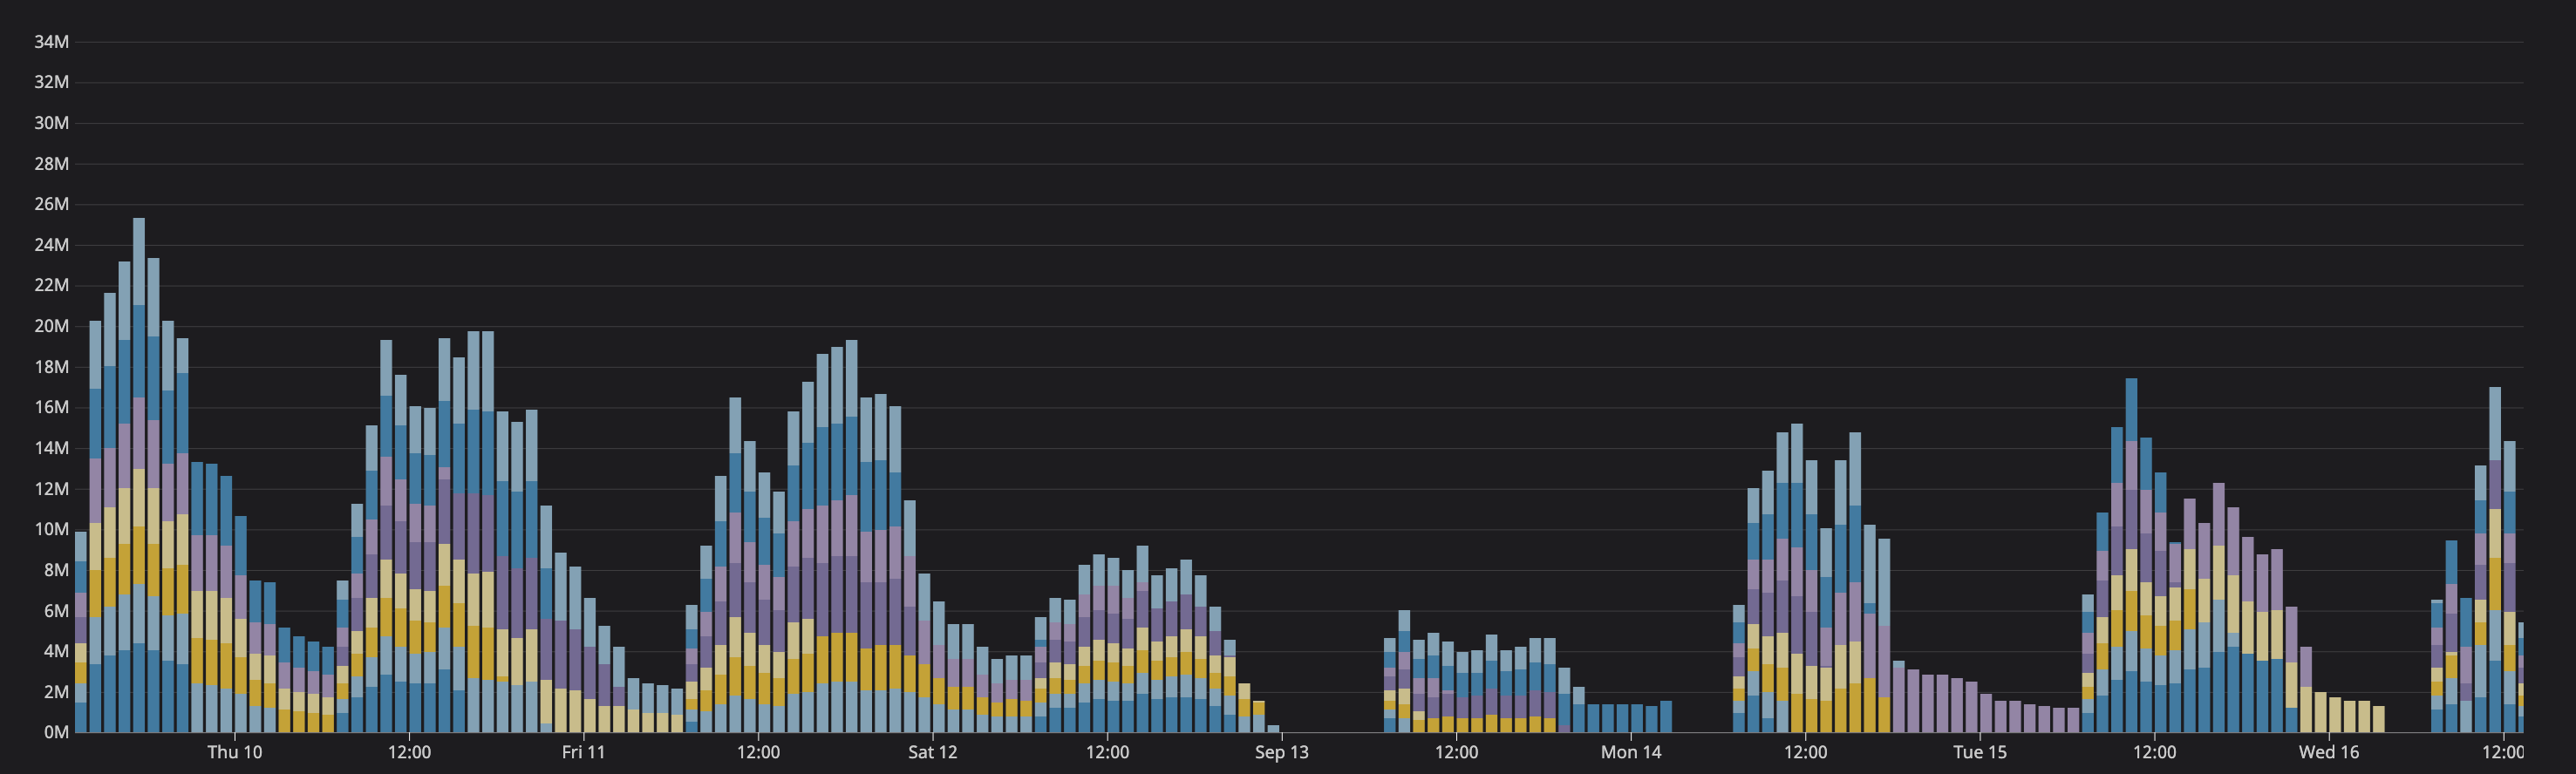
Stats from the internal of vector suggest no reconnects and we see that. all metrics reporting as established.
 szibis
All 14 comments
Thanks for reporting @szibis, we're investigating now.
 binarylogic
on 16 Sep 2020
binarylogic
on 16 Sep 2020
It will take a day or two of running for my setup to reach the point where this is expected to be reproducible, so in the meantime we can speed this up, @szibis there are couple of things I'm interested in:
- All warnings and all error messages.
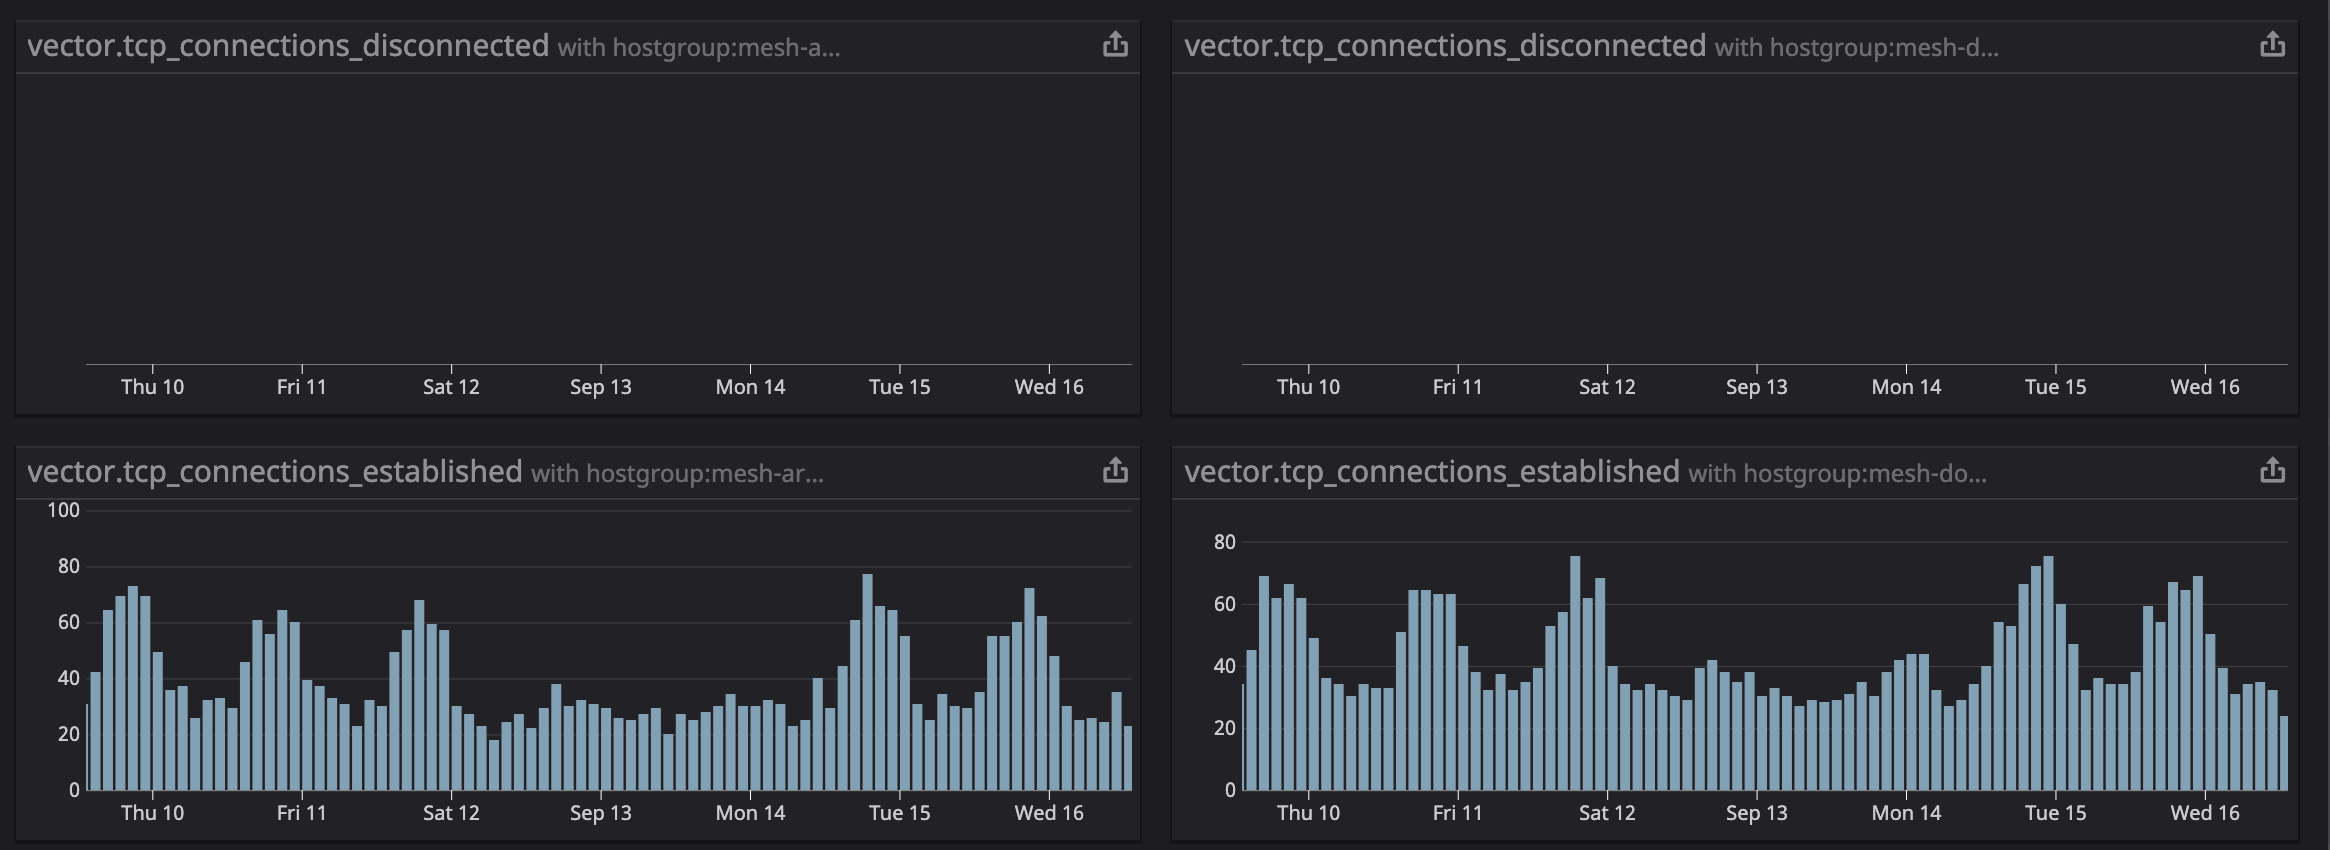
- Metrics:
tcp_connections_failedtcp_connection_shutdowntcp_connection_errorstcp_flush_errorstcp_connections_disconnectedbytes_processed
- Check if amount of events sent into the sink matches amount that is sent out of it. Although I'm not sure this can be checked with that version of vector.
- What is the OS this is running on. More specifically I'm interested in the congestion control algorithm that the
tcp+tlsimplementation of the protocol is using. - Graph of number of events emitted for all sources whose events end in this sink. Although I'm not sure this is available with that version of vector.
for the same period of time for this sink. For a section, like the one on the image, covering a single dip is enough

Also, could you draw on that graph what is the expected amount of events sent. Is it a line? does it have hills, or valleys?
My current idea is that something is throttling the pipeline/connection on a 1 day period. Be it datadog server, internet connection, something in our sinks, or even something before it. In datadog_sink the only thing that can do this is tcp protocol backing off, but it shouldn't be able to reach such long duration. So @szibis, can you check that your network isn't saturated from the start and during the dips?
Reseting the vector resets the connections, buffers, and everything before it so that narrows it down a bit. So what is the pipeline in vector before the sink? Just the diagram of components connected to the sink is enough.
 ktff
on 17 Sep 2020
ktff
on 17 Sep 2020
Thanks for your investigation. We are working on a few things right now:
- We will compare some vector metrics that we are collecting and. maybe even switch to nightly on one node to see more metrics from components.
- Checking if this is not caused by source of metrics, before Vector
- Adding Datadog private links which should improve latency and maybe improve on that problems
- More tune to some OS/Kernel settings as traffic spikes start to be bigger
I need to eliminate all parts that are before and after Vector to be sure that this issue is 100% Vector issue.
I will let you know when all will be deployed and we will know after some time if this helps or not.
szibis
on 18 Sep 2020
This is an additional capture of issue - date in UTC but local time on our side +200
Sep 18 08:07:47 ip-172-18-131-41 vector[17138]: Sep 18 08:07:47.158 ERROR connection{host=intake.logs.datadoghq.com port=10516}: vector::internal_events::tcp: connection disconnected. error=Connection reset by peer (os error 104)
Topology:
[sources.internal_metrics]
  type = "internal_metrics"

[transforms.tags_internal_metrics]
  # General
  type = "add_tags" # required
  inputs = ["internal_metrics"] # required

[sources.syslog_nginx_access]
  # General
  type = "syslog" # required

[sources.syslog_nginx_error]
  # General
  type = "syslog" # required

[sources.syslog_mxx]
  # General
  type = "syslog" # required

[transforms.nginx_json_parse]
  type = "json_parser" # required
  inputs = ["syslog_nginx_access"] # required

[transforms.nginx_json_parse_message]
  type = "json_parser" # required
  inputs = ["nginx_json_parse"] # required

[transforms.ec2_metadata_nginx_access]
  type = "aws_ec2_metadata" # required
  inputs = ["nginx_json_parse_message"] # required

[transforms.ec2_metadata_nginx_error]
  type = "aws_ec2_metadata" # required
  inputs = ["syslog_nginx_error"] # required

[transforms.nginx_error_remove_fields]
  type = "remove_fields" # required
  inputs = ["ec2_metadata_nginx_error"] # required

[transforms.nginx_error_add_fields]
  # General
  type = "add_fields" # required
  inputs = ["nginx_error_remove_fields"] # required

[transforms.nginx-error]
  # General
  type = "rename_fields" # required
  inputs = ["nginx_error_add_fields"] # required

[transforms.nginx_access_split_statuss_1]
  type = "split" # required
  inputs = ["ec2_metadata_nginx_access"] # required

[transforms.nginx_access_split_status]
  type = "split" # required
  inputs = ["nginx_access_split_statuss_1"] # required

[transforms.nginx_access_remove_fields]
  type = "remove_fields" # required
  inputs = ["nginx_access_split_status"] # required

[transforms.nginx_add_fields]
  # General
  type = "add_fields" # required
  inputs = ["nginx_access_remove_fields"] # required

[transforms.nginx-access]
  # General
  type = "rename_fields" # required
  inputs = ["nginx_add_fields"] # required

[transforms.mxx_parse_message]
  type = "json_parser" # required
  inputs = ["syslog_mxx"] # required

[transforms.mxx_parse_msg]
  type = "json_parser" # requireda
  inputs = ["mxx_parse_message"] # required

[transforms.mxx_parse]
  type = "json_parser" # requireda
  inputs = ["mxx_parse_msg"] # required

[transforms.mxx_events_routing]
  type = "swimlanes"
  inputs = ["mxx_parse"]

  [transforms.mxx_events_routing.lanes.event_with_backend_state]
  [transforms.mxx_events_routing.lanes.event_with_private_service]
  [transforms.mxx_events_routing.lanes.event_with_public_service]

[transforms.mxx_service_parse_private]
  # General
  type = "regex_parser" # required
  inputs = ["mxx_events_routing.event_with_private_service"] # required

[transforms.mxx_service_parse_public]
  type = "regex_parser" # required
  inputs = ["mxx_events_routing.event_with_public_service"] # required

[transforms.ec2_metadata_mxx_internal]
  type = "aws_ec2_metadata" # required
  inputs = ["mxx_events_routing.event_with_backend_state"] # required

[transforms.ec2_metadata_mxx_service]
  type = "aws_ec2_metadata" # required
  inputs = ["mxx_service_parse_public","mxx_service_parse_private"] # required

[transforms.mxx_internal_remove_fields]
  type = "remove_fields" # required
  inputs = ["ec2_metadata_mxx_internal"] # required

[transforms.mxx_add_fields_internal]
  # General
  type = "add_fields" # required
  inputs = ["mxx_internal_remove_fields"] # required

[transforms.mxx_service_remove_fields]
  type = "remove_fields" # required
  inputs = ["ec2_metadata_mxx_service"] # required

[transforms.mxx_add_fields_service]
  # General
  type = "add_fields" # required
  inputs = ["mxx_service_remove_fields"] # required

[transforms.mxx-services]
  type = "rename_fields" # required
  inputs = ["mxx_add_fields_service"] # required

[transforms.mxx-internal]
  type = "rename_fields" # required
  inputs = ["mxx_add_fields_internal"] # required

[sinks.s3_archives_nginx-access]
  inputs       = ["nginx-access"] # don't sample
  type         = "aws_s3"

[sinks.s3_archives_nginx-error]
  inputs       = ["nginx-error"] # don't sample
  type         = "aws_s3"

[sinks.s3_archives_mxx-services]
  inputs       = ["mxx-services"] # don't sample
  type         = "aws_s3"

[sinks.s3_archives_mxx-internal]
  inputs       = ["mxx-internal"] # don't sample
  type         = "aws_s3"

[sinks.datadog_logs_nginx]
  type = "datadog_logs" # required
  inputs = ["nginx-access","nginx-error"] # required

[sinks.datadog_logs_mxx]
  type = "datadog_logs" # required
  inputs = ["mxx-services", "mxx-internal"] # required

[sinks.datadog_metrics_vector_internal]
  type = "datadog_metrics" # required
  inputs = ["tags_internal_metrics"] # required
same time on logs ingest to DD
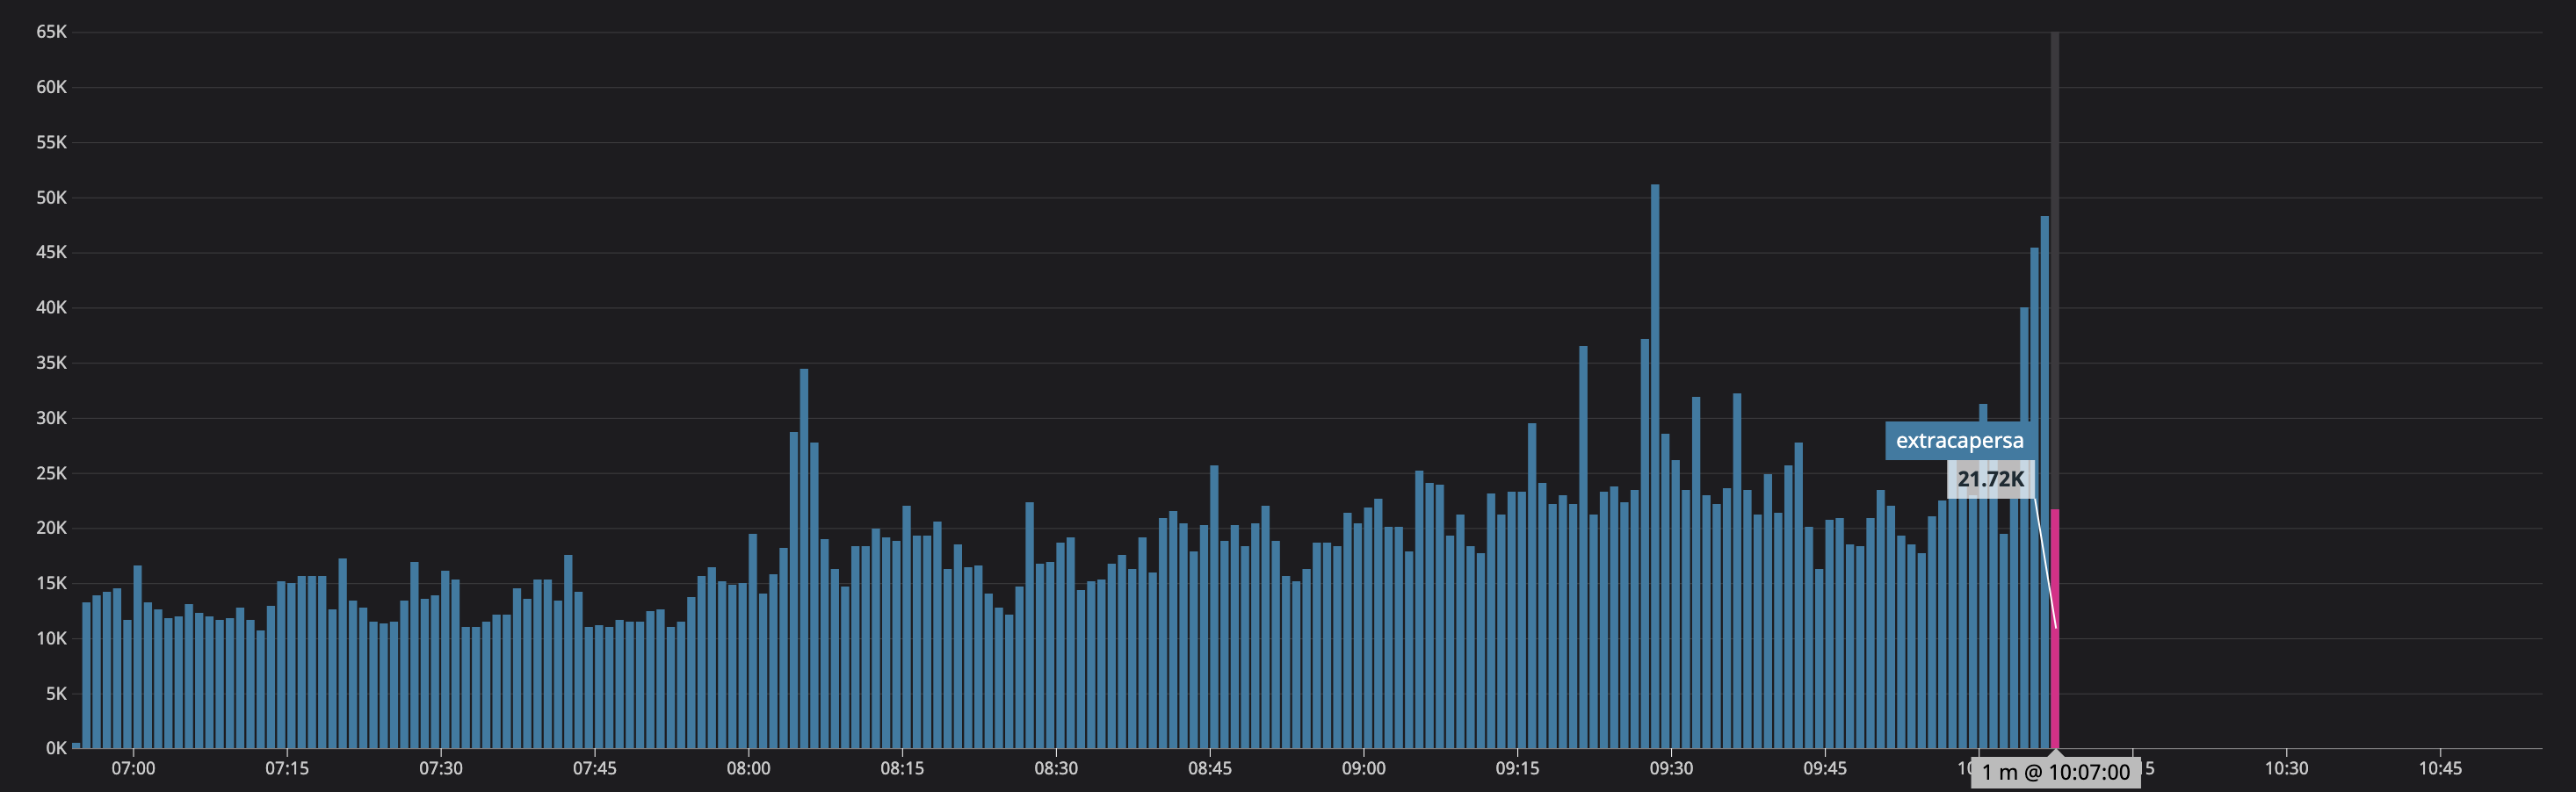
No more errors in Vector, no more logs later last from
szibis
on 18 Sep 2020
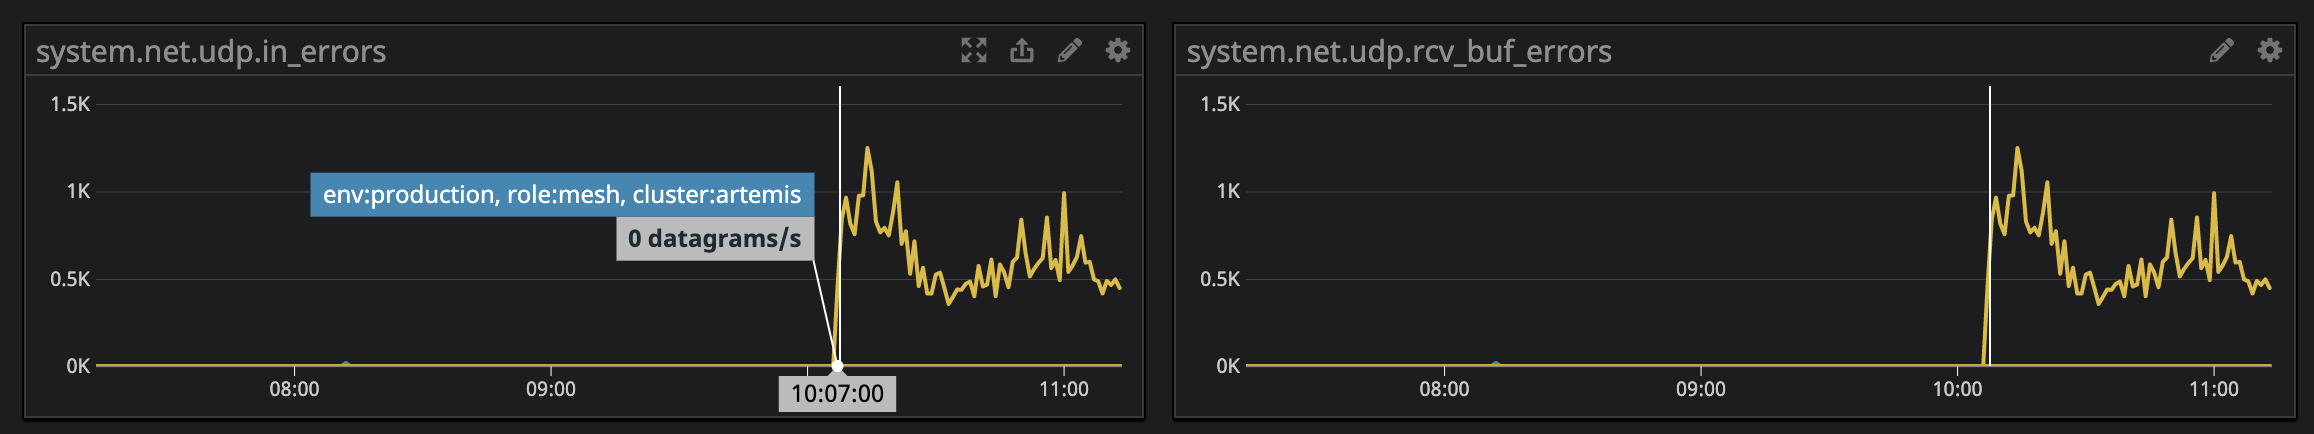
What may help is that on this one particular node we have from that time a huge number of UDP rcv errors maybe this is connected with syslog source in Vector
szibis
on 18 Sep 2020
Restarting Syslog on that box is not helping which may lead to that this is on the Vector side as we increase all sysctl options for UDP there - the moment we restart Vector is that moment when all starting to work.
szibis
on 18 Sep 2020

No more metrics are available in this Vector version.
szibis
on 18 Sep 2020
After Vector restart on that instances

szibis
on 18 Sep 2020
which may lead to that this is on the Vector side
@szibis yes, it's clear now that this is something between Vector and Datadog. Only thing/error that is happening is that we are disconnected from the server, and then allowed to reconnect some time after, and before the disconnect the server starts accepting logs with a slower pace.
The same thing is happening with my setup (master branch), after some 13h and 800 million of logs the disconnect happens.
I'll check if the sink is breaking some API contract.
Open questions
[x] But why is the reset helping?
[x] Are the syslog errors result of back pressure?
ktff
on 18 Sep 2020
Regarding udp errors, the syslog source is feeling the back pressure from the datadog_logs sink so it's not accepting udp packets. And that's a sign that the source isn't the issue.
ktff
on 18 Sep 2020
datadog_logs sink is following the API, as far as I can see, so I'll run multiple setups with different payload type and different logs/sec amount to see if one of those things has any influence on the issue. With this I would like to eliminate the case of Datadog applying some rate limit on the logs.
If that case is eliminated, then it's something with our shared TcpSink, so I'll be able to cross verify it by using different sink in the same situation to see if it shares the issue.
ktff
on 18 Sep 2020
to cross verify it by using different sink in the same situation to see if it shares the issue.
That can actually be done now.
ktff
on 18 Sep 2020
Found a bug which can cause our TcpSink to never/sporadically try reconnecting after some disconnects. That would explain why restarts help. It will take less then a day to verify it's the main cause of this issue.
ktff
on 18 Sep 2020
So the overall picture is:
- DataDog was applying back pressure on
datadog logssink, first by reducing the receive rate, and in the end ending the connection. datadog logssink once disconnected hanged in disconnect state because of the bug, which caused additional back pressure to the sources.- The back pressure than started showing up in
syslogsource via errors resulting in dropping udp packets.
ktff
on 19 Sep 2020
Related issues
 timberio-campfire
·
17Comments
timberio-campfire
·
17Comments
 spencergilbert
·
19Comments
spencergilbert
·
19Comments
 LucioFranco
·
21Comments
binarylogic
·
44Comments
LucioFranco
·
21Comments
binarylogic
·
44Comments
 lukesteensen
·
20Comments
lukesteensen
·
20Comments
Most helpful comment
Regarding
udperrors, thesyslogsource is feeling the back pressure from thedatadog_logssink so it's not acceptingudppackets. And that's a sign that the source isn't the issue.