Vector: QA the new automatic concurrency feature
https://github.com/timberio/vector/pull/3094 introduces the ability for Vector to automatically determine the optimal in_flight_limit value. RFC 1858 outlines this feature. Given the automatic nature of this feature, we need to take care to QA this more than usual.
Setup
- First, this should be a black box, end to end, integration style of testing. @bruceg covered unit tests in #3094. We want to test real-world usage as much as possible.
- While we could set up a real service, like Elasticsearch, I think we're better off creating a simple simulator that will give us more control over scenarios. This could build upon our
http_test_serverproject.
Questions
We want to answer:
- How quickly does Vector find the optimal value given the
httpsink defaults? - Does Vector correctly back off in the event of total service failure?
- Does Vector correctly back off in the event of _gradually_ increasing response times?
- Does Vector correctly back off in the event of _sudden sustained_ increasing response times?
- Does Vector correctly ignore one-off errors that are not indicative of service degradation? Such as one-off network errors. We want to make sure Vector does not overreact in these situations.
 binarylogic
All 44 comments
- Does Vector correctly handle indications of resource contention, such as increasing response times after concurrency increases?
 bruceg
on 29 Jul 2020
bruceg
on 29 Jul 2020
The questions to answer for the blog post would be to compare the performance of this new auto mode with something configured with too low and too high of a fixed concurrency. Also, what happens when other load is introduced, like additional senders or cross-traffic delays?
bruceg
on 30 Jul 2020
- If two (or n) vectors are pointed at the same endpoint, do they share the concurrency limit appropriately? For example, if a service has a hard limit of 10 req/s and I point 2 vectors at it, do they both hover around 5 req/s?
- Timeouts
 jszwedko
on 5 Aug 2020
jszwedko
on 5 Aug 2020
I wanted to start off by saying this is very useful feature and will probably save people a lot of anguish trying to configure vector sinks.
I did some exploration of this today using our https://github.com/timberio/http_test_server with some modifications to simulate latency and request queuing. I haven't synthesized this into any sort of definite conclusions, but thought the below exploration results might be interesting to think about in the meantime.
I intend to push some modifications to the test server that will make the behavior configurable via a combination of flags and request paramaterers (somewhat similar to https://github.com/postmanlabs/httpbin). For example, I might point vector at an http endpoint with /limit/10?latency=100ms. To allow simulating a service that has a hard limit of 10 req/s with a latency of 100ms per request. I'll aim to allow all of the above scenarios to be tested.
Some initial findings / questions:
It seems like this will be the new default (i.e. if request.in_flight_limit isn't set)? I might recommend making this new feature opt-in for the next version of vector to allow us to get user feedback before affecting everyone's behavior. We should promote it so that people try it out though; I just hesitate to make it the default until it's been battletested on some more setups aside from the testing that we will do.
Q: Does this interact at all with Retry-After headers (https://developer.mozilla.org/en-US/docs/Web/HTTP/Status/429)? That might be a nice follow-up if not.
Q: Did we consider Netflix's gradient algorithm? I noted the blog post was linked in the RFC, but I wasn't sure if it was explicitly considered.
Queueing scenario
When setting up a scenario where requests would start to queue when there were more than 10 req/s (with request latency of ~500ms), I saw the following behavior in vector:
Aug 05 16:50:46.227 TRACE sink{name=out type=http}:request{request_id=2}: vector::internal_events::auto_concurrency: changed concurrency. concurrency=2
Aug 05 16:50:46.733 TRACE sink{name=out type=http}:request{request_id=3}: vector::internal_events::auto_concurrency: changed concurrency. concurrency=2
Aug 05 16:50:47.238 TRACE sink{name=out type=http}:request{request_id=5}: vector::internal_events::auto_concurrency: changed concurrency. concurrency=2
Aug 05 16:50:47.743 TRACE sink{name=out type=http}:request{request_id=8}: vector::internal_events::auto_concurrency: changed concurrency. concurrency=2
Aug 05 16:50:48.248 TRACE sink{name=out type=http}:request{request_id=9}: vector::internal_events::auto_concurrency: changed concurrency. concurrency=3
Aug 05 16:50:48.752 TRACE sink{name=out type=http}:request{request_id=11}: vector::internal_events::auto_concurrency: changed concurrency. concurrency=3
Aug 05 16:50:49.257 TRACE sink{name=out type=http}:request{request_id=13}: vector::internal_events::auto_concurrency: changed concurrency. concurrency=4
Aug 05 16:50:49.762 TRACE sink{name=out type=http}:request{request_id=17}: vector::internal_events::auto_concurrency: changed concurrency. concurrency=5
Aug 05 16:50:50.266 TRACE sink{name=out type=http}:request{request_id=20}: vector::internal_events::auto_concurrency: changed concurrency. concurrency=5
Aug 05 16:50:50.770 TRACE sink{name=out type=http}:request{request_id=25}: vector::internal_events::auto_concurrency: changed concurrency. concurrency=6
Aug 05 16:50:51.275 TRACE sink{name=out type=http}:request{request_id=31}: vector::internal_events::auto_concurrency: changed concurrency. concurrency=7
Aug 05 16:50:51.779 TRACE sink{name=out type=http}:request{request_id=36}: vector::internal_events::auto_concurrency: changed concurrency. concurrency=8
Aug 05 16:50:52.284 TRACE sink{name=out type=http}:request{request_id=44}: vector::internal_events::auto_concurrency: changed concurrency. concurrency=9
Aug 05 16:50:52.788 TRACE sink{name=out type=http}:request{request_id=52}: vector::internal_events::auto_concurrency: changed concurrency. concurrency=9
Aug 05 16:50:53.292 TRACE sink{name=out type=http}:request{request_id=60}: vector::internal_events::auto_concurrency: changed concurrency. concurrency=5
Aug 05 16:50:53.887 TRACE sink{name=out type=http}:request{request_id=66}: vector::internal_events::auto_concurrency: changed concurrency. concurrency=3
Aug 05 16:50:54.591 TRACE sink{name=out type=http}:request{request_id=71}: vector::internal_events::auto_concurrency: changed concurrency. concurrency=4
Aug 05 16:50:55.299 TRACE sink{name=out type=http}:request{request_id=77}: vector::internal_events::auto_concurrency: changed concurrency. concurrency=5
Aug 05 16:50:56.104 TRACE sink{name=out type=http}:request{request_id=83}: vector::internal_events::auto_concurrency: changed concurrency. concurrency=6
Aug 05 16:50:56.711 TRACE sink{name=out type=http}:request{request_id=90}: vector::internal_events::auto_concurrency: changed concurrency. concurrency=7
Aug 05 16:50:57.316 TRACE sink{name=out type=http}:request{request_id=98}: vector::internal_events::auto_concurrency: changed concurrency. concurrency=8
Aug 05 16:50:57.886 TRACE sink{name=out type=http}:request{request_id=106}: vector::internal_events::auto_concurrency: changed concurrency. concurrency=9
As we can see there it edges up to 10, but then backs off to 5 when requests start queuing (latency increases as the requests block). I think this is roughly what we expect from the algorithm as I understand it but doesn't strike me as optimal behavior. I think there are a couple of things that could be better:
- That it would back off more slowly when latencies increase. The Netflix example uses 0.9 as a default (https://github.com/Netflix/concurrency-limits/blob/master/concurrency-limits-core/src/main/java/com/netflix/concurrency/limits/limit/AIMDLimit.java#L34) which seems to have better behavior to me. When I tried it, the concurrency never dipped below 6.
- That it would increase more rapidly initially. This could be somewhat similar to TCP's "slow start" algorithm (https://en.wikipedia.org/wiki/TCP_congestion_control#Slow_start) which grows quickly before switching to its "congestion avoidance" algorithm when it finds it has saturated the capacity.
You can see this same behavior during "recovery" where, if I take the endpoint offline, let vector reduce down to 1, and then bring it back online, it is slow to build back up to the available capacity. I'm wondering if there are ways to improve that. I'm not super familiar with TCP congestion control, but they do appear to have a similar concept of "fast recovery" from packet loss.
It seems like this algorithm would be slow to adjust to large increases in downstream capacity. For example, say that I have 10 vectors pointed at some constrained resource so that they share the capacity and then I take 9 offline. It seems like it would take the remaining running vector a while to increase concurrency to the available capacity. You could consider a similar scenario where the sink capacity is increased via scaling horizontally behind a load balancer.
Hard limit scenario
When setting up a scenario where any requests over 10/s were given a 429 (indicating a hard limit) (with simulated request latency of ~500ms for successful requests), I saw the following behavior in vector:
Aug 05 17:03:36.825 TRACE sink{name=out type=http}:request{request_id=2}: vector::internal_events::auto_concurrency: changed concurrency. concurrency=2
Aug 05 17:03:37.331 TRACE sink{name=out type=http}:request{request_id=4}: vector::internal_events::auto_concurrency: changed concurrency. concurrency=2
Aug 05 17:03:38.339 TRACE sink{name=out type=http}:request{request_id=7}: vector::internal_events::auto_concurrency: changed concurrency. concurrency=3
Aug 05 17:03:38.843 TRACE sink{name=out type=http}:request{request_id=9}: vector::internal_events::auto_concurrency: changed concurrency. concurrency=4
Aug 05 17:03:39.348 TRACE sink{name=out type=http}:request{request_id=12}: vector::internal_events::auto_concurrency: changed concurrency. concurrency=5
Aug 05 17:03:39.853 TRACE sink{name=out type=http}:request{request_id=16}: vector::internal_events::auto_concurrency: changed concurrency. concurrency=6
Aug 05 17:03:40.357 TRACE sink{name=out type=http}:request{request_id=21}: vector::internal_events::auto_concurrency: changed concurrency. concurrency=6
Aug 05 17:03:40.861 TRACE sink{name=out type=http}:request{request_id=27}: vector::internal_events::auto_concurrency: changed concurrency. concurrency=6
Aug 05 17:03:41.367 TRACE sink{name=out type=http}:request{request_id=33}: vector::internal_events::auto_concurrency: changed concurrency. concurrency=7
Aug 05 17:03:41.871 TRACE sink{name=out type=http}:request{request_id=39}: vector::internal_events::auto_concurrency: changed concurrency. concurrency=8
Aug 05 17:03:42.376 TRACE sink{name=out type=http}:request{request_id=46}: vector::internal_events::auto_concurrency: changed concurrency. concurrency=9
Aug 05 17:03:42.881 TRACE sink{name=out type=http}:request{request_id=56}: vector::internal_events::auto_concurrency: changed concurrency. concurrency=10
Aug 05 17:03:43.386 TRACE sink{name=out type=http}:request{request_id=52}: vector::internal_events::auto_concurrency: changed concurrency. concurrency=11
Aug 05 17:03:43.888 TRACE sink{name=out type=http}:request{request_id=62}: vector::internal_events::auto_concurrency: changed concurrency. concurrency=12
Aug 05 17:03:44.392 TRACE sink{name=out type=http}:request{request_id=80}: vector::internal_events::auto_concurrency: changed concurrency. concurrency=13
Aug 05 17:03:44.895 TRACE sink{name=out type=http}:request{request_id=66}: vector::internal_events::auto_concurrency: changed concurrency. concurrency=14
Aug 05 17:03:44.954 TRACE sink{name=out type=http}:request{request_id=120}: vector::internal_events::auto_concurrency: changed concurrency. concurrency=14
Aug 05 17:03:45.396 TRACE sink{name=out type=http}:request{request_id=188}: vector::internal_events::auto_concurrency: changed concurrency. concurrency=14
Aug 05 17:03:45.436 TRACE sink{name=out type=http}:request{request_id=169}: vector::internal_events::auto_concurrency: changed concurrency. concurrency=15
Aug 05 17:03:45.901 TRACE sink{name=out type=http}:request{request_id=227}: vector::internal_events::auto_concurrency: changed concurrency. concurrency=15
Aug 05 17:03:45.929 TRACE sink{name=out type=http}:request{request_id=283}: vector::internal_events::auto_concurrency: changed concurrency. concurrency=8
Aug 05 17:03:46.402 TRACE sink{name=out type=http}:request{request_id=213}: vector::internal_events::auto_concurrency: changed concurrency. concurrency=9
Aug 05 17:03:46.438 TRACE sink{name=out type=http}:request{request_id=247}: vector::internal_events::auto_concurrency: changed concurrency. concurrency=5
Aug 05 17:03:46.903 TRACE sink{name=out type=http}:request{request_id=69}: vector::internal_events::auto_concurrency: changed concurrency. concurrency=3
Aug 05 17:03:47.407 TRACE sink{name=out type=http}:request{request_id=249}: vector::internal_events::auto_concurrency: changed concurrency. concurrency=2
Aug 05 17:03:47.910 TRACE sink{name=out type=http}:request{request_id=251}: vector::internal_events::auto_concurrency: changed concurrency. concurrency=1
Aug 05 17:03:48.413 TRACE sink{name=out type=http}:request{request_id=255}: vector::internal_events::auto_concurrency: changed concurrency. concurrency=1
Aug 05 17:03:48.916 TRACE sink{name=out type=http}:request{request_id=258}: vector::internal_events::auto_concurrency: changed concurrency. concurrency=1
Aug 05 17:03:49.419 TRACE sink{name=out type=http}:request{request_id=257}: vector::internal_events::auto_concurrency: changed concurrency. concurrency=1
Aug 05 17:03:49.922 TRACE sink{name=out type=http}:request{request_id=261}: vector::internal_events::auto_concurrency: changed concurrency. concurrency=1
Here we see that it ventured up to 15 given we allow 10 incoming req / s and each takes 500ms and then backs off down to 1, but it never recovers and starts increasing again even though there is capacity available.
I noticed when I changed the backoff paramater to 0.9 (as mentioned above in the queuing scenario) that I saw better behavior where it went up to 15 and then backed off to hover around 10 as expected.
Maybe we could make the back-off parameter configurable?
Low latency scenario
I noticed that if the latencies were low (around 10ms) even if there was no rate limit, vector would hover around 3 concurrent requests / s even if it could go higher without impacting latency. My guess is that the latency variance relative to 10ms was great enough that it triggered the backoff too aggressively.
I did note the threshold parameter (0.05) that is ostensibly used to mitigate this.
jszwedko
on 5 Aug 2020
Nice work @jszwedko! @bruceg I'm curious what you think? It'd be nice to agree on action items and then implement them in #3094. Would you midn listing out what you think should change and/or be further verified?
binarylogic
on 6 Aug 2020
It seems like this will be the new default (i.e. if
request.in_flight_limitisn't set)? I might recommend making this new feature opt-in for the next version of vector to allow us to get user feedback before affecting everyone's behavior. We should promote it so that people try it out though; I just hesitate to make it the default until it's been battletested on some more setups aside from the testing that we will do.
Yes, it was intended to be the new default, though I agree with your idea of a soft introduction. I'll work at restoring the previous defaults to make the automatic opt-in.
Q: Does this interact at all with
Retry-Afterheaders (https://developer.mozilla.org/en-US/docs/Web/HTTP/Status/429)? That might be a nice follow-up if not.
It does not deal with HTTP 429 responses, no. That was planned as a follow-up once this has validated.
Q: Did we consider Netflix's gradient algorithm? I noted the blog post was linked in the RFC, but I wasn't sure if it was explicitly considered.
No, I was aiming for a simple algorithm onto which we could later make some modifications.
When setting up a scenario where requests would start to queue when there were more than 10 req/s (with request latency of ~500ms), I saw the following behavior in vector:
As we can see there it edges up to 10, but then backs off to 5 when requests start queuing (latency increases as the requests block). I think this is roughly what we expect from the algorithm as I understand but doesn't strike me as optimal behavior.
Note that there are diminishing gains for increasing concurrency—the difference between 5 and 10 is likely relatively small, at least much smaller than between, 2-3 and 5. Still,
I think there are a couple of things that could be better:
Of this I am sure.
* That it would back off more slowly when latencies increase. The Netflix example uses 0.9 as a default (https://github.com/Netflix/concurrency-limits/blob/master/concurrency-limits-core/src/main/java/com/netflix/concurrency/limits/limit/AIMDLimit.java#L34) which seems to have better behavior to me. When I tried it, the concurrency never dipped below 6.
A backoff of 0.9 would effectively degrade to an additive decrease at a concurrency of 10 or below ((0.9 * x) as usize will always be equal to x - 1). It might be worth doing, but we need to be aware this will lose the multiplicative effect at lower concurrency levels.
* That it would increase more rapidly initially. This could be somewhat similar to TCP's "slow start" algorithm (https://en.wikipedia.org/wiki/TCP_congestion_control#Slow_start) which grows quickly before switching to its "cogestion avoidance" algorithm when it finds it has saturated the capacity.
It can potentially increase once per RTT. Is this really slow? I think I could probably work the "slow start" into this algorithm without too much work. Should that become part of follow-on tuning work though?
You can see this same behavior during "recovery" where, if I take the endpoint offline, let vector reduce down to 1, and then bring it back online, it is slow to build back up to the available capacity.
Is it slower than the initial ramp up period, or just as slow as initially?
I'm wondering if there are ways to improve that. I'm not super familiar with TCP congestion control, but they do appear to have a similar concept of "fast recovery" from packet loss.
When you say "fast recovery", do you mean to use an accelerated ramp up, like we should consider for the initial ramp up, or an immediate return to high concurrency? If the latter, I would be concerned about triggering "thundering herd" behavior if such a scenario is triggered by load induced unavailability.
It seems like this algorithm would be slow to adjust to large increases in downstream capacity. For example, say that I have 10 vectors pointed at some constrained resource so that they share the capacity and then I take 9 offline. It seems like it would take the remaining running vector a while to increase concurrency to the available capacity. You could consider a similar scenario where the sink capacity is increased via scaling horizontally behind a load balancer.
I would expect it to adjust to the high downstream capacity at the same rate in either the situation you describe or if there was ever only one vector.
Hard limit scenario
When setting up a scenario where any requests over 10/s were given a 429 (indicating a hard limit) (with request latency of ~500ms for successful requests), I saw the following behavior in vector:
Here we see that it ventured up to 15 given we allow 10 incoming req / s and each takes 500ms and then backs off down to 1, but it never recovers and starts increasing again even though there is capacity available.
Off hand, I would think this is because the latency average is retaining part of the 500ms value for too long due to the EWMA on the past RTT measurement. This may point to the value of EWMA_ALPHA being wrong.
Would it make sense to report those numbers in that trace?
I noticed when I changed the backoff parameter to 0.9 (as mentioned above in the queuing scenario) that I saw better behavior where it went up to 15 and then backed off to hover around 10 as expected.
Maybe we could make the back-off parameter configurable?
I want to make many such parameters configurable, but was hoping to get at least this minimal version merged before adding on features. However, if it will aid with testing, I'll push that effort.
Low latency scenario
I noticed that if the latencies were low (around 10ms) even if there was no rate limit, vector would hover around 3 concurrent requests / s even if it could go higher without impacting latency. My guess is that the latency variance relative to 10ms was great enough that it triggered the backoff to aggressively.
That would be my guess too, and it agrees with what I saw in the internal tests. I am unsure how to compensate for latency variance becoming a substantial fraction.
I did note the threshold parameter (0.05) that is ostensibly used to mitigate this.
That too could need tuning.
bruceg
on 6 Aug 2020
To summarize, I read the following possible actions from the above.
To do in this PR:
- [x] Restore defaults for
in_flight_limitand add newautosetting to opt-in to the new behavior. - [ ] Add more measurement information to traces
- [ ] Expose tunables at a global level: EWMA alpha, increase/decrease RTT threshold, decrease ratio, others?
To do in follow-up work:
- [ ] Expose tunables on a per-sink basis
- [ ] Handle explicit backpressure from HTTP 429 (or equivalent) responses
- [ ] Implement a "slow start" (rapid increase) tweak to the existing algorithm
- [ ] Implement gradient algorithm
bruceg
on 6 Aug 2020
:+1: Thanks @bruceg, those actions sound good to me.
I think:
Expose tunables at a global level: EWMA alpha, increase/decrease RTT threshold, decrease ratio, others?
Will be useful. We should try to use the best defaults possible, but I think these will be helpful to people with more intimate knowledge of their sink.
Add more measurement information to traces
Will definitely be helpful for understanding the behavior better while testing.
Some more in-line responses:
When setting up a scenario where requests would start to queue when there were more than 10 req/s (with request latency of ~500ms), I saw the following behavior in vector:
As we can see there it edges up to 10, but then backs off to 5 when requests start queuing (latency increases as the requests block). I think this is roughly what we expect from the algorithm as I understand but doesn't strike me as optimal behavior.Note that there are diminishing gains for increasing concurrency—the difference between 5 and 10 is likely relatively small, at least much smaller than between, 2-3 and 5. Still,
I think there are a couple of things that could be better:
Of this I am sure.
* That it would back off more slowly when latencies increase. The Netflix example uses 0.9 as a default (https://github.com/Netflix/concurrency-limits/blob/master/concurrency-limits-core/src/main/java/com/netflix/concurrency/limits/limit/AIMDLimit.java#L34) which seems to have better behavior to me. When I tried it, the concurrency never dipped below 6.A backoff of 0.9 would effectively degrade to an additive decrease at a concurrency of 10 or below (
(0.9 * x) as usizewill always be equal tox - 1). It might be worth doing, but we need to be aware this will lose the multiplicative effect at lower concurrency levels.
I think the back-off of 0.5 wouldn't be quite so much of an issue if it recovered more quickly, but it seems like the recovery is limited by the RTT of the requests. For services that respond more slowly, it will take longer to recover. If I imagine a service that has an average RTT of 200ms and can sustain 1000 concurrent req, when vector exceeded 1000 and bounced back down to 500, it would take ~100s to build back up before resetting again. Maybe this is fine though? It just seems to me that we are likely to get better throughput with a smaller back-off factor; with the trade-off of not responding to increased load on the downstream server as quickly. In this case, it seems like we would get an average of 750 concurrent requests.
A random idea would be to have the backoff factor itself be exponential so that it might start at 0.9 but then move to 0.9 * 0.9 if it needed to back off more, and so on, resetting to 0.9 when it started growing again.
Another random idea might be to tie the back-off factor to the RTT somehow to compensate for the slower feedback from slower services.
I think this is somewhat exacerbated by the fact that we expect it to have a "sawtooth" like pattern of dropping below maximum capacity given that any measurement above the mean (+thershold) is taken to indicate load. Services with a high variance in request latencies are likely to see a lot more backing off.
You can see this same behavior during "recovery" where, if I take the endpoint offline, let vector reduce down to 1, and then bring it back online, it is slow to build back up to the available capacity.
Is it slower than the initial ramp up period, or just as slow as initially?
It actually seems to be slower than the initial ramp-up due to the EWMA algorithm which appears to be including the failed responses in the measurements so that it sits at a concurrency level of 1 for a while until the moving average catches up.
This seems to be related to the HTTP Status 429 issue as well when I introduce a hard limit on concurrent requests.
I think, in both of these cases, that the algorithm should not include the response time of these failed requests in the moving average. Maybe this should be expanded to exclude any non-200 level HTTP responses in the mean calculation.
This is also making me wonder about endpoints where response time is correlated to some aspect of the payload and that part of the payload is tied to the event. For example, an Elasticsearch index:
[sinks.my_sink_id]
  type = "elasticsearch" # required
  inputs = ["my-source-or-transform-id"] # required
  index = "{{ some_field }}" # optional, default
If we have two indexes, A and B, that the logs are evenly split across, I imagine the average would be between A and B causing it to reduce concurrency anytime index B is written to.
This is mostly just food for thought. I think this case is probably more rare.
I'm wondering if there are ways to improve that. I'm not super familiar with TCP congestion control, but they do appear to have a similar concept of "fast recovery" from packet loss.
When you say "fast recovery", do you mean to use an accelerated ramp up, like we should consider for the initial ramp up, or an immediate return to high concurrency? If the latter, I would be concerned about triggering "thundering herd" behavior if such a scenario is triggered by load induced unavailability.
That is a good point; thundering herd is definitely a concern. I think this is related to my comment above about the concurrency adapting at a rate relative to the RTT of the requests. Slower services will be slower to find the max capacity.
I want to make many such parameters configurable, but was hoping to get at least this minimal version merged before adding on features. However, if it will aid with testing, I'll push that effort.
:+1: I think it would help with testing out different parameters.
Low latency scenario
I noticed that if the latencies were low (around 10ms) even if there was no rate limit, vector would hover around 3 concurrent requests / s even if it could go higher without impacting latency. My guess is that the latency variance relative to 10ms was great enough that it triggered the backoff to aggressively.
That would be my guess too, and it agrees with what I saw in the internal tests. I am unsure how to compensate for latency variance becoming a substantial fraction.
I did note the threshold parameter (0.05) that is ostensibly used to mitigate this.
That too could need tuning.
Idea: could we maintain some measurement of variance to use to determine when a new RTT measurement is likely to indicate a change in mean response times? This would take the place of the theshold constant and reduce the concurrency jitter for high variance (relative to the magnitude of the mean) services.
jszwedko
on 6 Aug 2020
I'll pick this back up when I'm back on Wednesday. Apologies, in hindsight I should have started this on Monday to make sure I didn't end up blocking it. If it is useful, I think the concurrency PR is fine to merge if it is not the default behavior. We can continue iterating on it. It is a great start.
jszwedko
on 6 Aug 2020
Expose tunables at a global level: EWMA alpha, increase/decrease RTT threshold, decrease ratio, others?
Will be useful. We should try to use the best defaults possible, but I think these will be helpful to people with more intimate knowledge of their sink.
+1 I think it would help with testing out different parameters.
Added as #3423
Add more measurement information to traces
Will definitely be helpful for understanding the behavior better while testing.
Added as #3425
A backoff of 0.9 would effectively degrade to an additive decrease at a concurrency of 10 or below (
(0.9 * x) as usizewill always be equal tox - 1). It might be worth doing, but we need to be aware this will lose the multiplicative effect at lower concurrency levels.I think the back-off of 0.5 wouldn't be quite so much of an issue if it recovered more quickly, but it seems like the recovery is limited by the RTT of the requests. For services that respond more slowly, it will take longer to recover.
Yes, all of the adjustments are limited to once per RTT. I took that from the source material. In particular the TCP algorithms I looked at only make one adjustment per RTT.
If I imagine a service that has an average RTT of 200ms and can sustain 1000 concurrent req, when vector exceeded 1000 and bounced back down to 500, it would take ~100s to build back up before resetting again.
Hmm, I did not anticipate having concurrency levels this high being desirable. You are right that it would take a long time (both at startup and after a reduction) to return to such high levels. I am unsure how best to address this.
It just seems to me that we are likely to get better throughput with a smaller back-off factor; with the trade-off of not responding to increased load on the downstream server as quickly. In this case, it seems like we would get an average of 750 concurrent requests.
Another random idea might be to tie the back-off factor to the RTT somehow to compensate for the slower feedback from slower services.
I'm not clear what kind of tie-in you are thinking of here.
I think this is somewhat exacerbated by the fact that we expect it to have a "sawtooth" like pattern of dropping below maximum capacity given that any measurement above the mean (+thershold) is taken to indicate load. Services with a high variance in request latencies are likely to see a lot more backing off.
Yeah, latency variation is something I too am concerned about. The THRESHOLD_RATIO was a simplistic attempt to deal with it, but we possibly need something more, like measuring deviation along with the current mean RTT.
It actually seems to be slower than the initial ramp-up due to the EWMA algorithm which appears to be including the failed responses in the measurements so that it sits at a concurrency level of
1for a while until the moving average catches up.
Hmm, I would expect exactly the opposite. The past average should be higher than the current average, which would trigger the ramp-up pretty unconditionally. Another place where more measurements in the traces would be instructive.
I think, in both of these cases, that the algorithm should not include the response time of these failed requests in the moving average. Maybe this should be expanded to exclude any non-200 level HTTP responses in the mean calculation.
Possibly. It's beginning to sound like we need to open a "playground" PR to test some of these ideas in code.
That is a good point; thundering herd is definitely a concern. I think this is related to my comment above about the concurrency adapting at a rate relative to the RTT of the requests. Slower services will be slower to find the max capacity.
Agreed, but this is kinda to be expected, isn't it? When there is less information provided by the remote (in the sense of fewer RTT measurements), we can't expect to adjust as fast.
bruceg
on 12 Aug 2020
Thanks for the responses! I think I'm getting close to pushing some code up for looking at different scenarios (and making it easy to try new ones), but it looks like I'll need probably another day or two. I'll aim to push something tomorrow even if it isn't complete.
Some in-line thoughts in the meanwhile:
If I imagine a service that has an average RTT of 200ms and can sustain 1000 concurrent req, when vector exceeded 1000 and bounced back down to 500, it would take ~100s to build back up before resetting again.
Hmm, I did not anticipate having concurrency levels this high being desirable. You are right that it would take a long time (both at startup and after a reduction) to return to such high levels. I am unsure how best to address this.
I don't see why they couldn't commonly be that high, especially for self-hosted services like Elasticsearch where there is only one tenant. As a cherry-picked example, for Timber Hosted, it looks like we have an average of ~250 concurrent requests to Elasticsearch (spread over 8 writers).
I'm also not 100% sure how to address this though. Some options could be slower back-off or faster recovery. I'll try to run some scenarios with high downstream concurrency capacity.
Another random idea might be to tie the back-off factor to the RTT somehow to compensate for the slower feedback from slower services.
I'm not clear what kind of tie-in you are thinking of here.
I don't have a concrete suggestion, but it seems like we could do something around backing off more slowly or recovering more quickly.
I think this is somewhat exacerbated by the fact that we expect it to have a "sawtooth" like pattern of dropping below maximum capacity given that any measurement above the mean (+thershold) is taken to indicate load. Services with a high variance in request latencies are likely to see a lot more backing off.
Yeah, latency variation is something I too am concerned about. The
THRESHOLD_RATIOwas a simplistic attempt to deal with it, but we possibly need something more, like measuring deviation along with the current mean RTT.
It actually seems to be slower than the initial ramp-up due to the EWMA algorithm which appears to be including the failed responses in the measurements so that it sits at a concurrency level of
1for a while until the moving average catches up.Hmm, I would expect exactly the opposite. The past average should be higher than the current average, which would trigger the ramp-up pretty unconditionally. Another place where more measurements in the traces would be instructive.
The additional measurements in traces would definitely help here. I'm guessing the past average is lower than the current average as it is including the failed request timings (which will be very fast in the case that a connection cannot be established). Same if a 429 is returned which I imagine will typically have a lower mean response time than successful requests as rate limits are usually checked as a precondition.
I think, in both of these cases, that the algorithm should not include the response time of these failed requests in the moving average. Maybe this should be expanded to exclude any non-200 level HTTP responses in the mean calculation.
Possibly. It's beginning to sound like we need to open a "playground" PR to test some of these ideas in code.
Agreed, I aim to codify what I have to make it easier to test different scenarios.
jszwedko
on 13 Aug 2020
Alright, finally some output!
But first, a short explanation of how I ran these so that you can run it too and test different behaviors.
I updated http_test_server project in https://github.com/timberio/http_test_server/pull/1 to allow us to test out various configurations. You can see the README updates there for an idea of how to run it. I hope to expand the artificial controls to add things such as artificial variance to the latency.
You can run the server directly and simply observe the behavior in vector, or there is also a wrapper script bin/run-concurrency-test that can be used that will run a test for $TEST_TIME seconds and process the output.
An example run:
TEST_TIME=60 \
VECTOR=/path/to/vector \
HTTP_TEST_LATENCY_MEAN=500ms \
HTTP_TEST_RATE_LIMIT_BUCKET_FILL_INTERVAL=1s \
HTTP_TEST_RATE_LIMIT_BUCKET_CAPACITY=5 \
HTTP_TEST_RATE_LIMIT_BUCKET_QUANTUM=5 \
HTTP_TEST_RATE_LIMIT_BEHAVIOR=HARD \
./bin/run-concurrency-test
You can then see the output in the directory it echos out. See the README updates for details of what each artifact is.
This will run the test server with a simulated latency of 500ms and a hard rate limit of 5 requests per second (refreshed every second). After 60s it'll stop and process the output.
I'm curious what you think of this setup. I opted to record the statistics on the test server side to allow for us to test the behavior of other agents (like fluentbit) and treat vector more as a black box rather than relying on its internal metrics.
I expect to improve the UX of it some next week. The graphs could probably use some more love.
You can run the whole suite (currently just 3 tests) via:
$ VECTOR=/path/to/vector ./bin/run-concurrency-test-suite
This'll create one directory with a sub directory for each test. Again see the README updates for details.
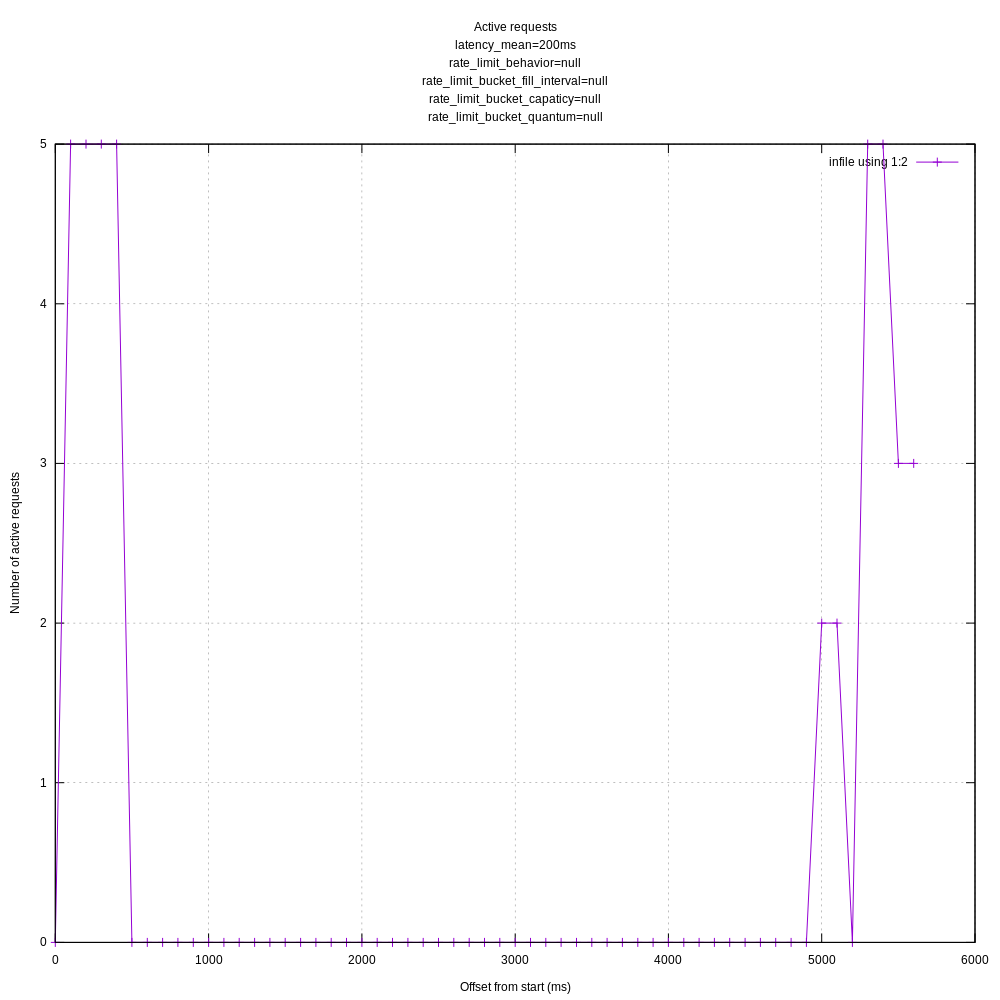
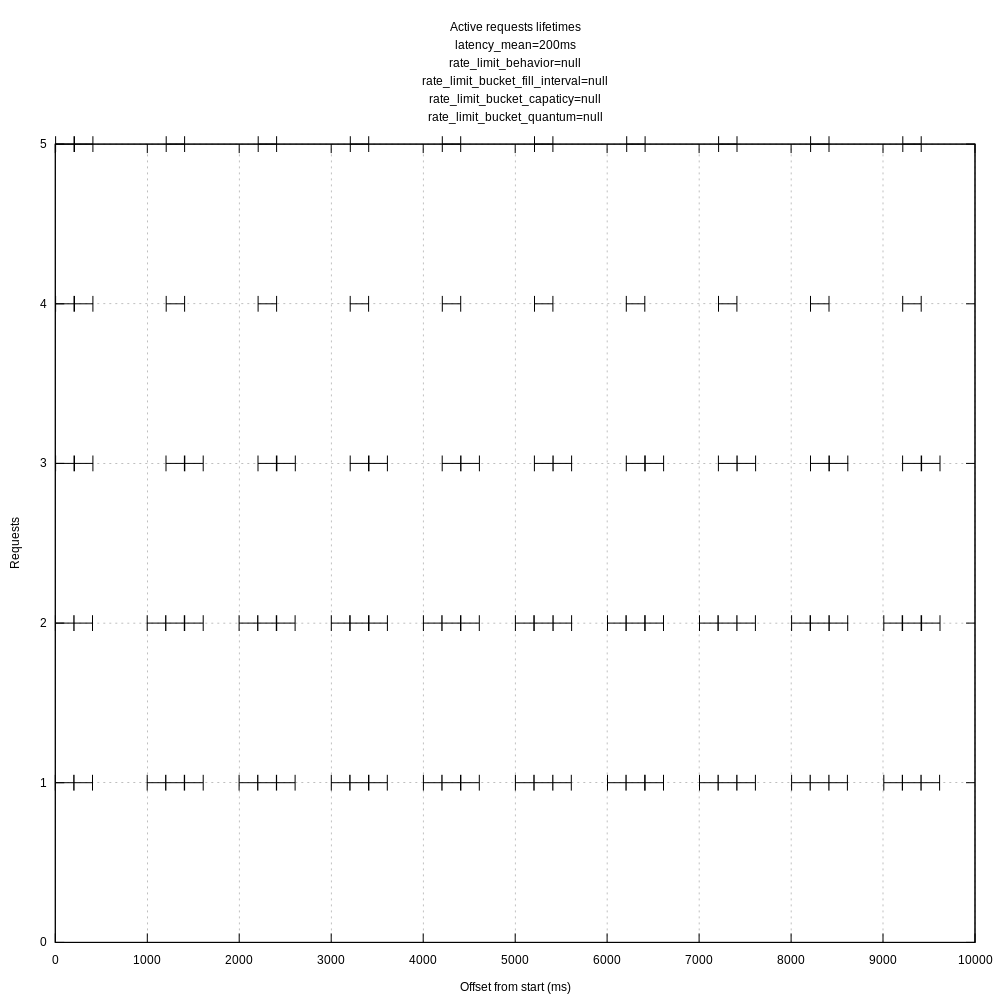
Initial test results
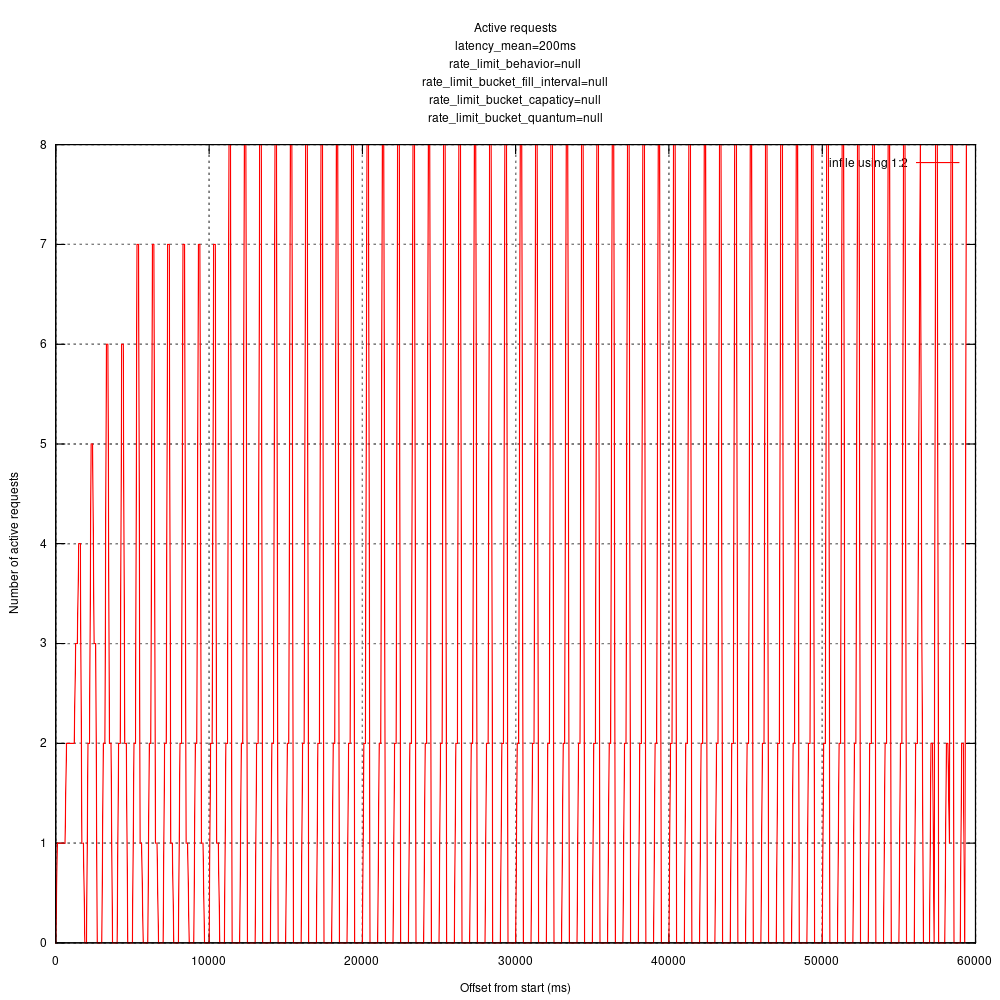
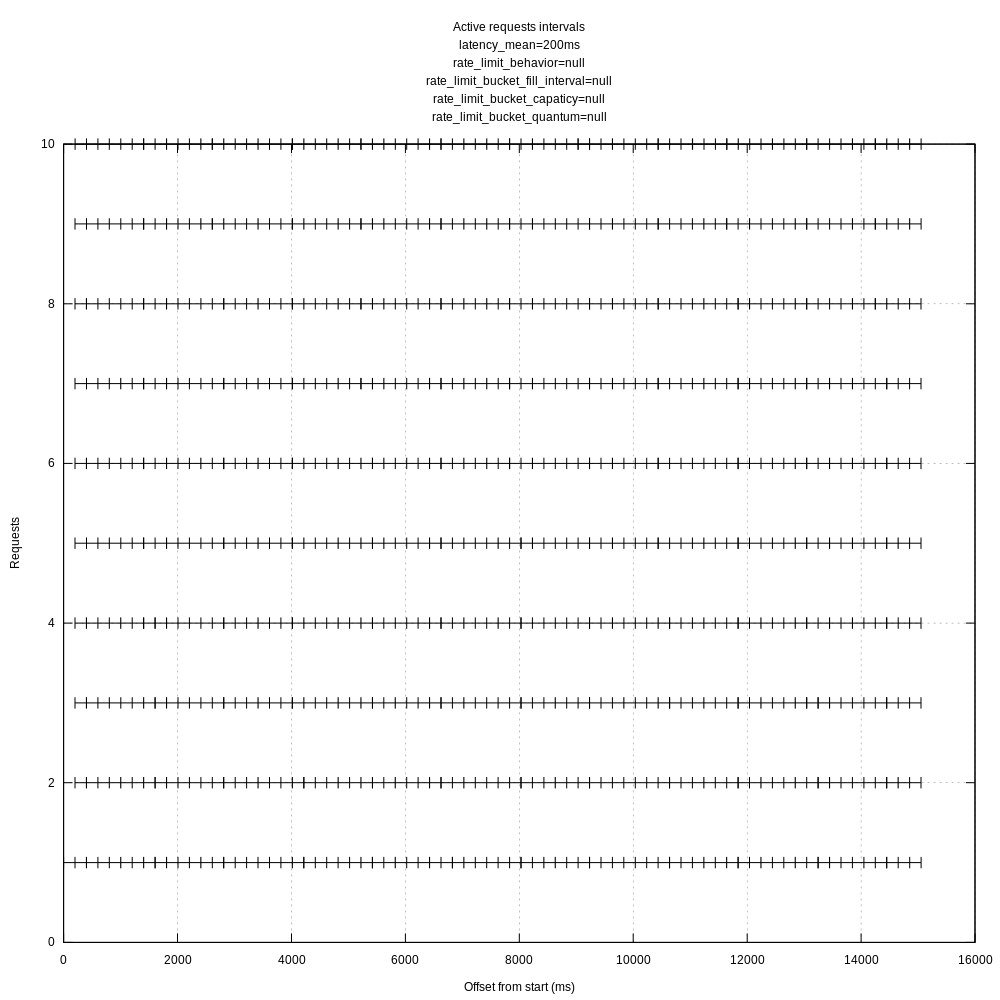
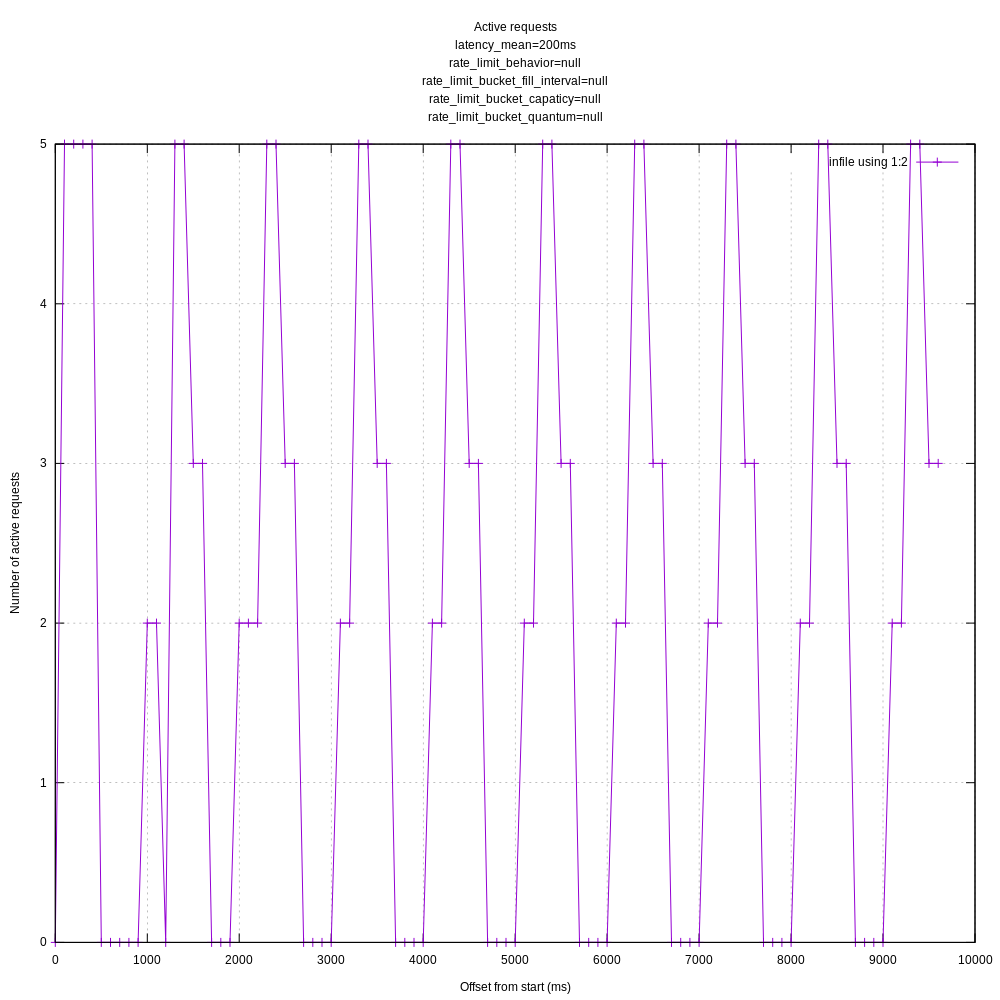
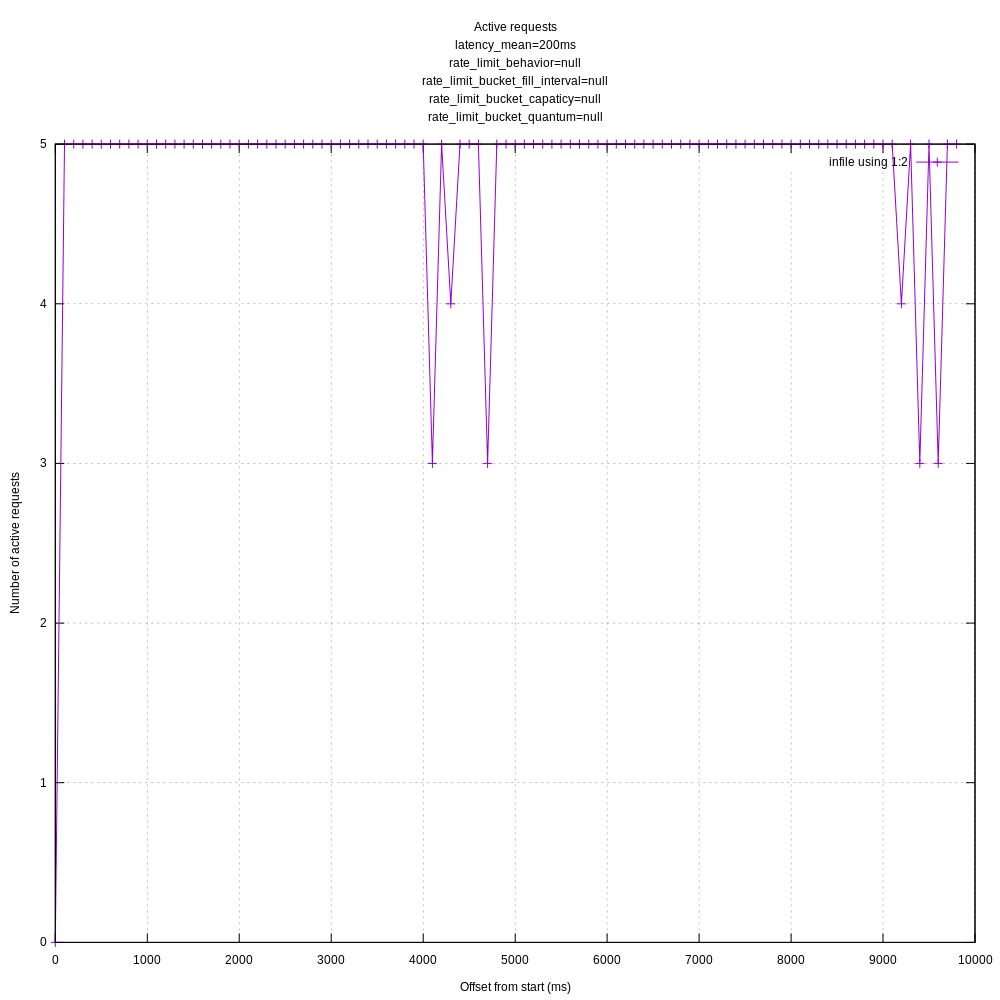
So, I'm getting the feeling that I am not configuring vector correctly for these tests as I'm currently seeing very spike-y behavior for the number of in-flight requests.
You can see the vector.toml I'm using here: https://github.com/timberio/http_test_server/blob/1f5bf65a8d49e913c703a70b7632b0f603f17697/bin/concurrency/vector.toml
Output graphs:
No rate limiting:

Hard rate limiting:
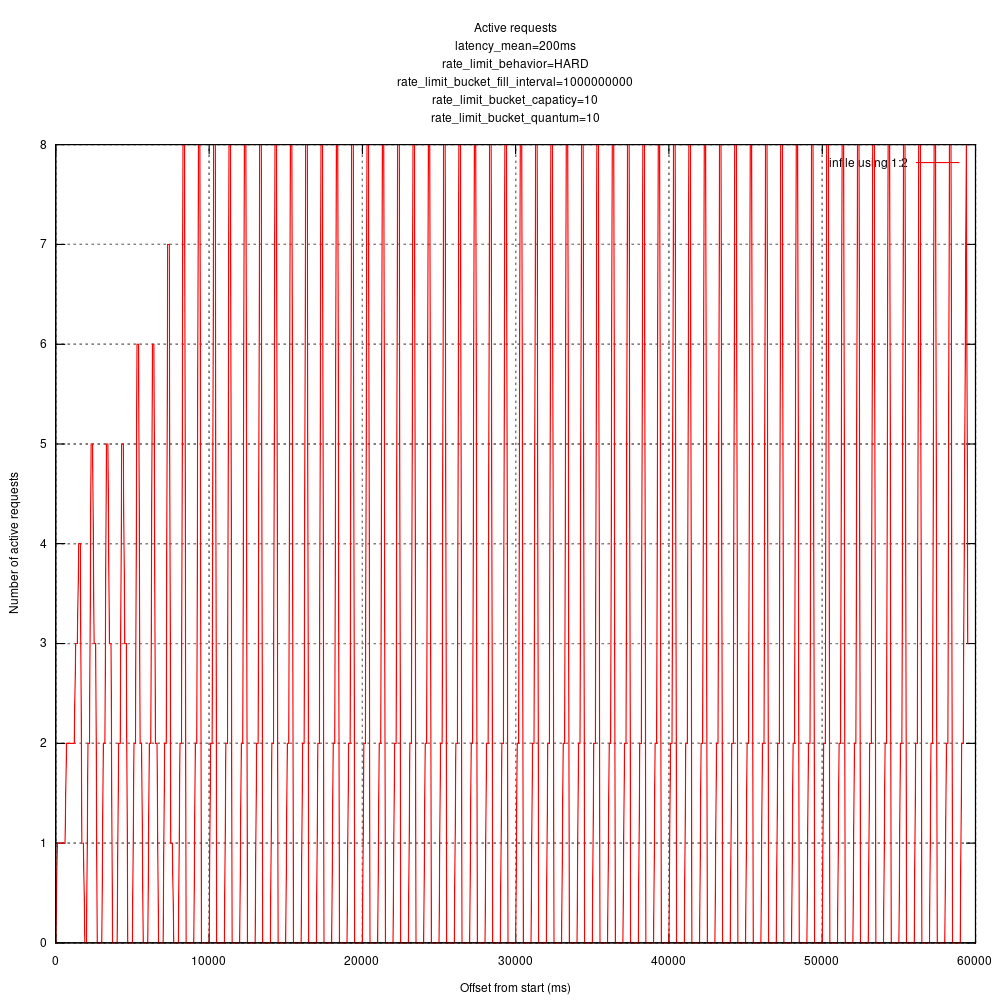
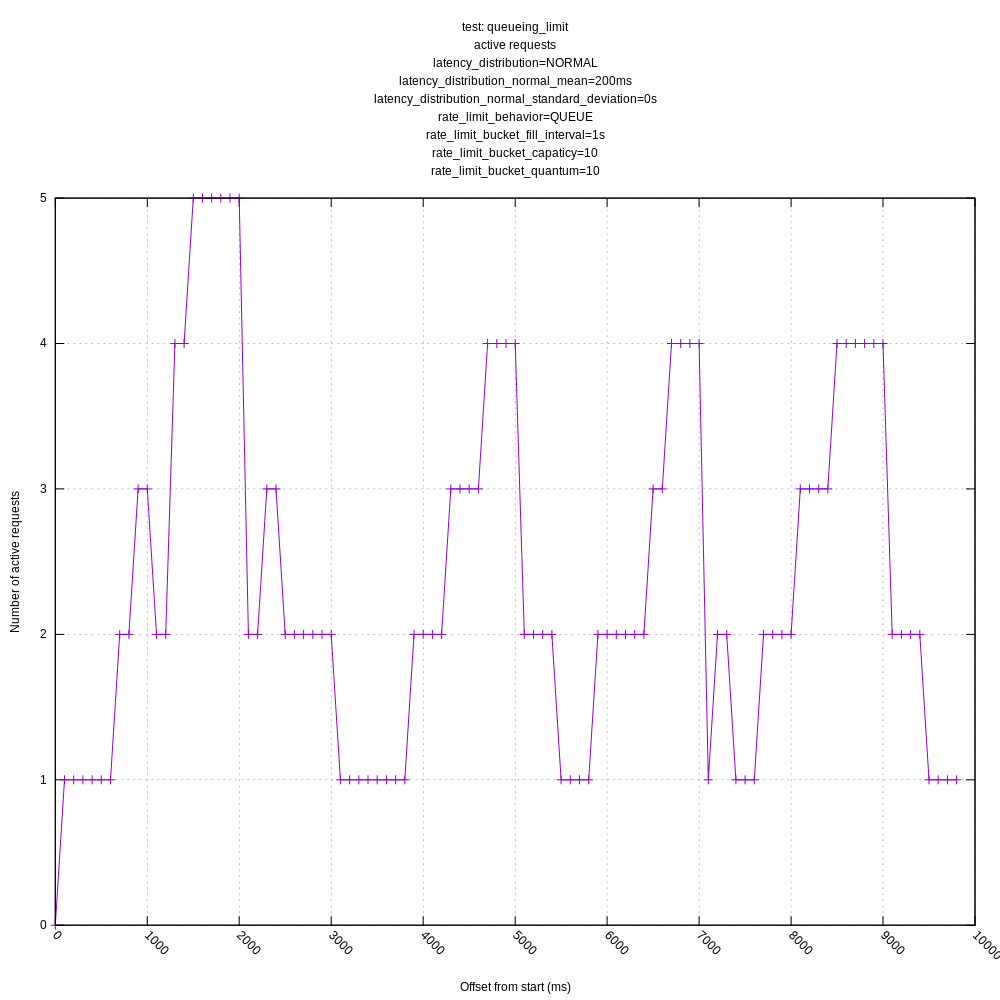
Queuing rate limiting:
I verified with apache bench which gives me some confidence in that my statistics recording and processing is working ok (there is a line you can uncomment to try it: https://github.com/timberio/http_test_server/pull/1/files#diff-0b14a49409216abc10ad1aaaa6778257R43).
Running with ab concurrency of 100, I get a graph like:
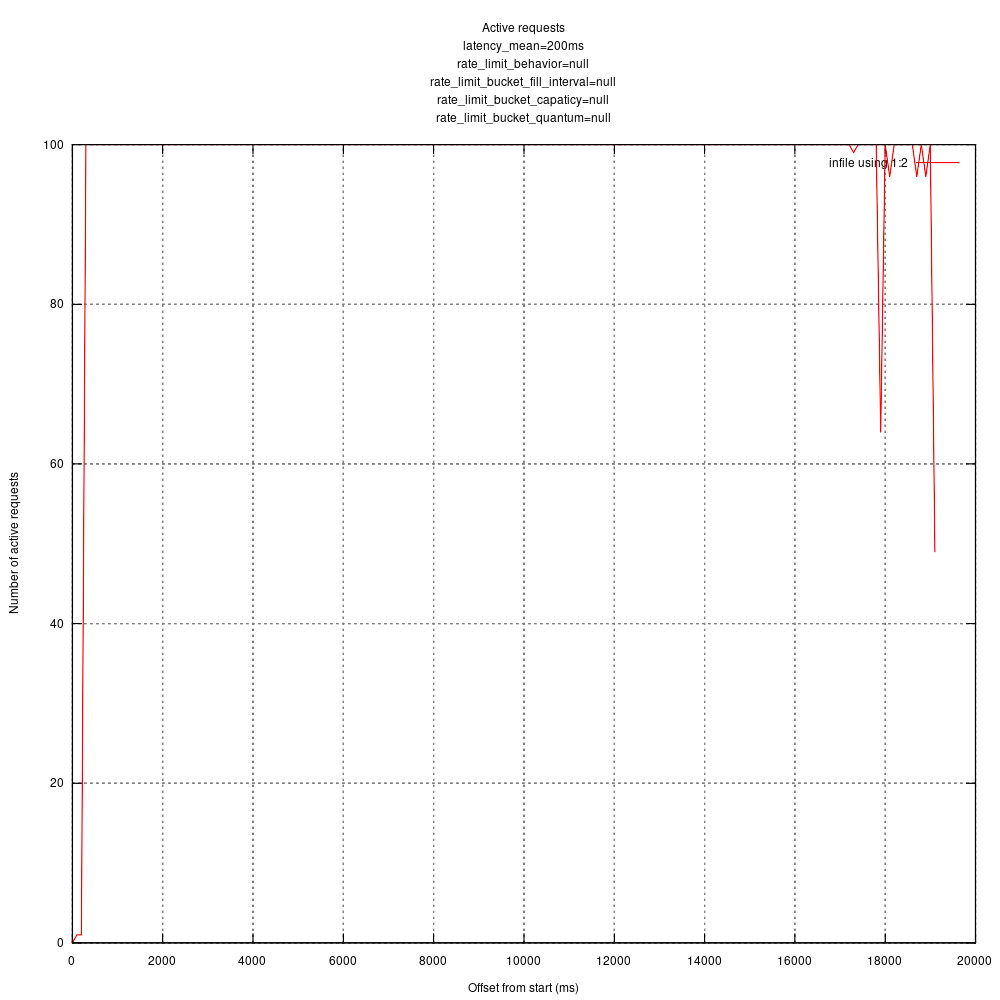
I'm curious what your thoughts are given your intimate familiarity with vector's concurrency. I'm guessing I might want to tweak some more vector config parameters.
jszwedko
on 15 Aug 2020
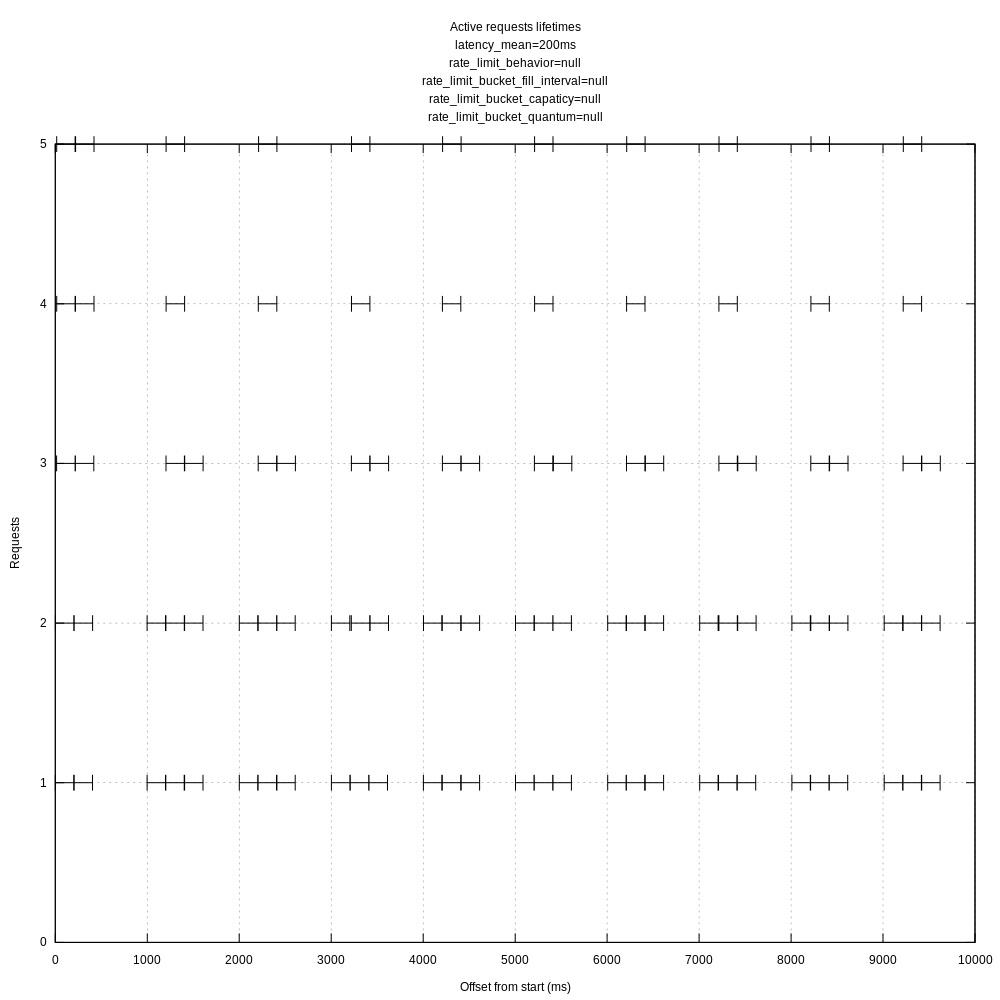
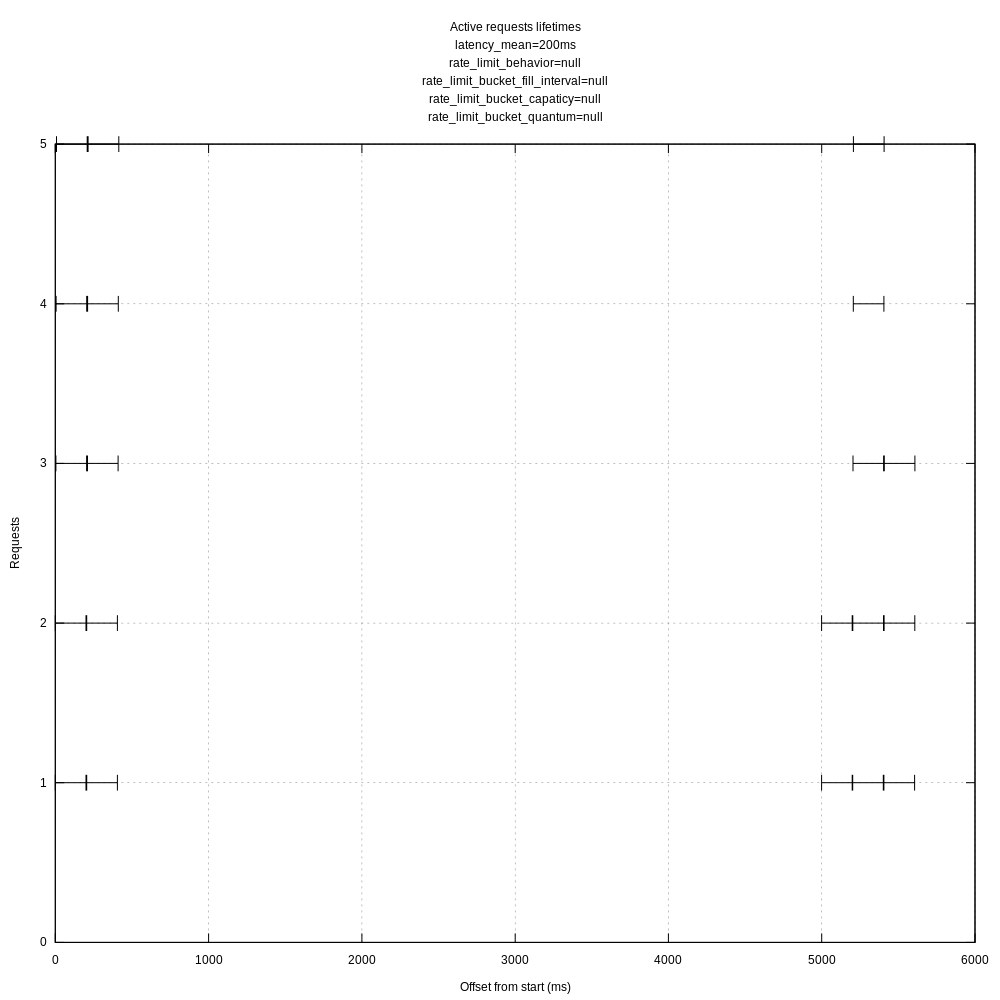
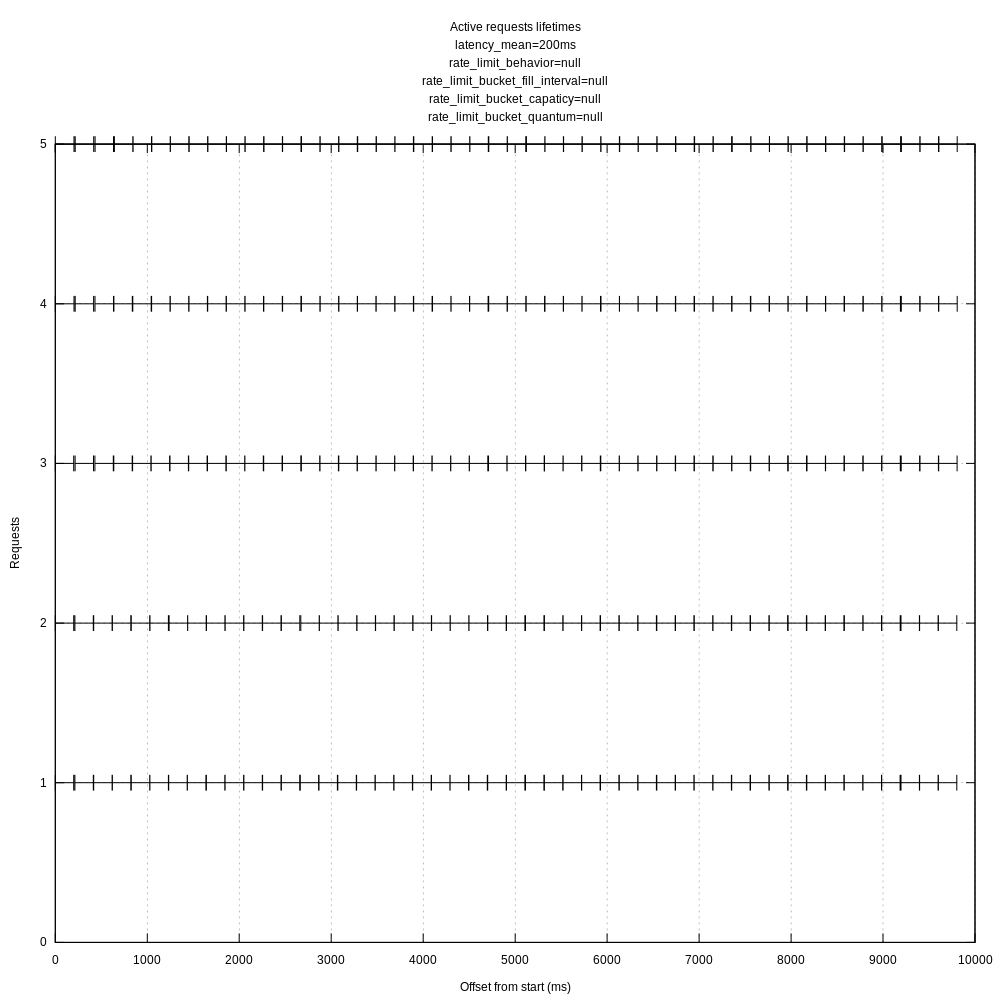
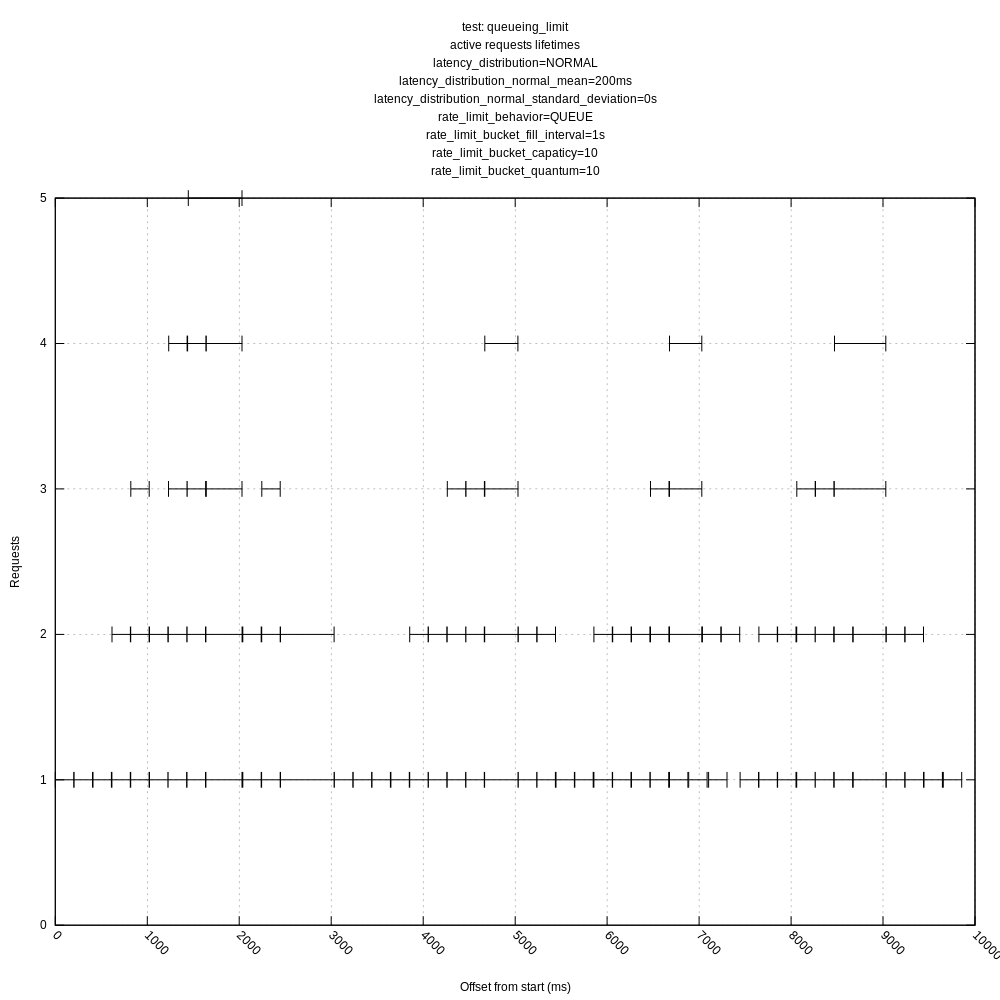
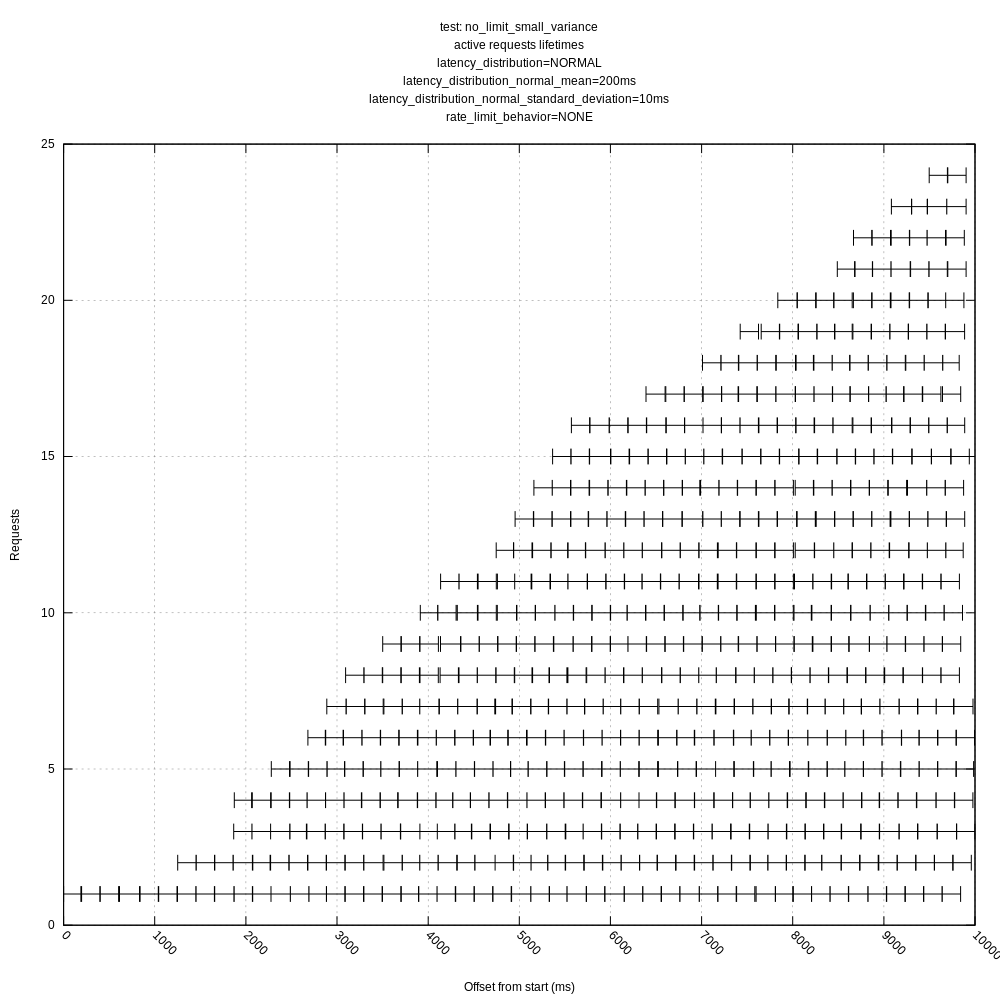
I created another view of the request data that I thought might be interesting, each request's lifetime as an interval.
vector with above config and no rate limit:
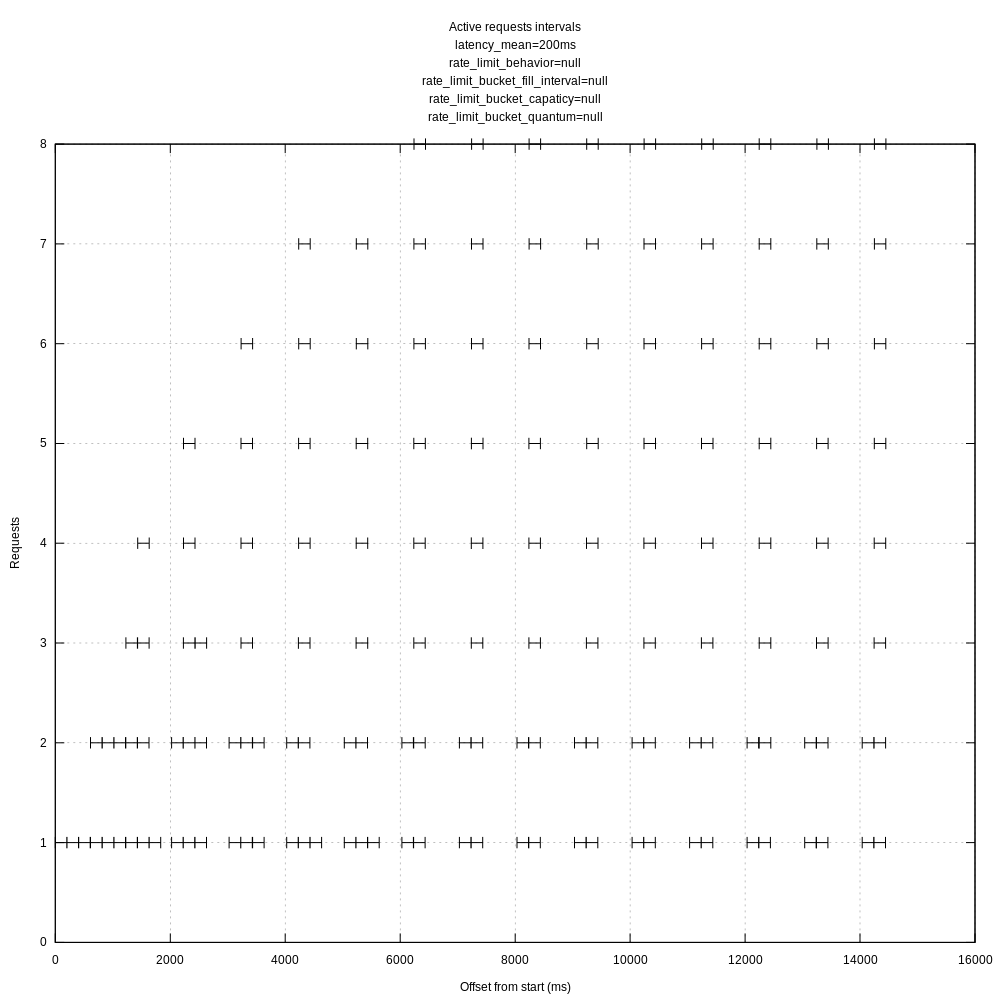
For reference, ab with a concurrency of 10 gives me:
I feel like this has something to do with batching and flushing reducing the overall throughput.
jszwedko
on 17 Aug 2020
A few things stand out immediately.
Vector does not handle HTTP 429 responses properly for concurrency limiting. See #3424. So I'm not surprised by the spiky graphs when you use that for limiting request rates. Obviously I will have to address that before we can progress much here. Even so, it's probably dropping too fast, caused by the hard-coded 0.5 decrease multiplier.
The graph for setting an explicit concurrency of 100 looks like what I'd expect when there is no remote limit—it goes to the maximum pretty much immediately and stays there the whole time. I'm curious why it doesn't go up to 100 faster, and what the little dips at the end are about, but otherwise it looks about right.
I don't see any options in the test harness for either dropping requests or for increasing latency under load (increasing concurrency). Are these conditions that we want to model, or are they not seen in real world servers?
This test scenario has a very large processing time relative to the network RTT. I imagine this will be a relatively common scenario with local servers. This might be the determinant of the unusual look of the request active graph, as each set of requests will be started and stopped at effectively the same time. In a more normal network under longer-term conditions, I would think even small amounts of network jitter would tend to spread those out more.
bruceg
on 18 Aug 2020
Thanks!
A few things stand out immediately.
1. Vector does not handle HTTP 429 responses properly for concurrency limiting. See #3424. So I'm not surprised by the spiky graphs when you use that for limiting request rates. Obviously I will have to address that before we can progress much here. Even so, it's probably dropping too fast, caused by the hard-coded 0.5 decrease multiplier.
Yeah, the spikes would be expected there.
2. The graph for setting an explicit concurrency of 100 looks like what I'd expect when there is no remote limit—it goes to the maximum pretty much immediately and stays there the whole time. I'm curious why it doesn't go up to 100 faster, and what the little dips at the end are about, but otherwise it looks about right.
The concurrency of 100 is actually using apache bench rather than vector, but I'll try vector at a fixed concurrency to see what that looks like. I think the slow start is just requests not starting all at the same time; the dips towards the end are odd though.
3. I don't see any options in the test harness for either dropping requests or for increasing latency under load (increasing concurrency). Are these conditions that we want to model, or are they not seen in real world servers?
I do expect to expand the test harness to cover more cases (including those two); I just started with these scenarios.
4. This test scenario has a very large processing time relative to the network RTT. I imagine this will be a relatively common scenario with local servers. This might be the determinant of the unusual look of the request active graph, as each set of requests will be started and stopped at effectively the same time. In a more normal network under longer-term conditions, I would think even small amounts of network jitter would tend to spread those out more.
Hmm, interesting. I'm not sure I completely understand, but I can add a parameter to artificially introduce small amounts of latency jitter and see what happens. I do think this ratio may not be too unusual on fast networks (locally or on a private network).
I still expect to add some parameters for controlling the variance of the artificial latency as well.
jszwedko
on 18 Aug 2020
Just noting that Bruce and I talked out-of-band about the weird behavior we are seeing with non-uniform concurrent requests.
We came up with the following action items:
Jesse:
- Try running Vector with fixed concurrency limit both higher and lower than rate limit
- Try rerunning with other parameters to see if I can affect the gap size we are seeing in-between request batches
Bruce:
- Looking into handling 429s and other non-successful request outcomes
jszwedko
on 18 Aug 2020
Tried out a fixed concurrency limit of 5 in-flight requests. I ran the tests for 10s to try to make the graphs more legible.
When lower than the hard rate limit (30 requests / s):
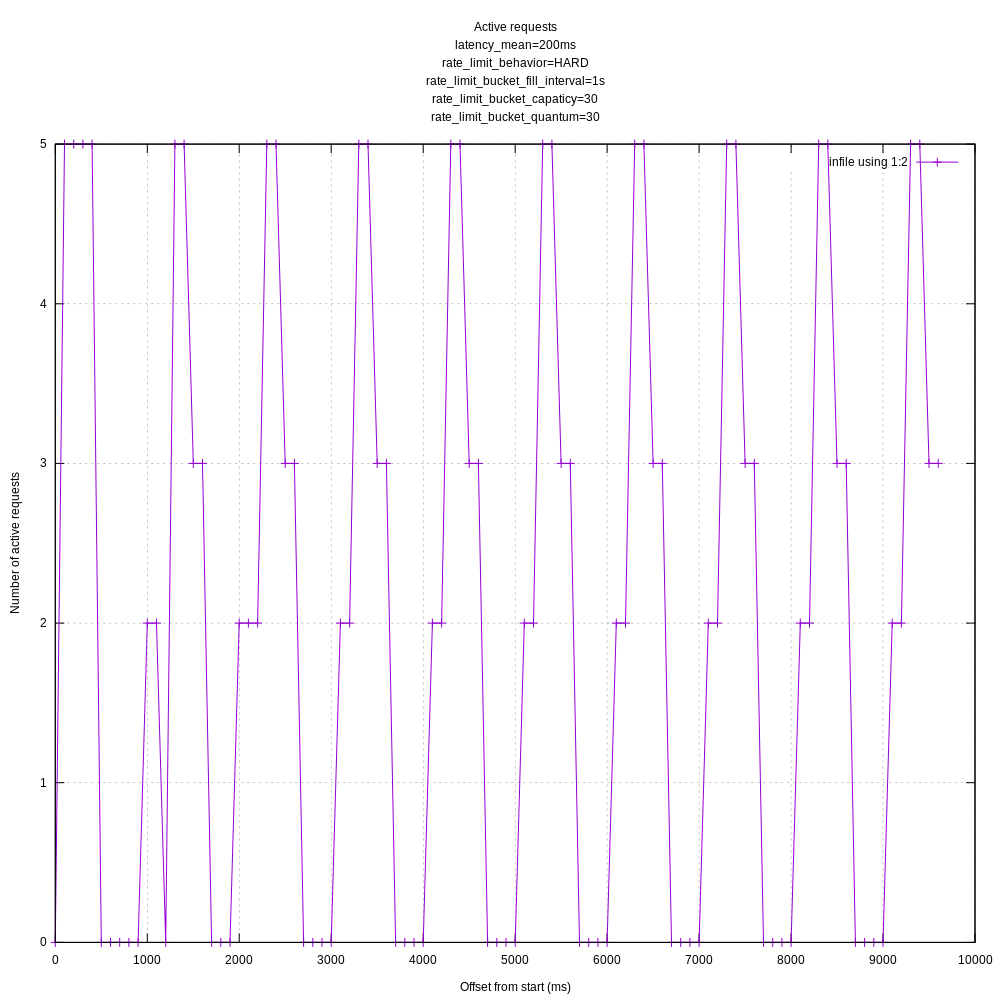
When higher than the hard rate limit (5 reqs / sec):
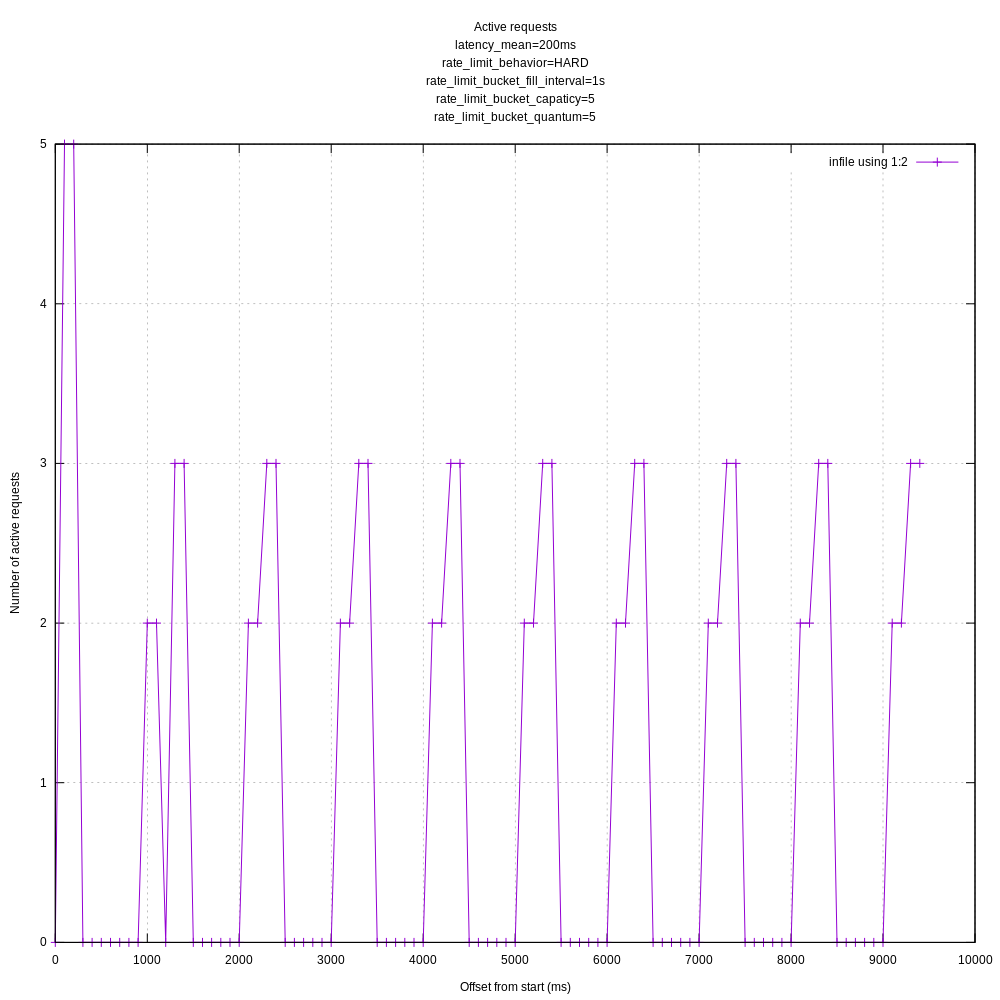
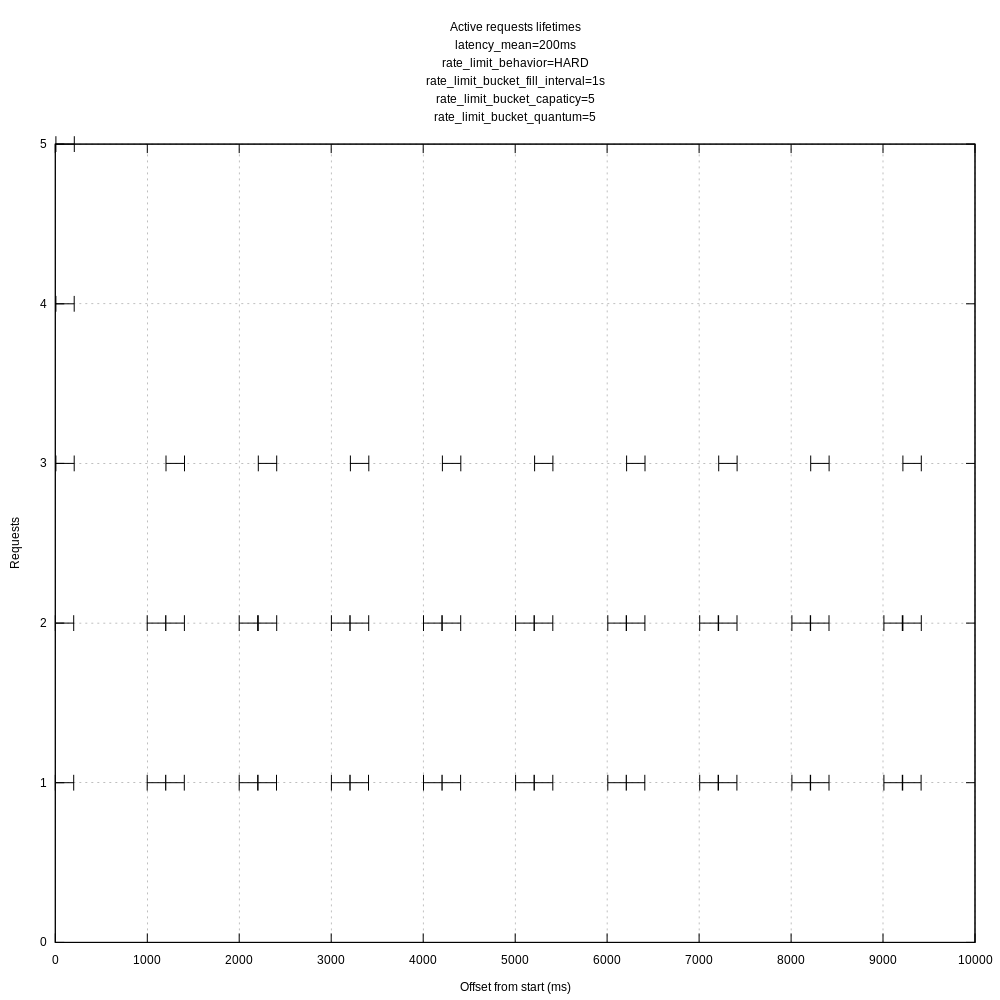
The requests receiving a 429 are filtered out from these plots.
The requests do seem oddly tied to 1s intervals. I'll try playing with the batch timeout to see if that makes a difference even though it shouldn't.
jszwedko
on 18 Aug 2020
That's really ugly. Any chance of testing Vector before this was merged, say at 07c4448955a05350eb1a3e8b277c0b56a43cc635? I kept around my pre-squash branch. I might have to play with the sequence of changes to see where it all went so bad.
bruceg
on 18 Aug 2020
I can give that a shot. I think I found the culprit though: request.rate_limit_duration_secs.
I hadn't set that in my test TOML because I thought it was ignored if in_flight_limit was set, but that appears to not be the case. If I set rate_limit_duration_secs to 5 I get a graphs like:
I'm not sure if that parameter should also apply if in_flight_limit is set, but even if it should, the defaults seem like they should have allowed more requests than they did:
rate_limit_duration_sec: 1
rale_limit_num: 1000
jszwedko
on 18 Aug 2020
This behavior seems the same with before your changes. At 07c4448 I see:
When leaving the rate_limit_duration_sec at its default of 1.
jszwedko
on 18 Aug 2020
Oh, of course, I forgot that layer. The rate limit layer wraps the concurrency layer, so they operate separately, even though they are configured in the same structure. That fits with its behavior of allowing so many requests before pausing. I'd configure rate_limit_num to a very high number to ensure that doesn't impact the other tests. We might consider to automatically set rate_limit_num internally to its max value when in_flight_limit = "auto".
bruceg
on 18 Aug 2020
:+1: I think I'm still missing something though. rale_limit_num defaults to 1000 and rate_limit_duration_sec to 1 which should allow 1000 requests/s, but here we see we are only getting 10 when I set in_flight_limit to 5. These parameters aren't playing together in quite the way I'd expect.
jszwedko
on 18 Aug 2020
Ah! I see the default is actually 10 in the code:
The docs say 1000:
I think you are right then, that seems to be it.
jszwedko
on 18 Aug 2020
This is related to the issue I just opened #3491 . I think we could consider not having any defaults for rate_limit_num. I think it could still logically be set even if in_flight_limit is set to auto to provide a hard cap.
jszwedko
on 18 Aug 2020
Yep, looking much better once I set rate_limit_num to a higher value:
I'll aim to rerun the existing and new scenarios today.
jszwedko
on 19 Aug 2020
I added a couple of more controls to the test server including:
- Introducing variance using a normal distribution
- Rate limiting via early connection closing (to simulate errors)
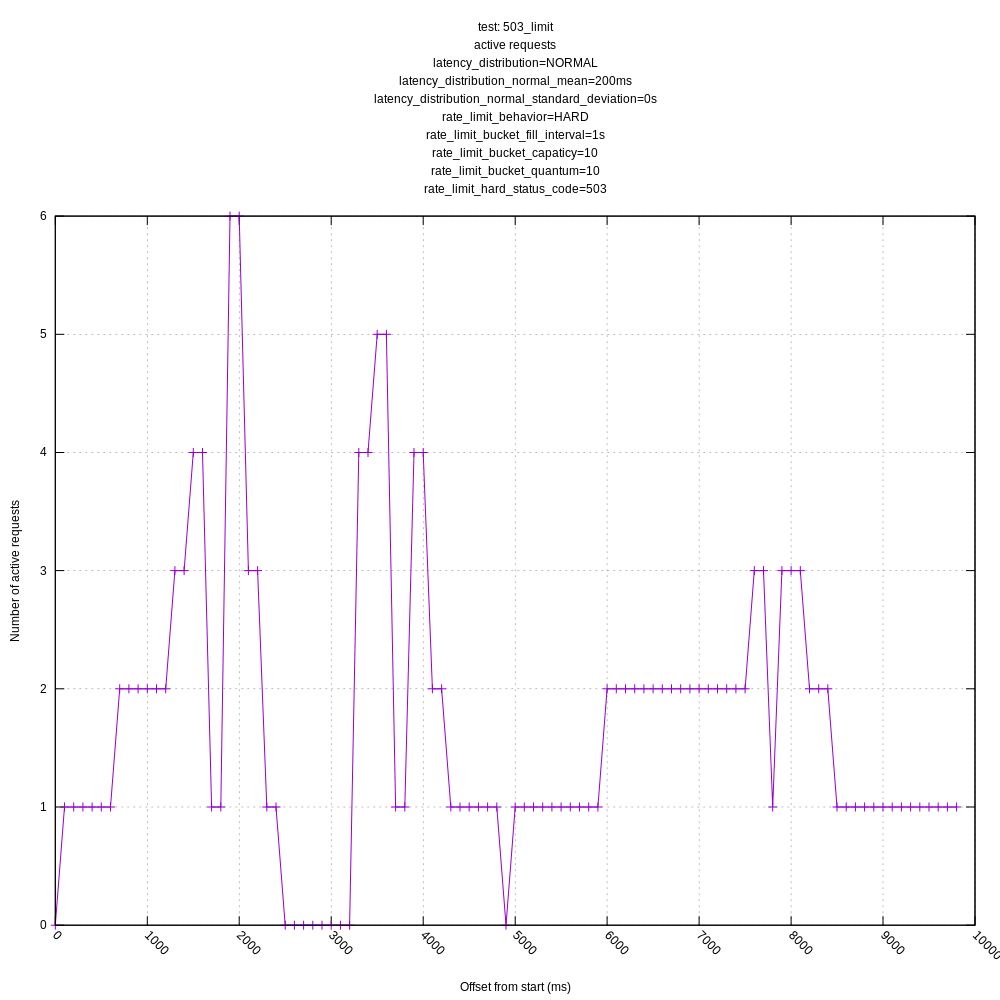
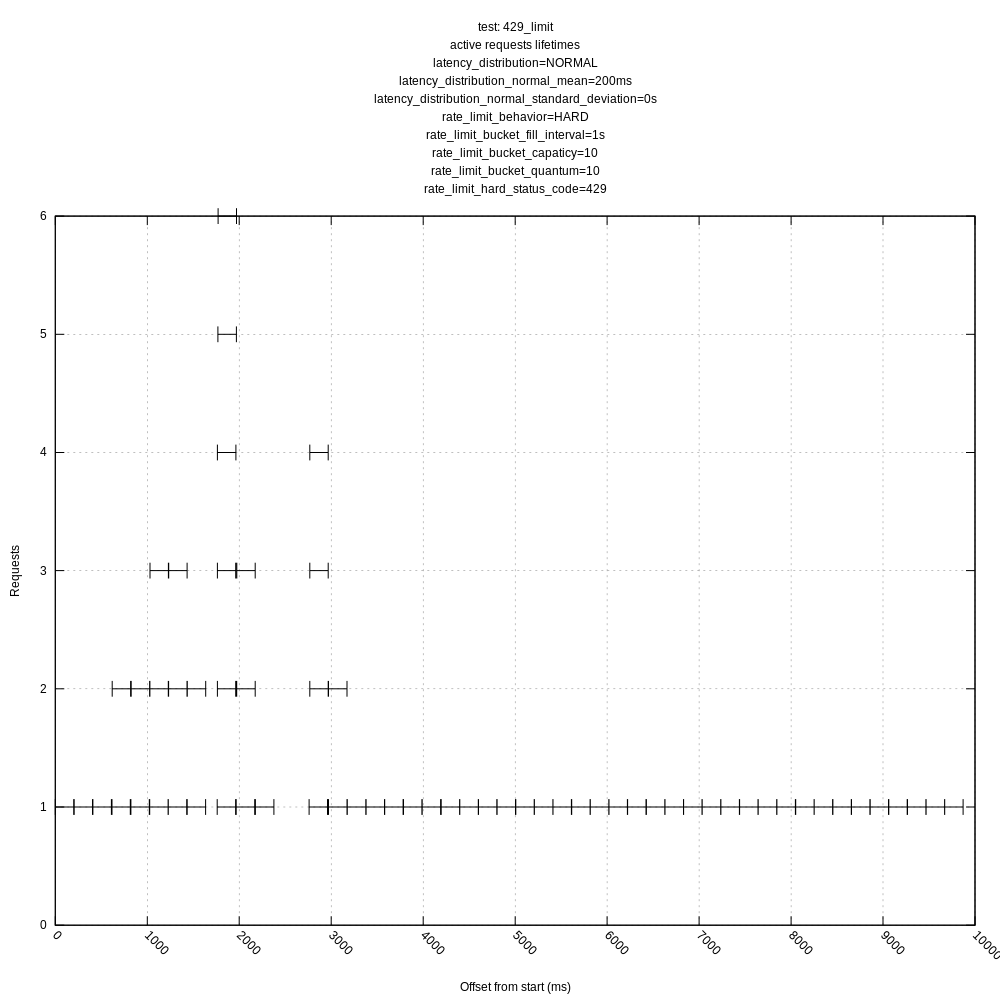
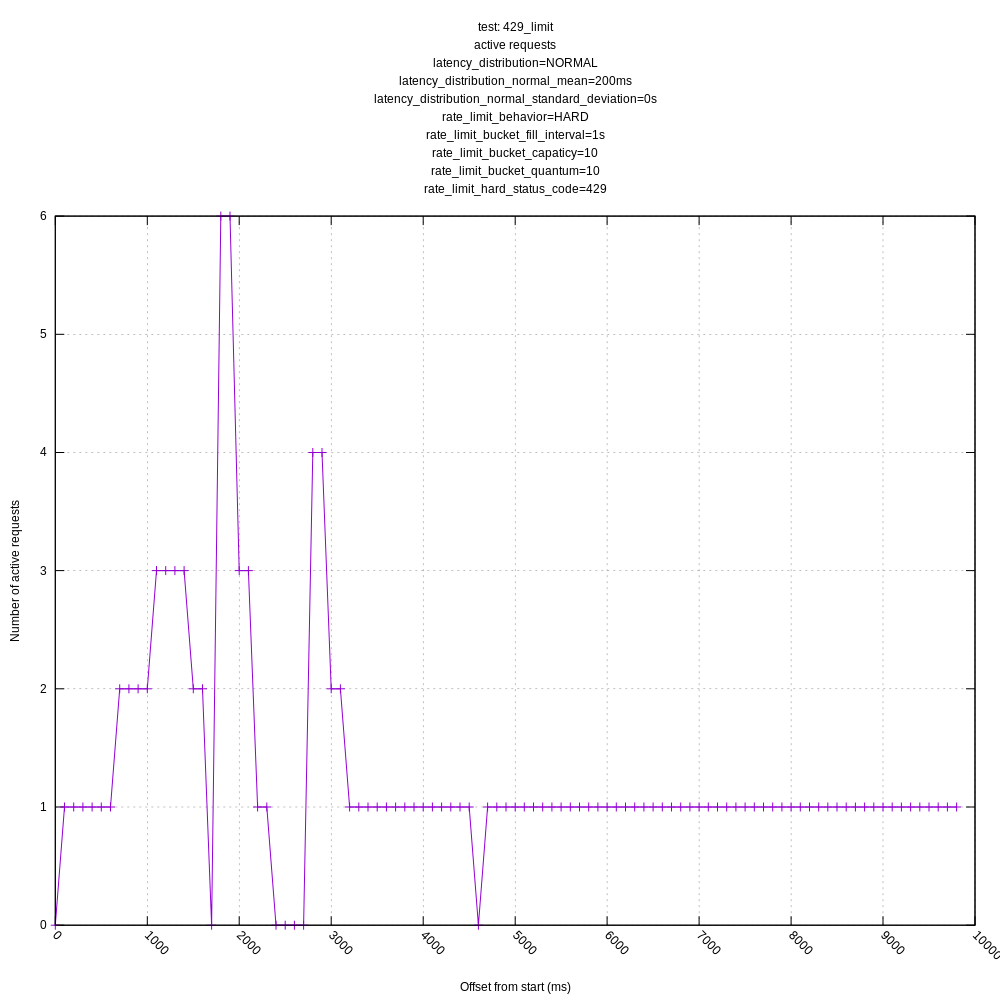
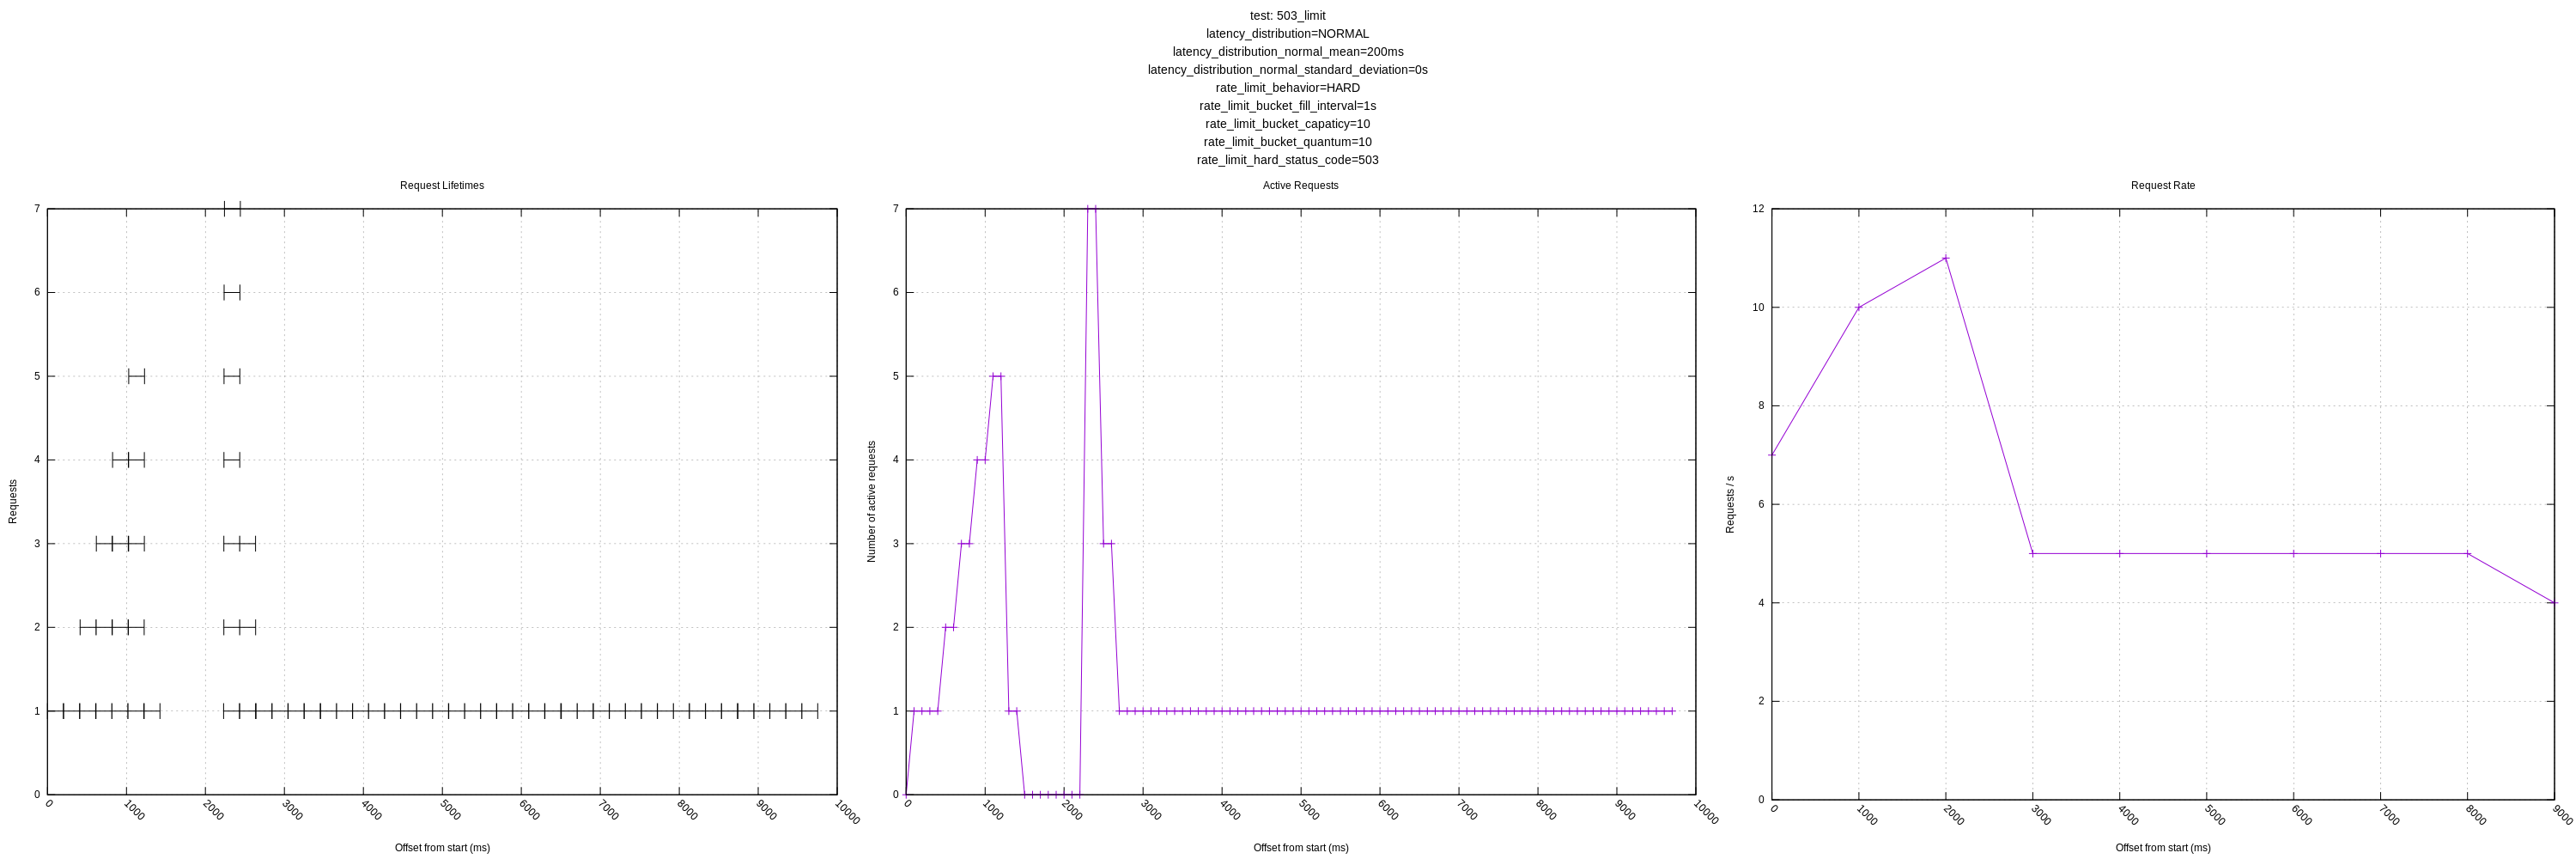
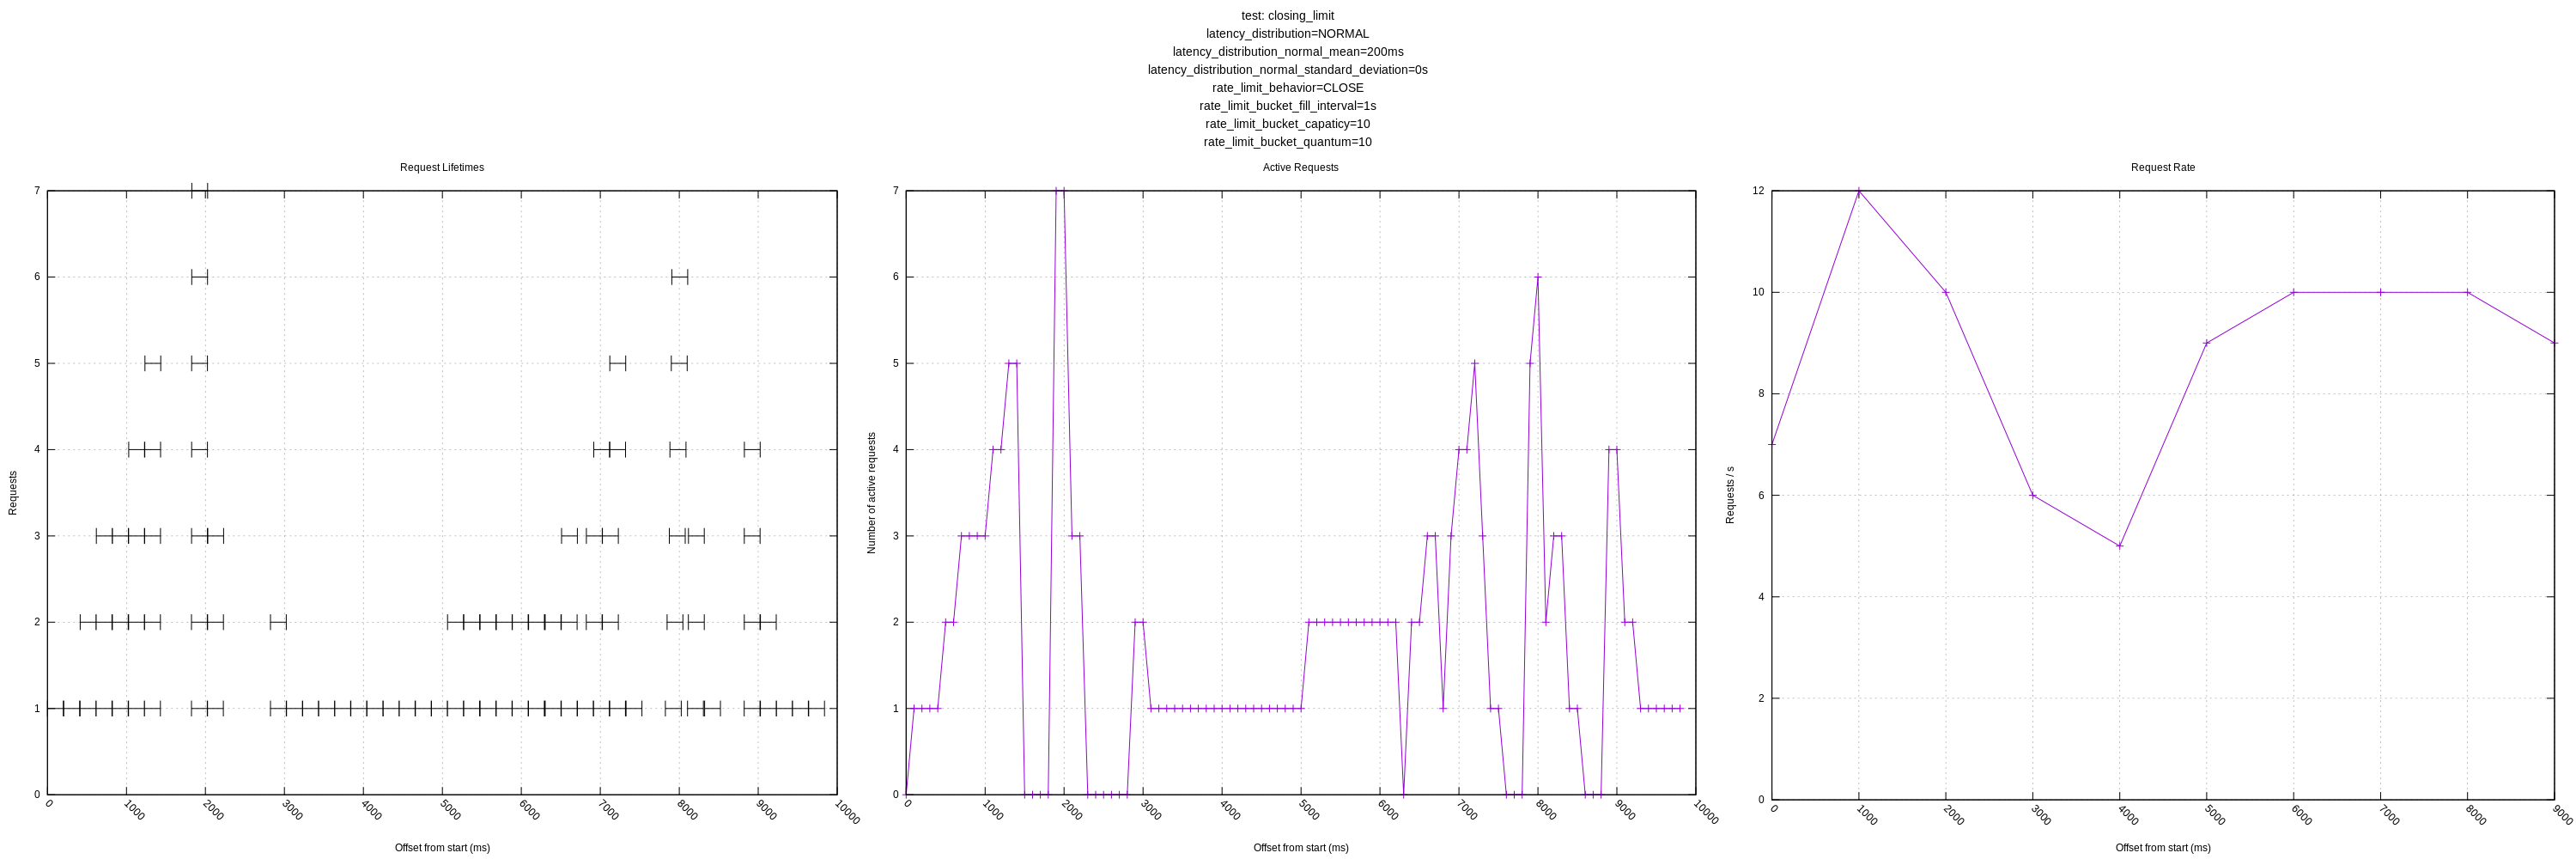
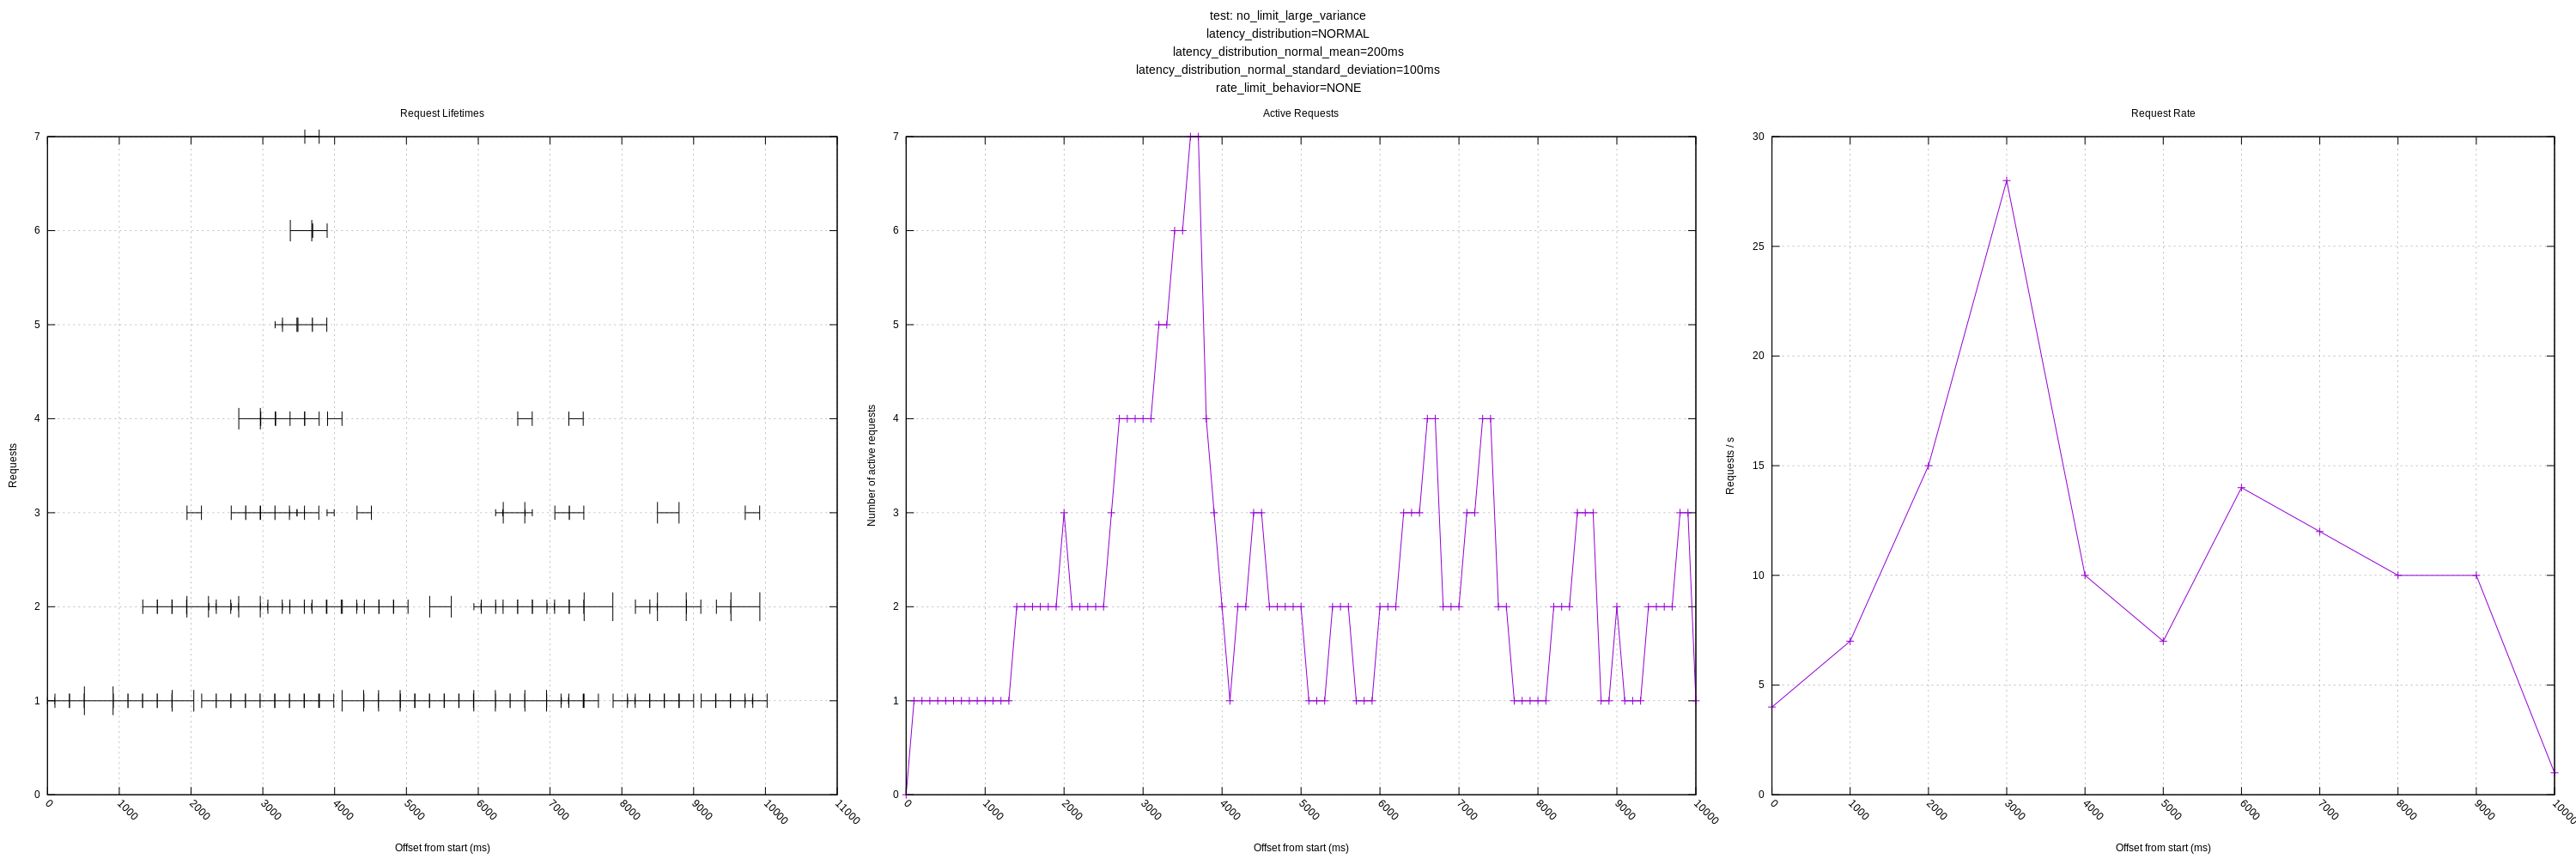
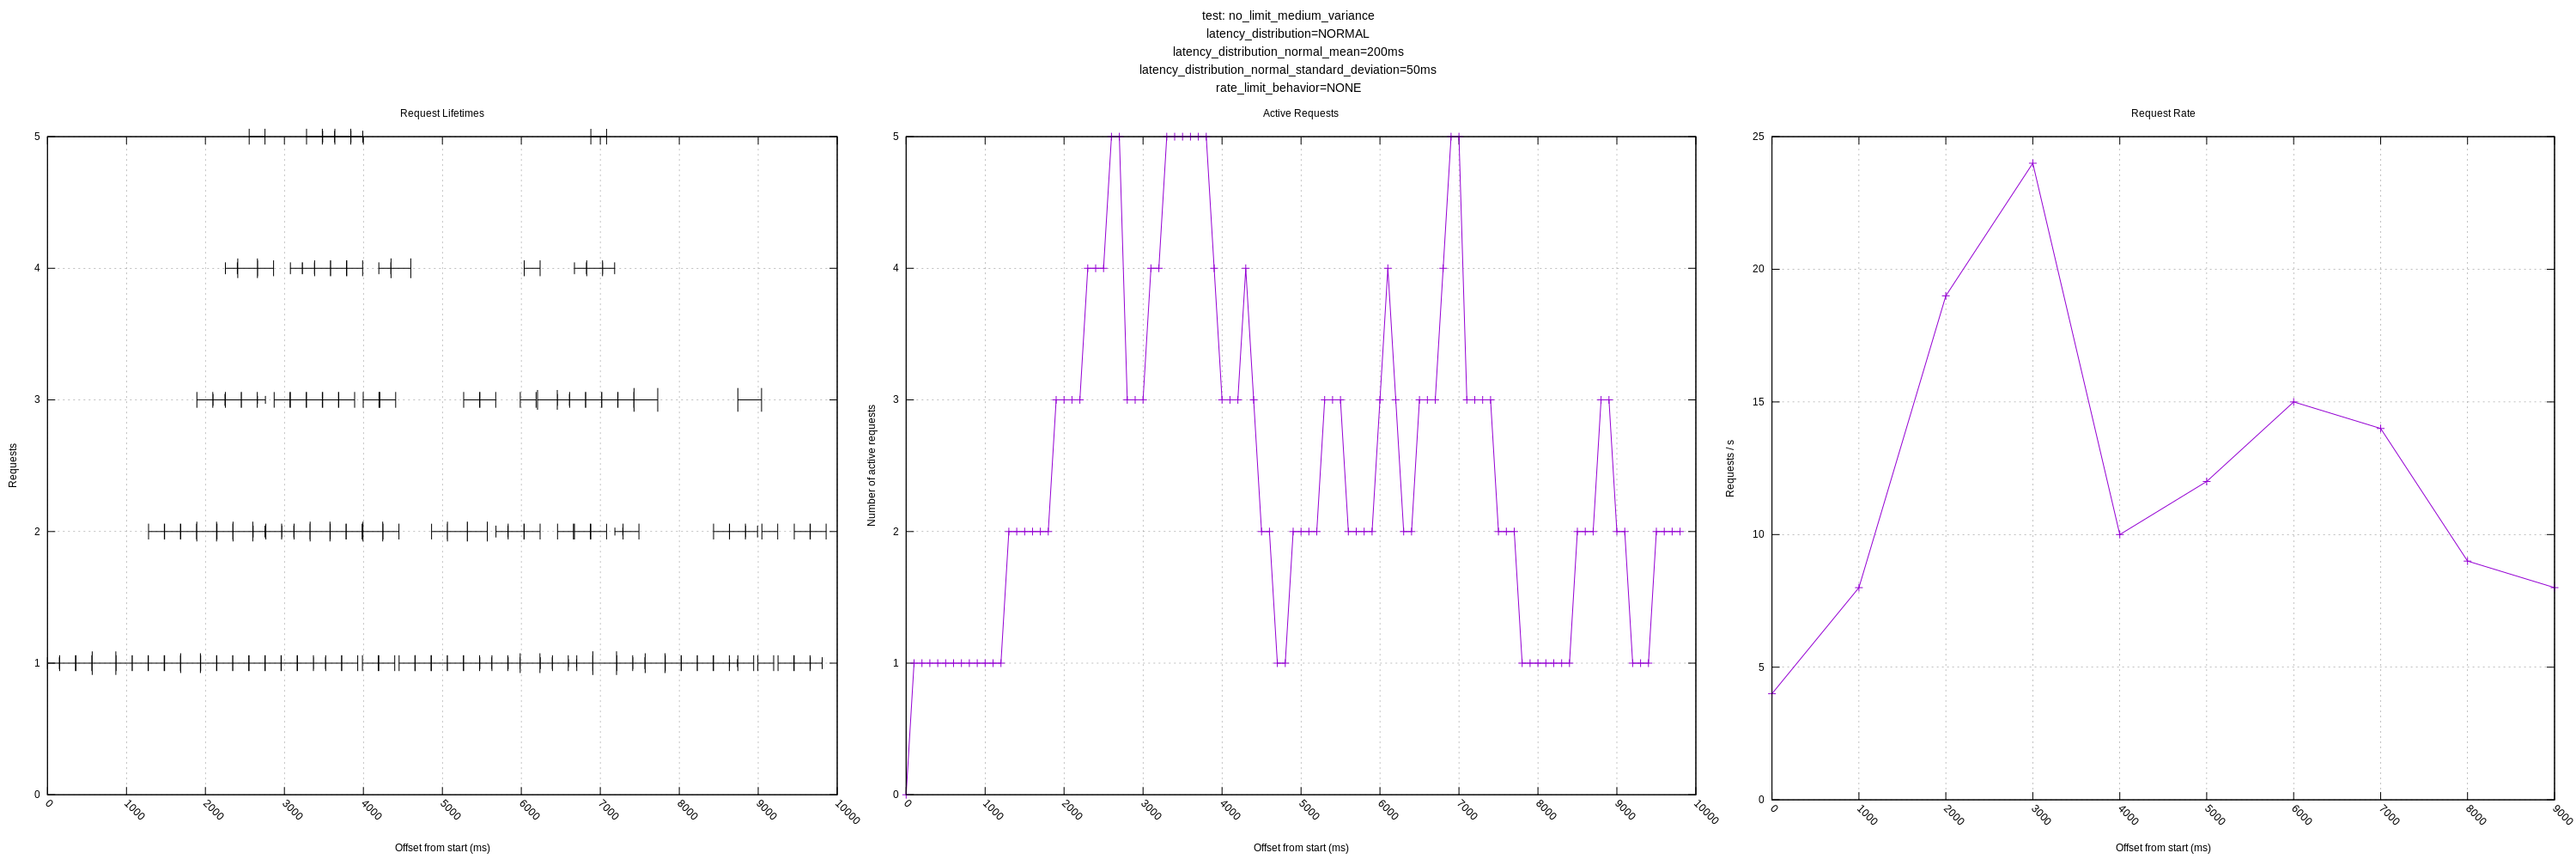
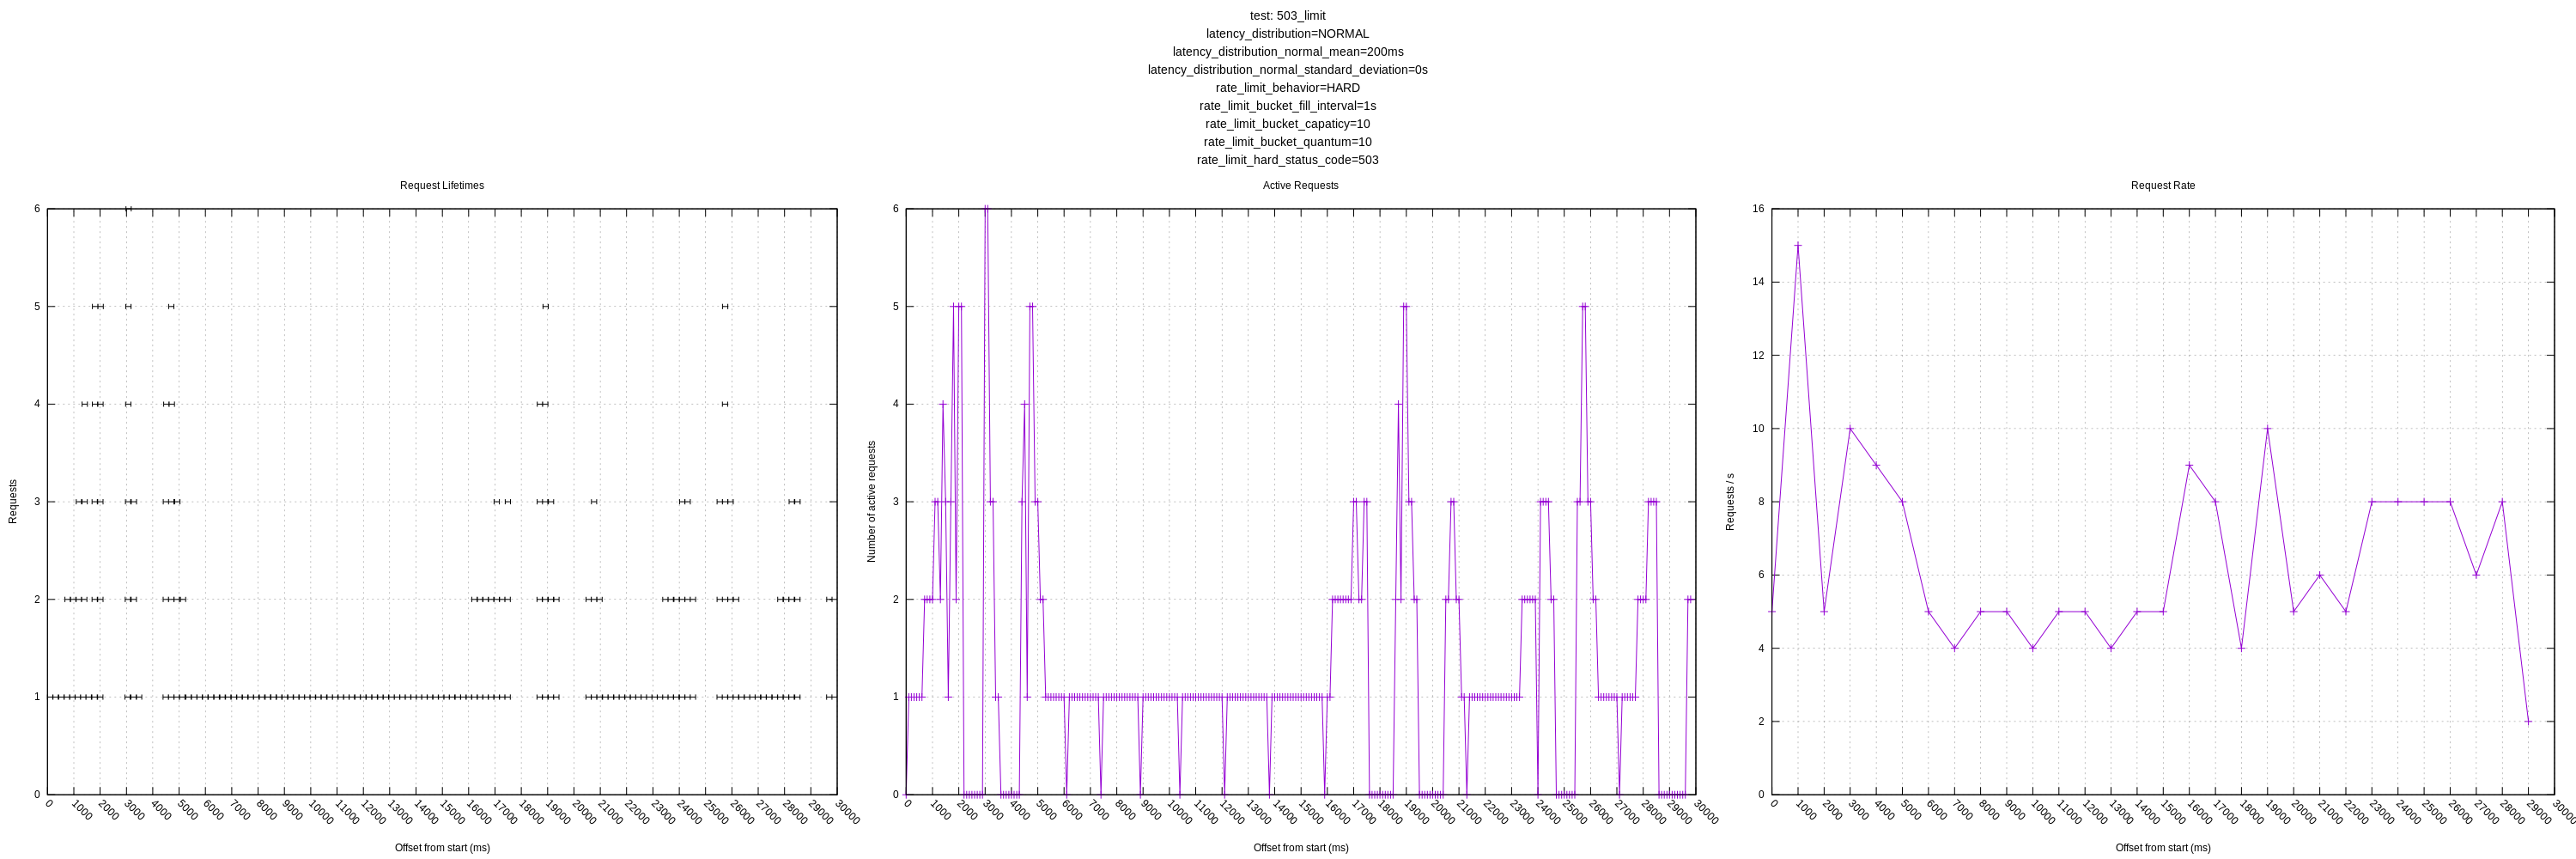
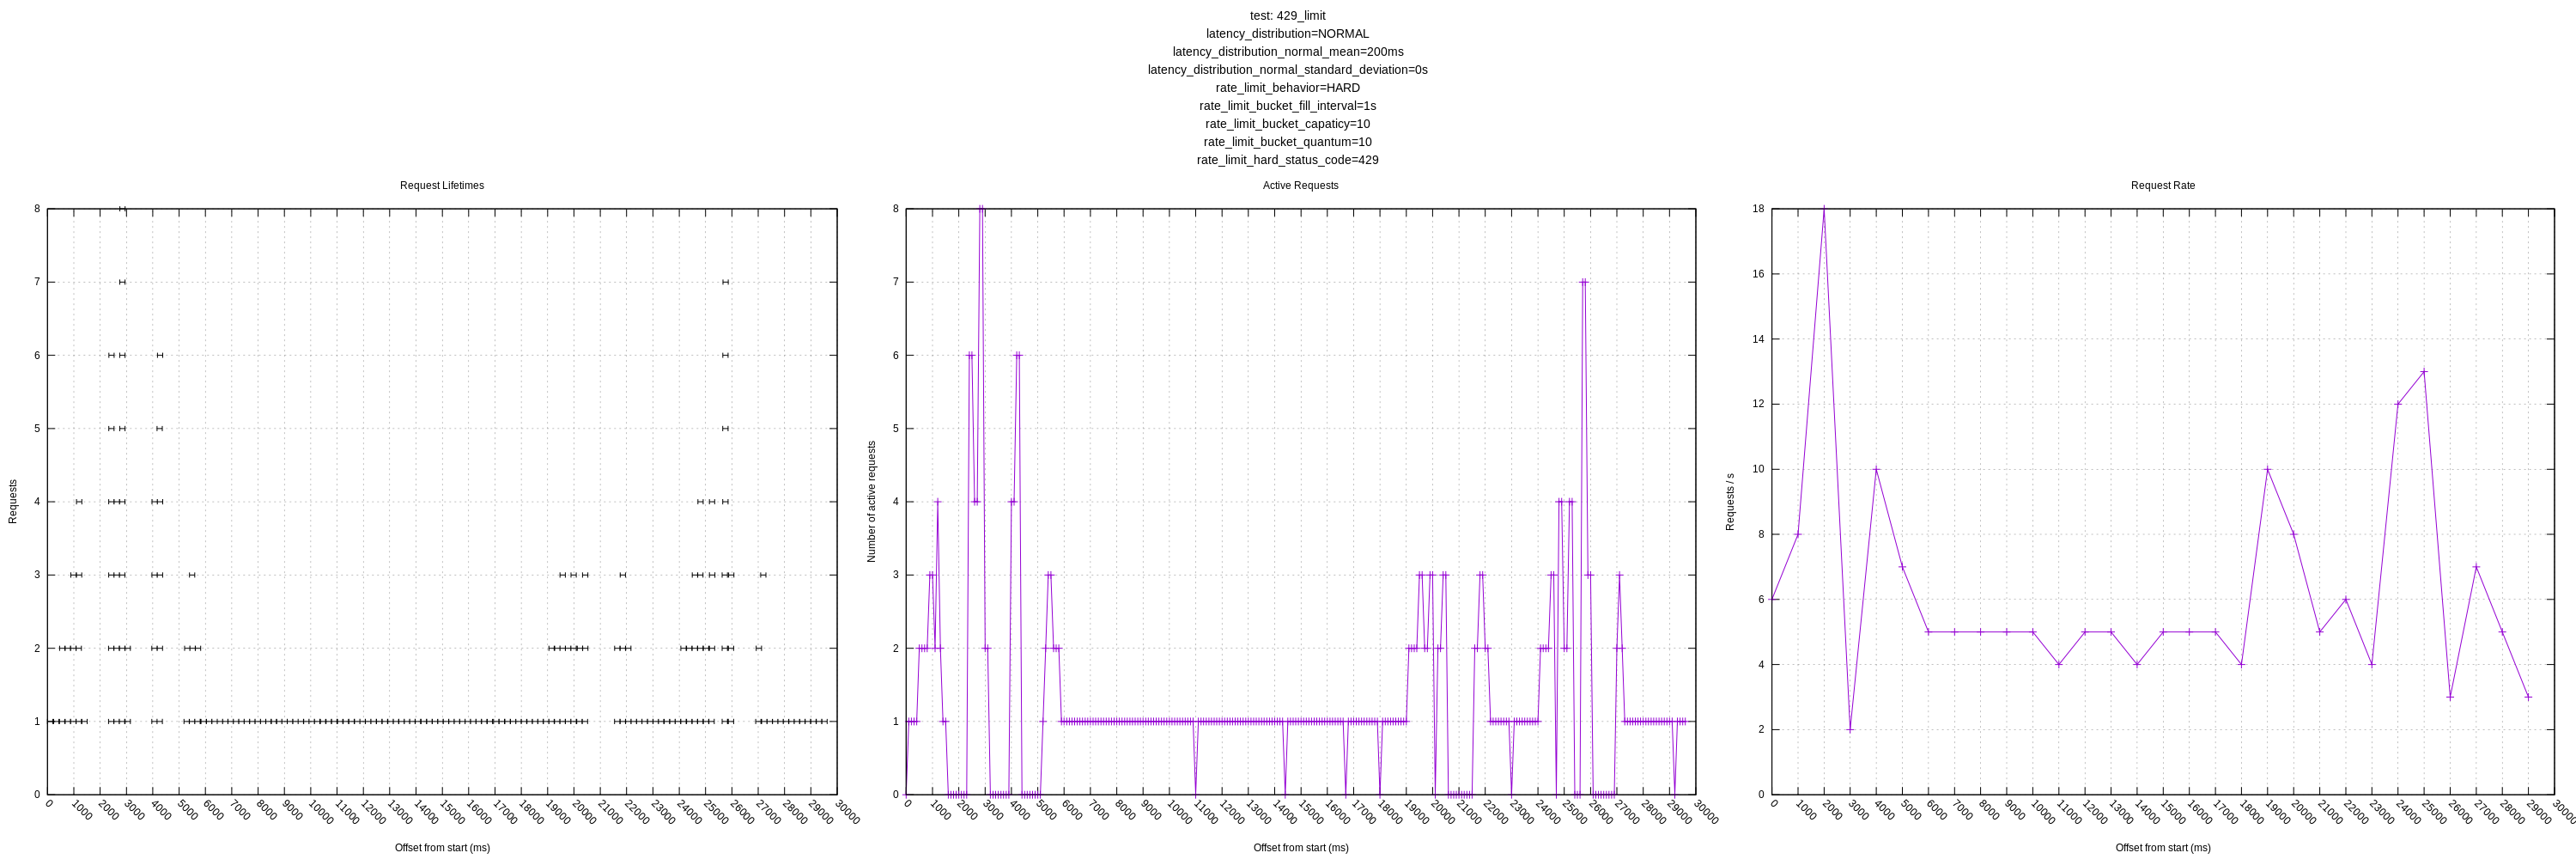
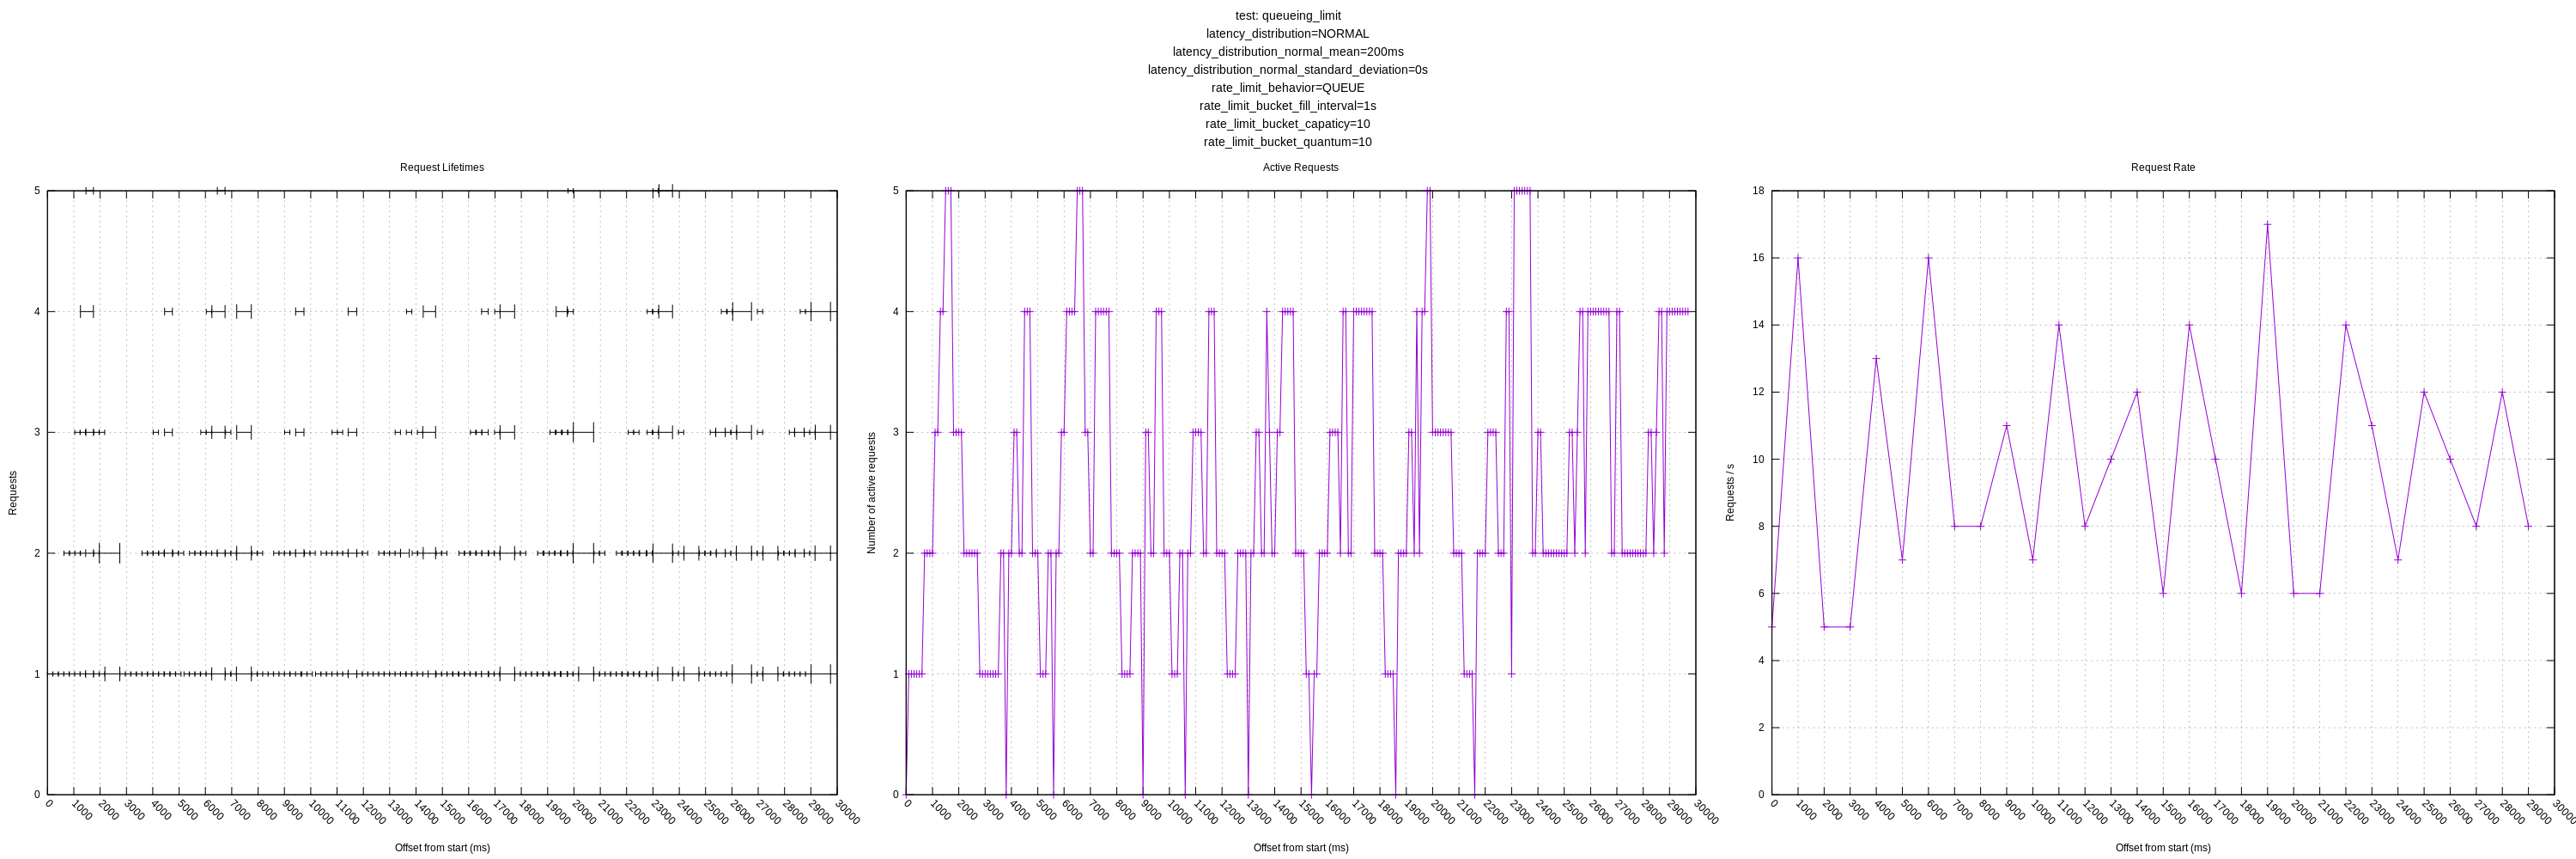
- Augmenting the hard rate limiter to also be able to return other error codes to test the behavior of things like 503s
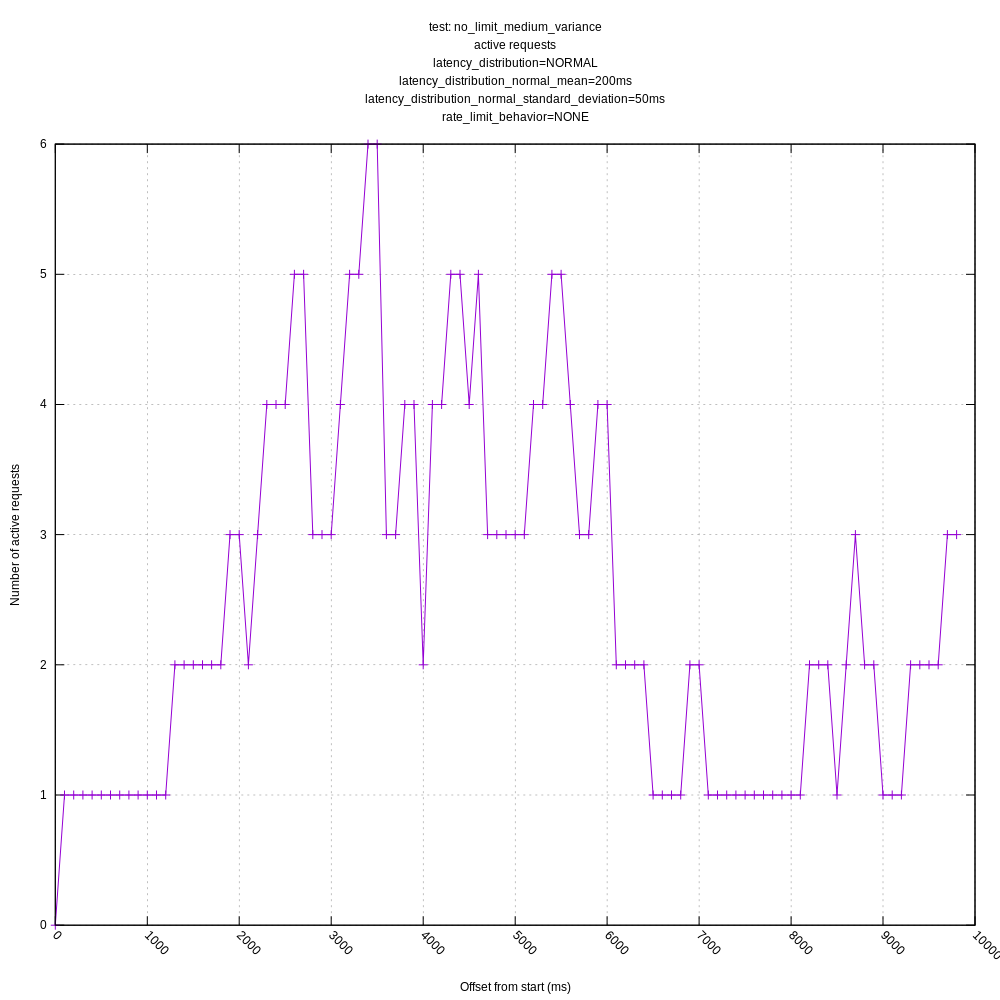
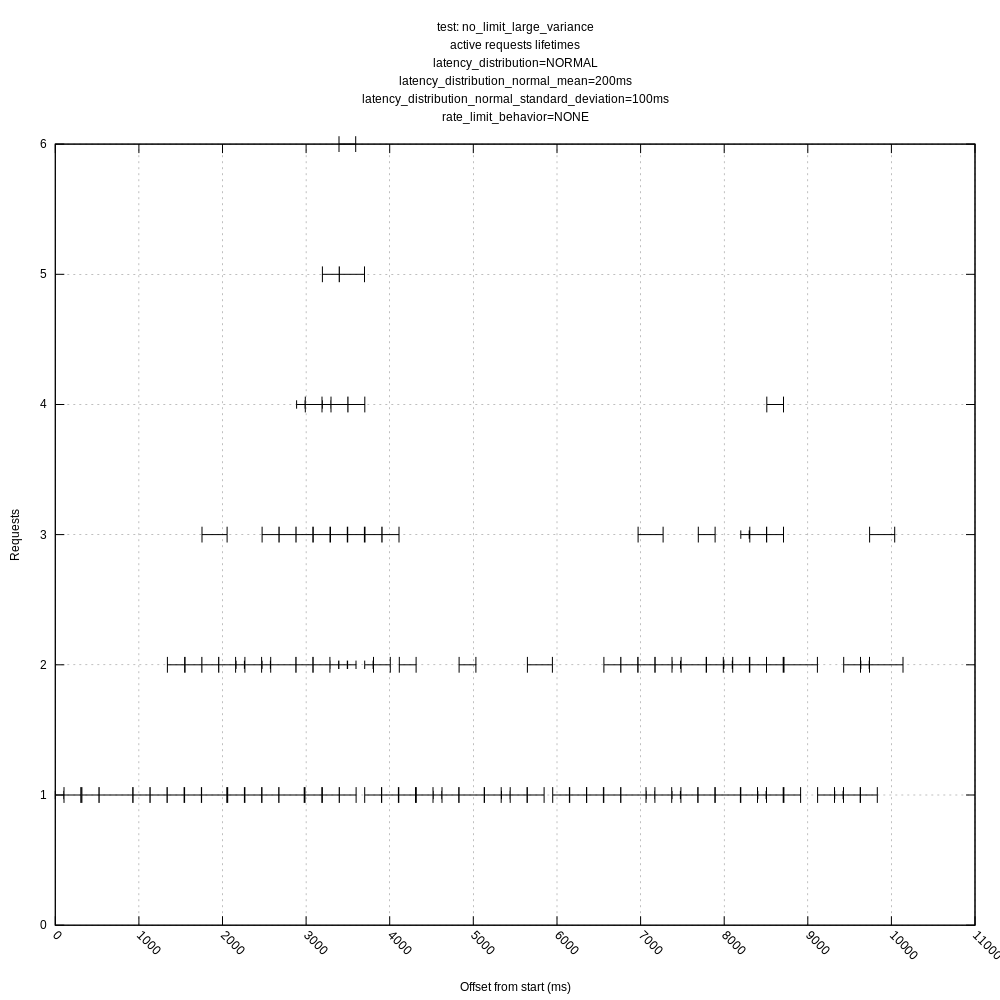
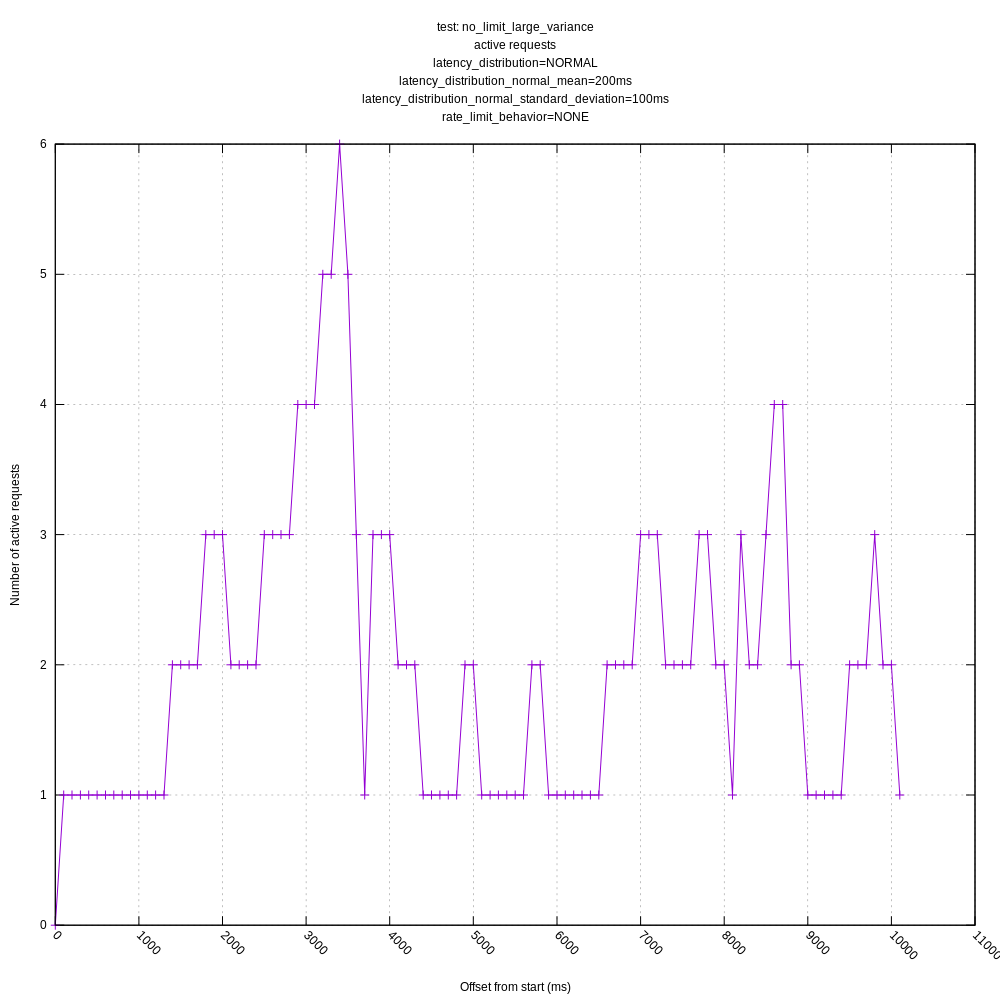
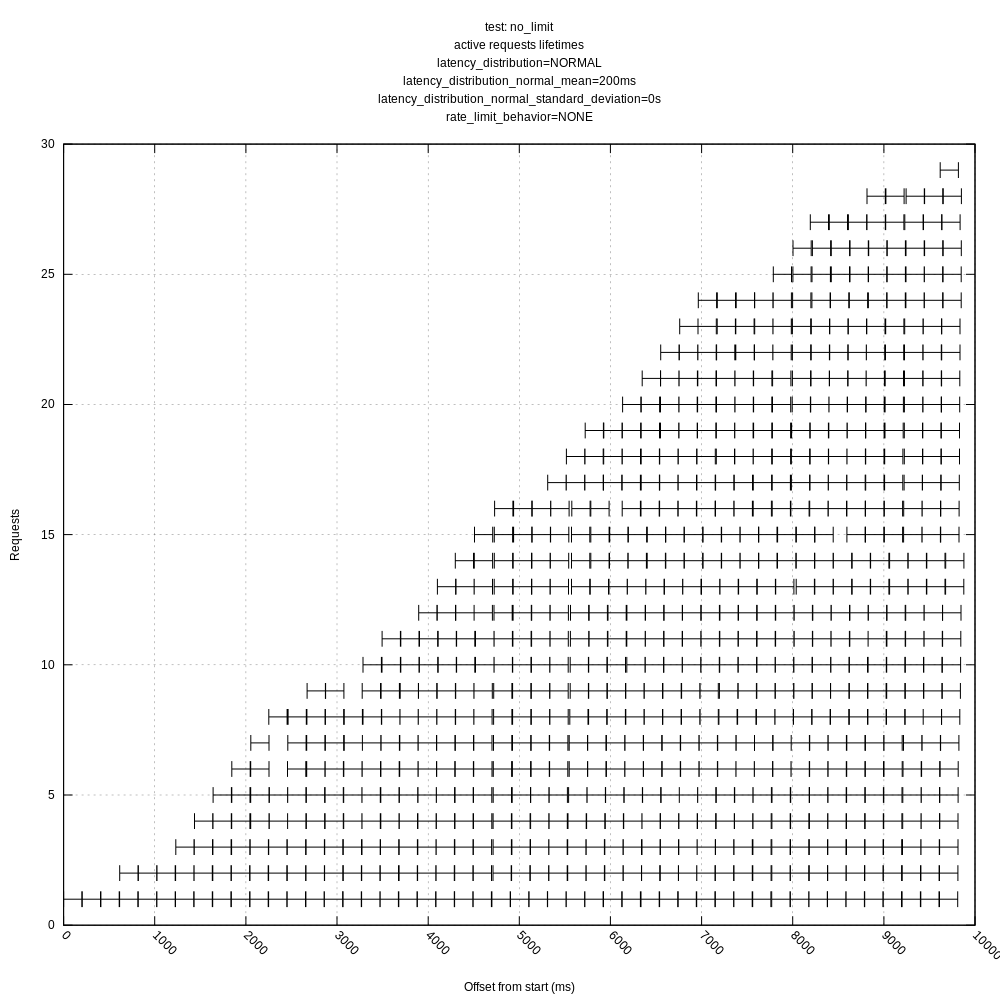
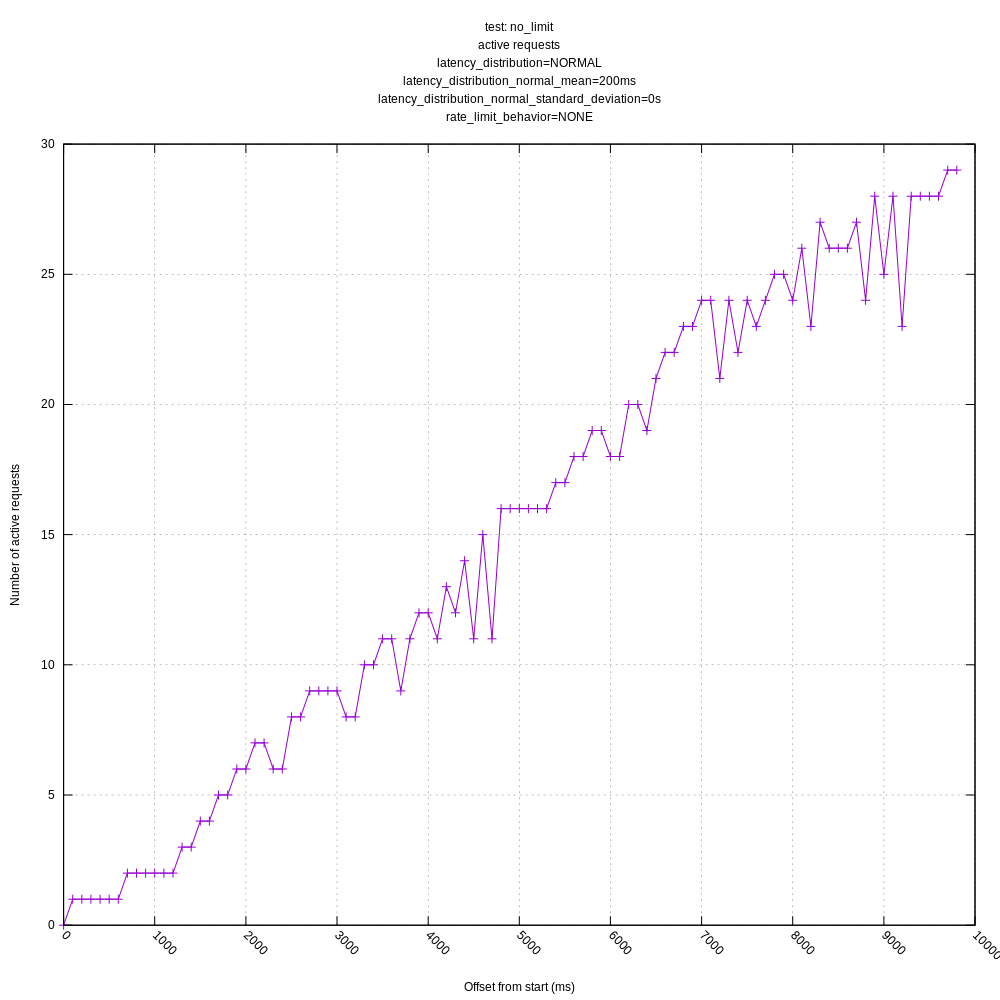
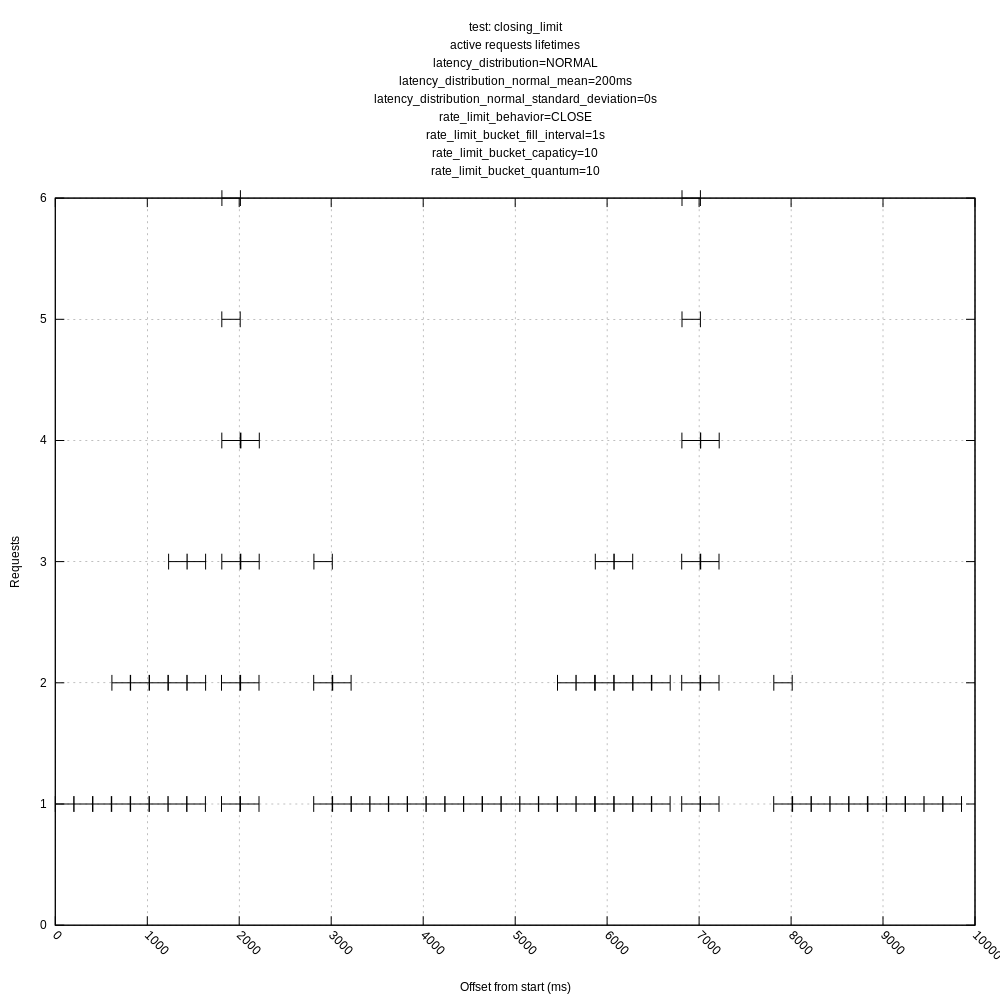
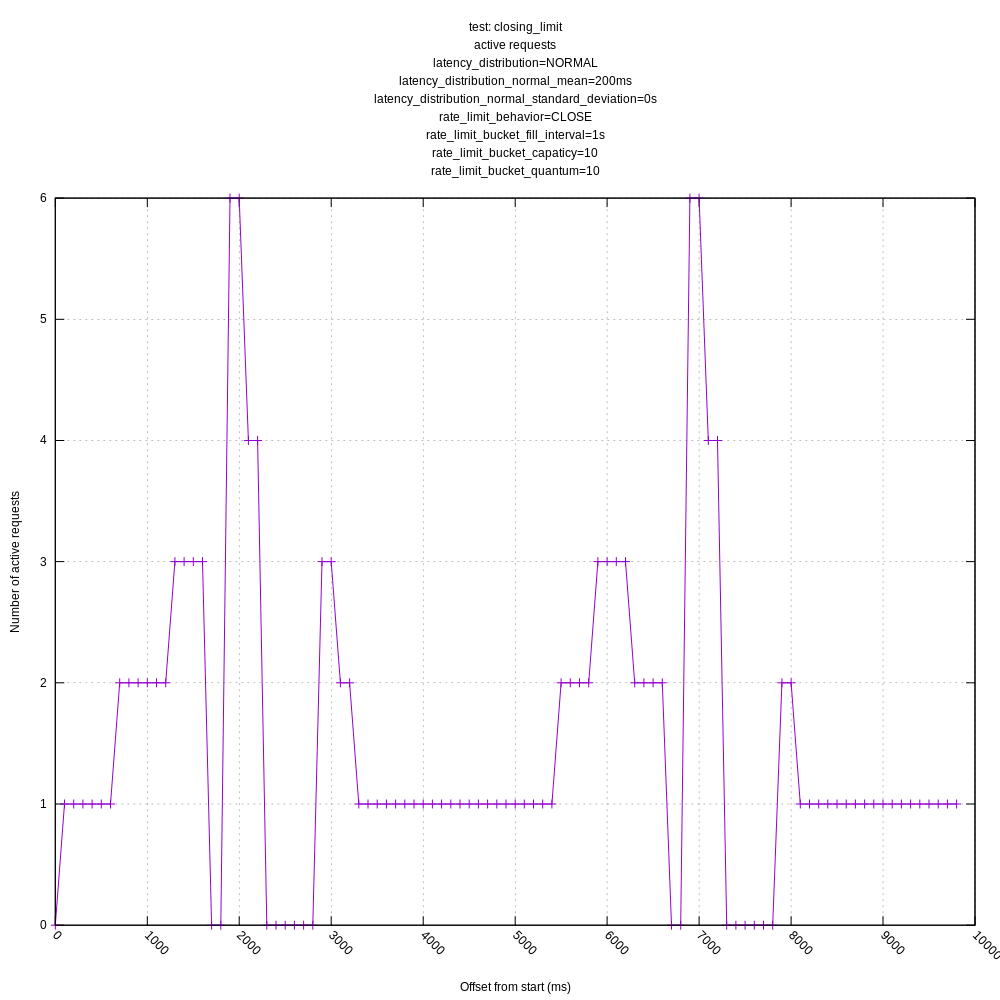
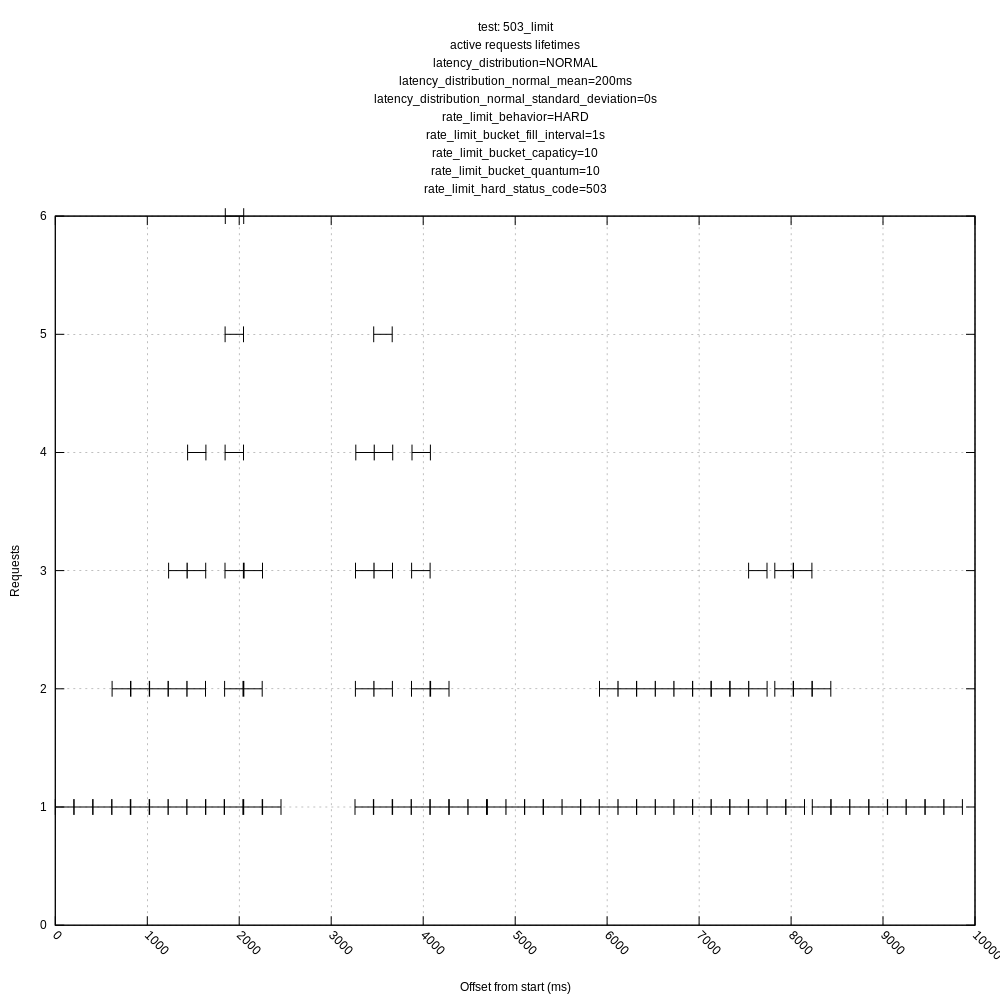
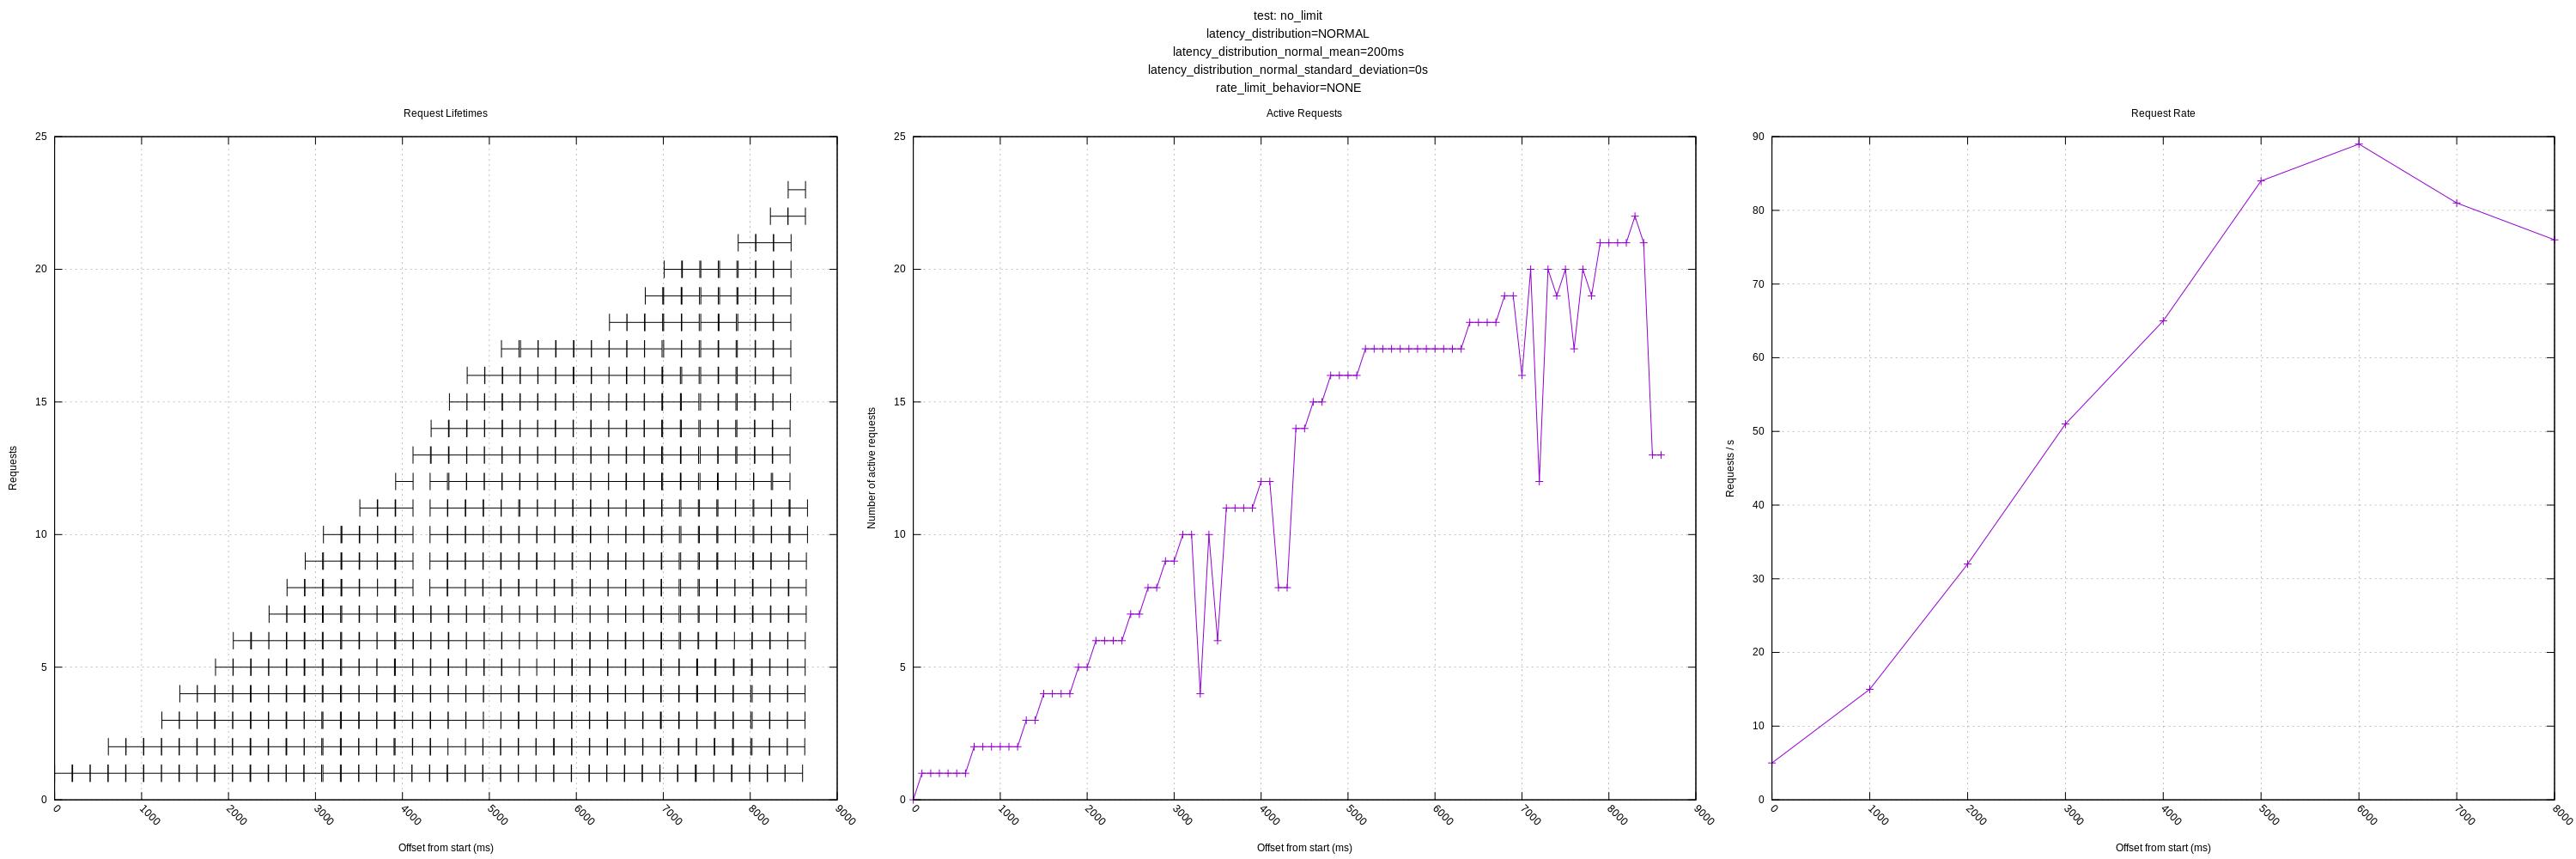
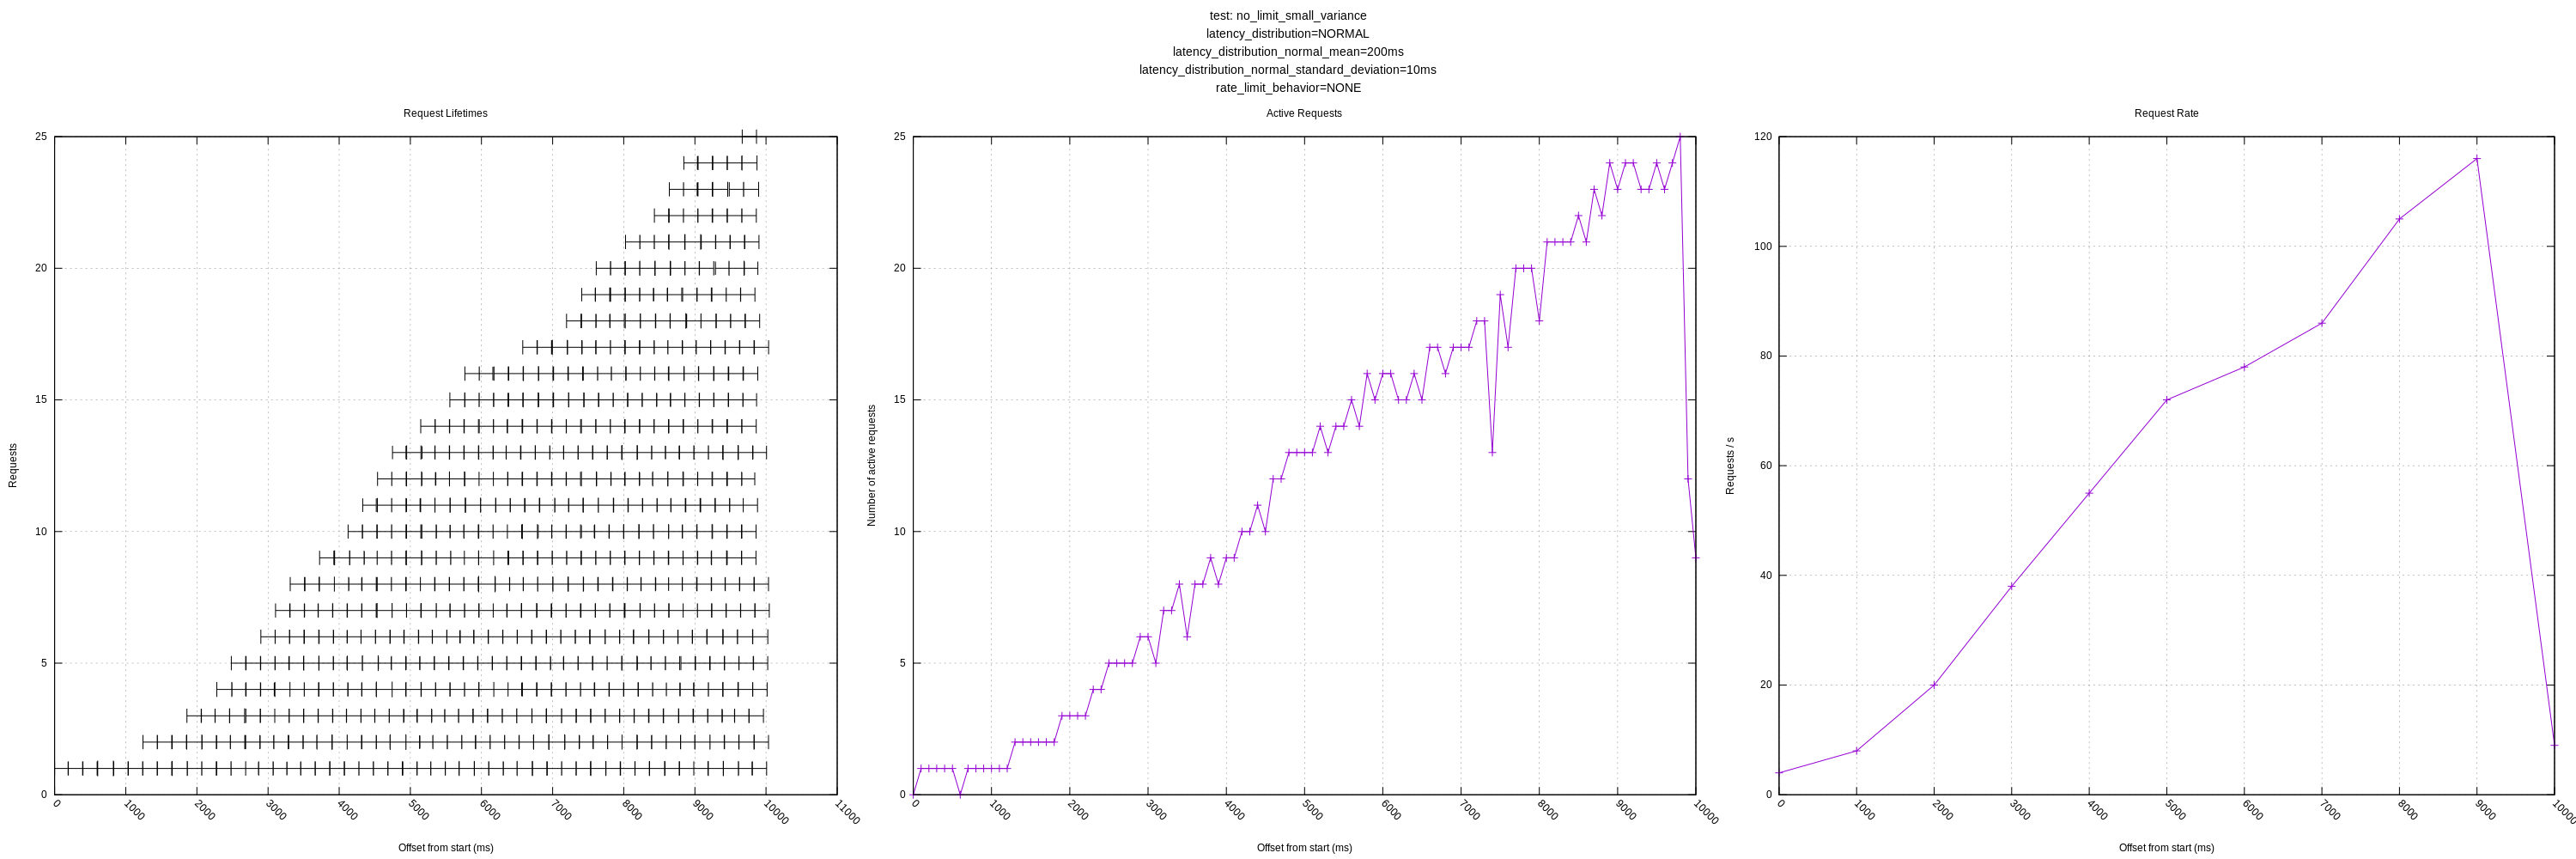
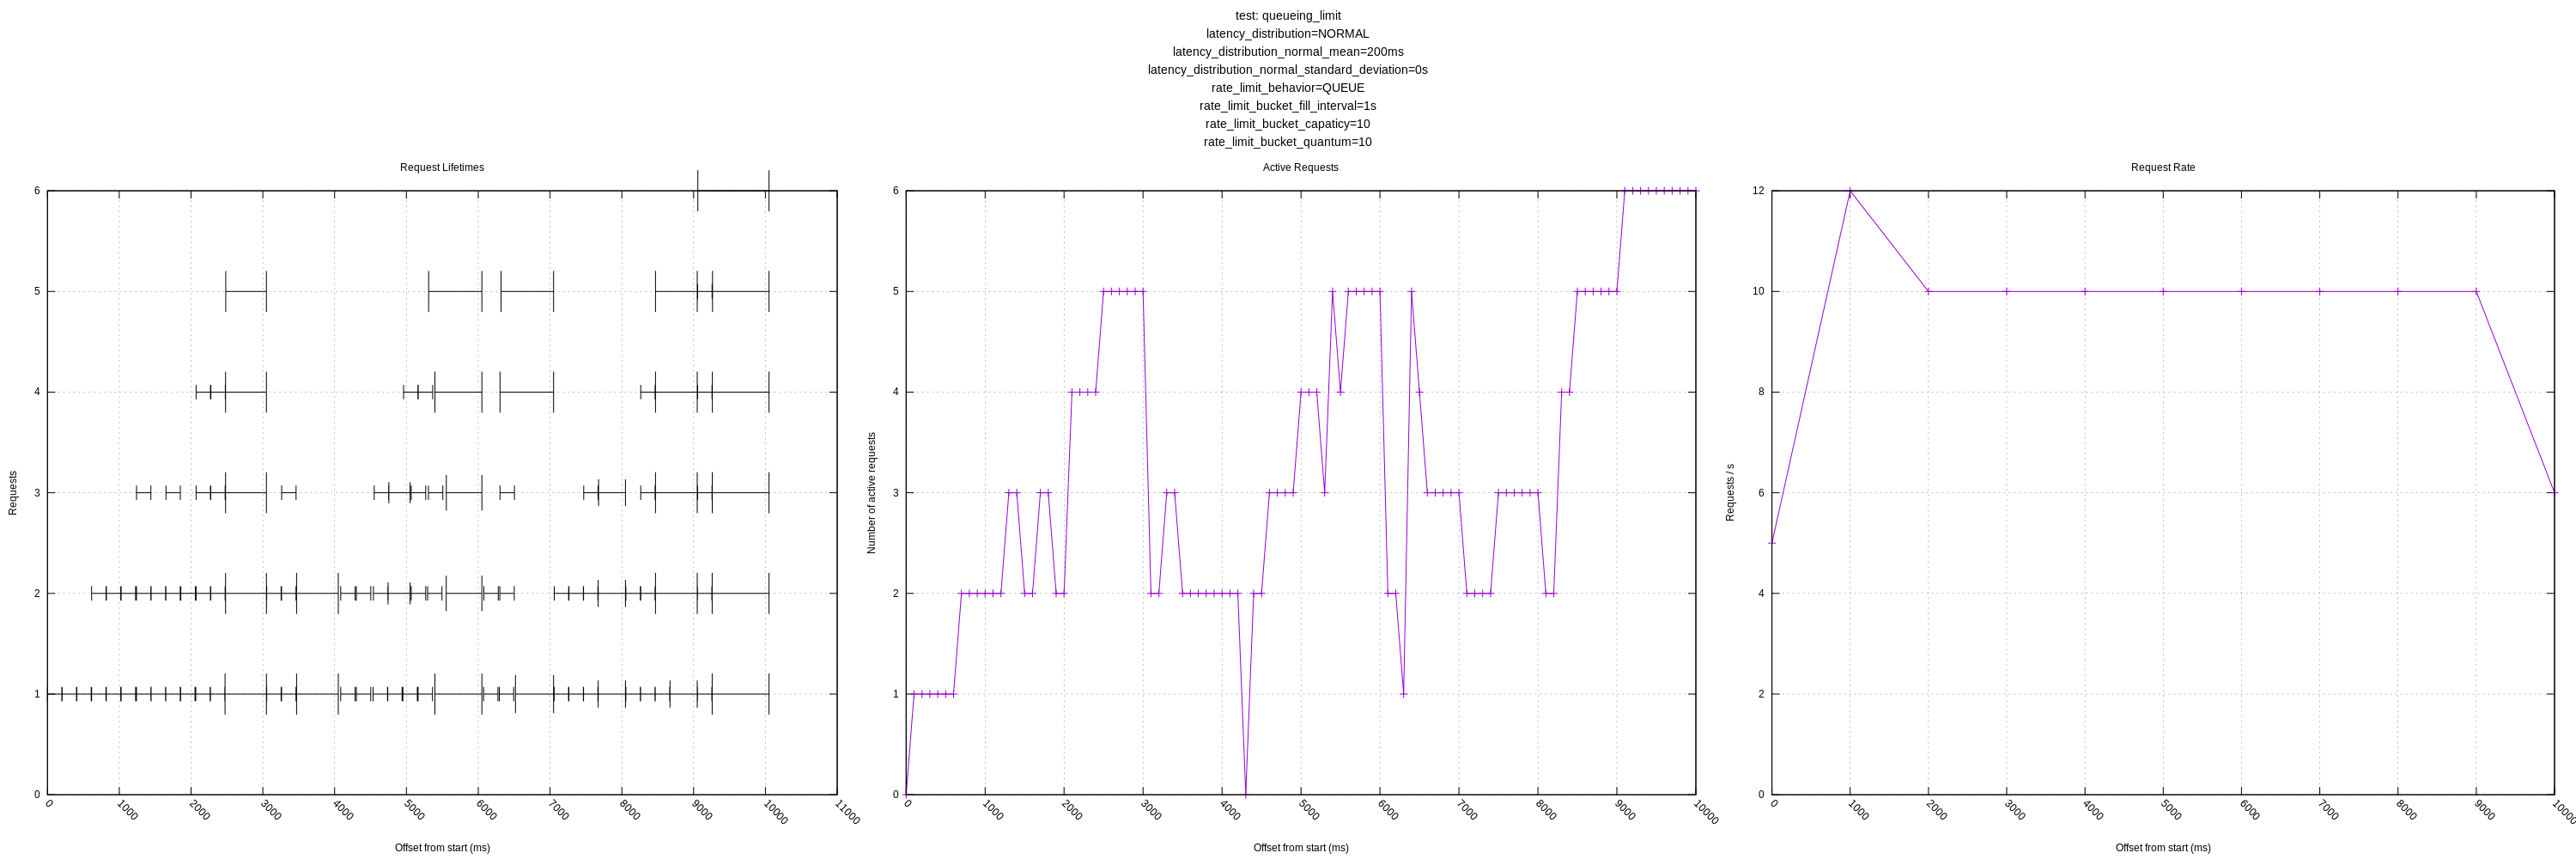
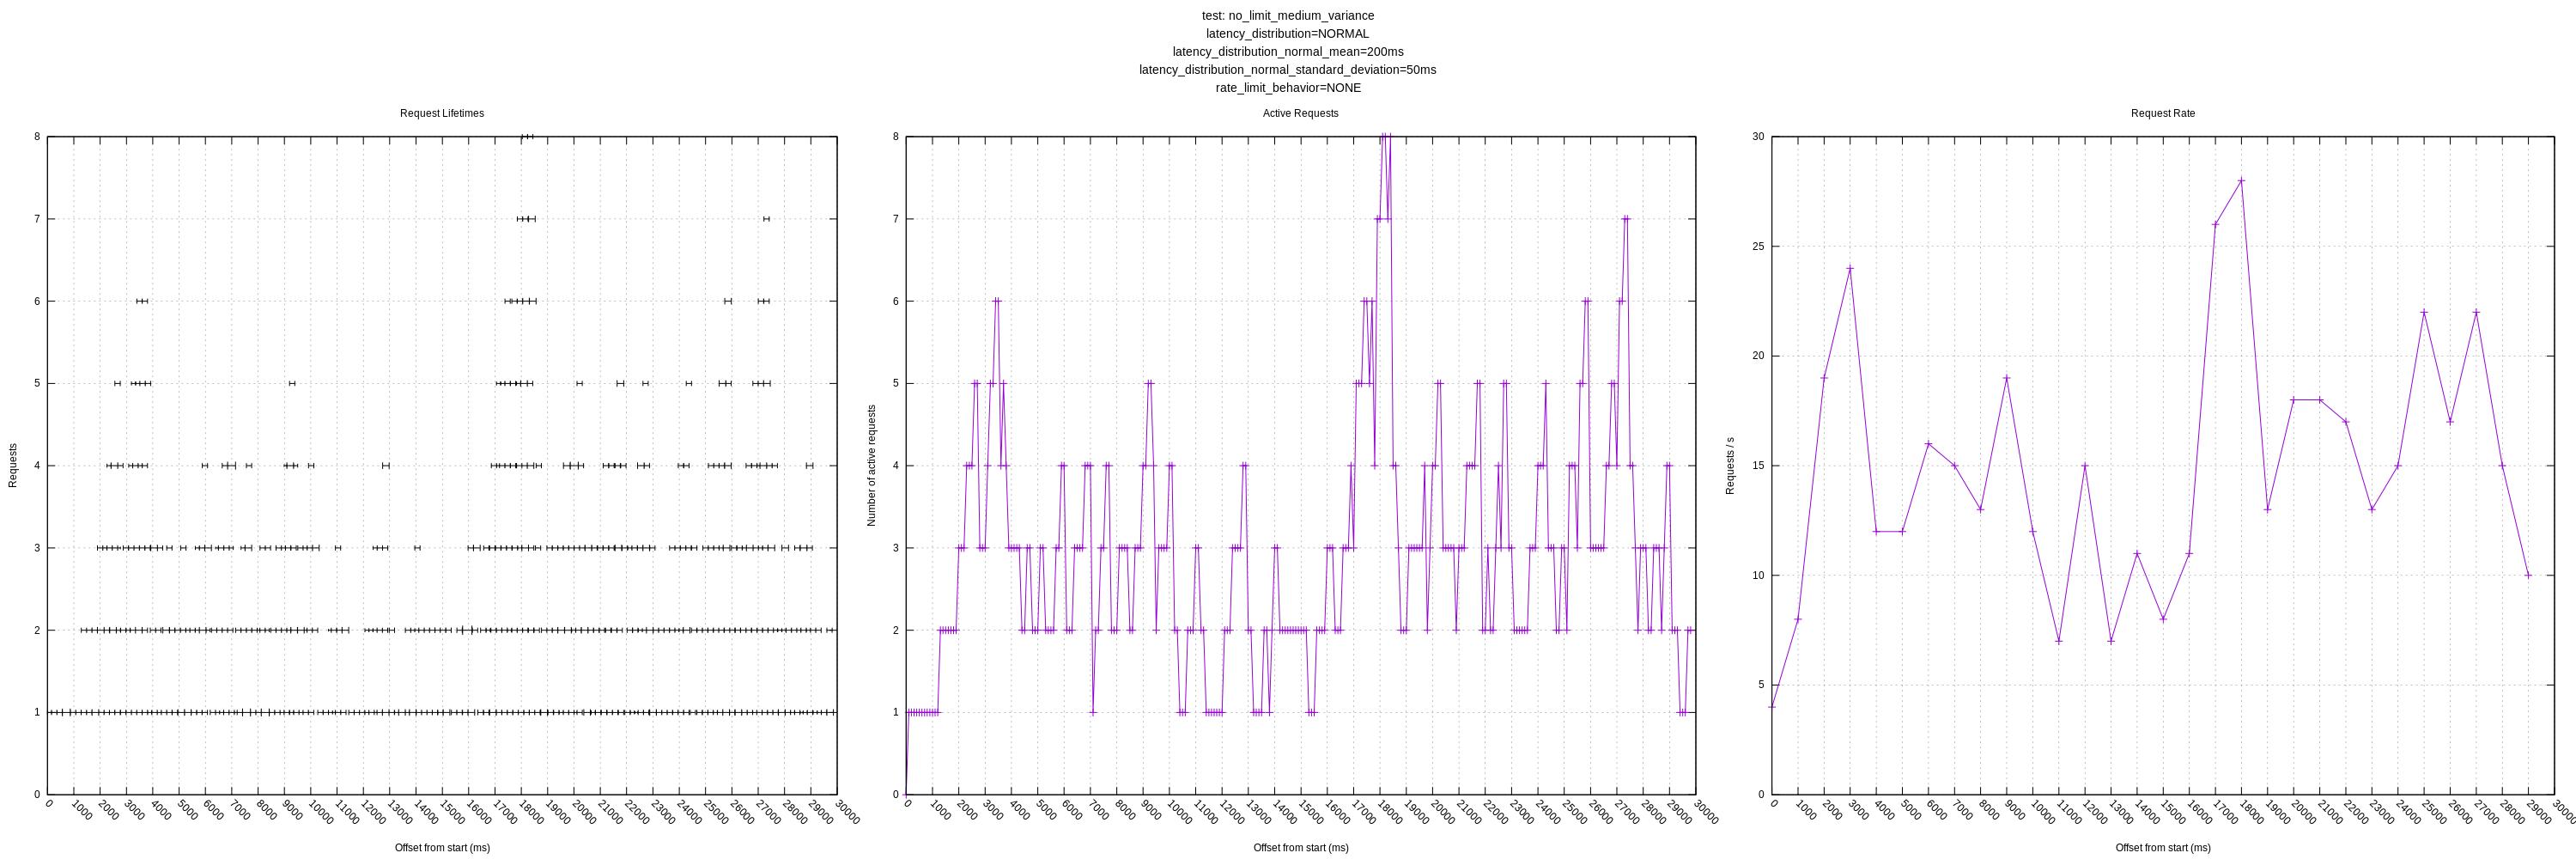
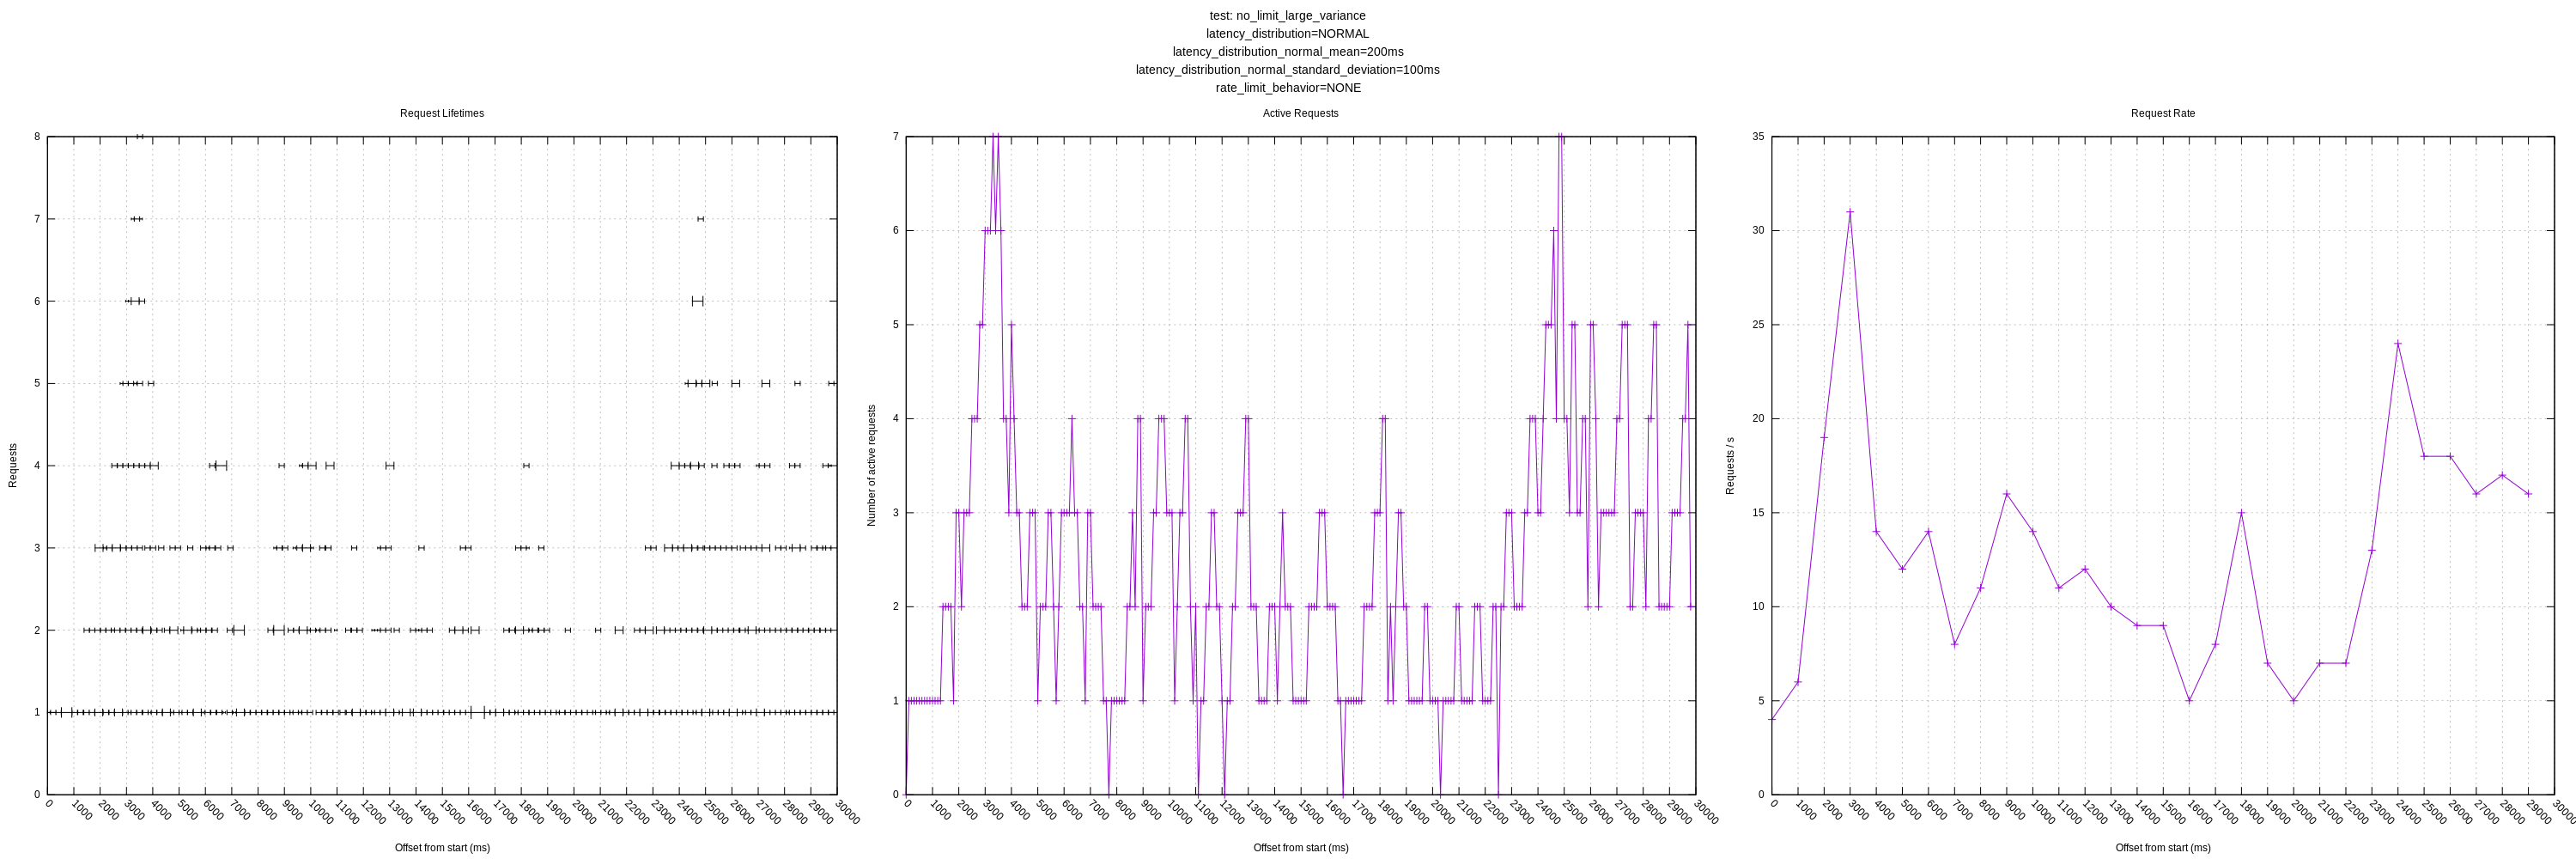
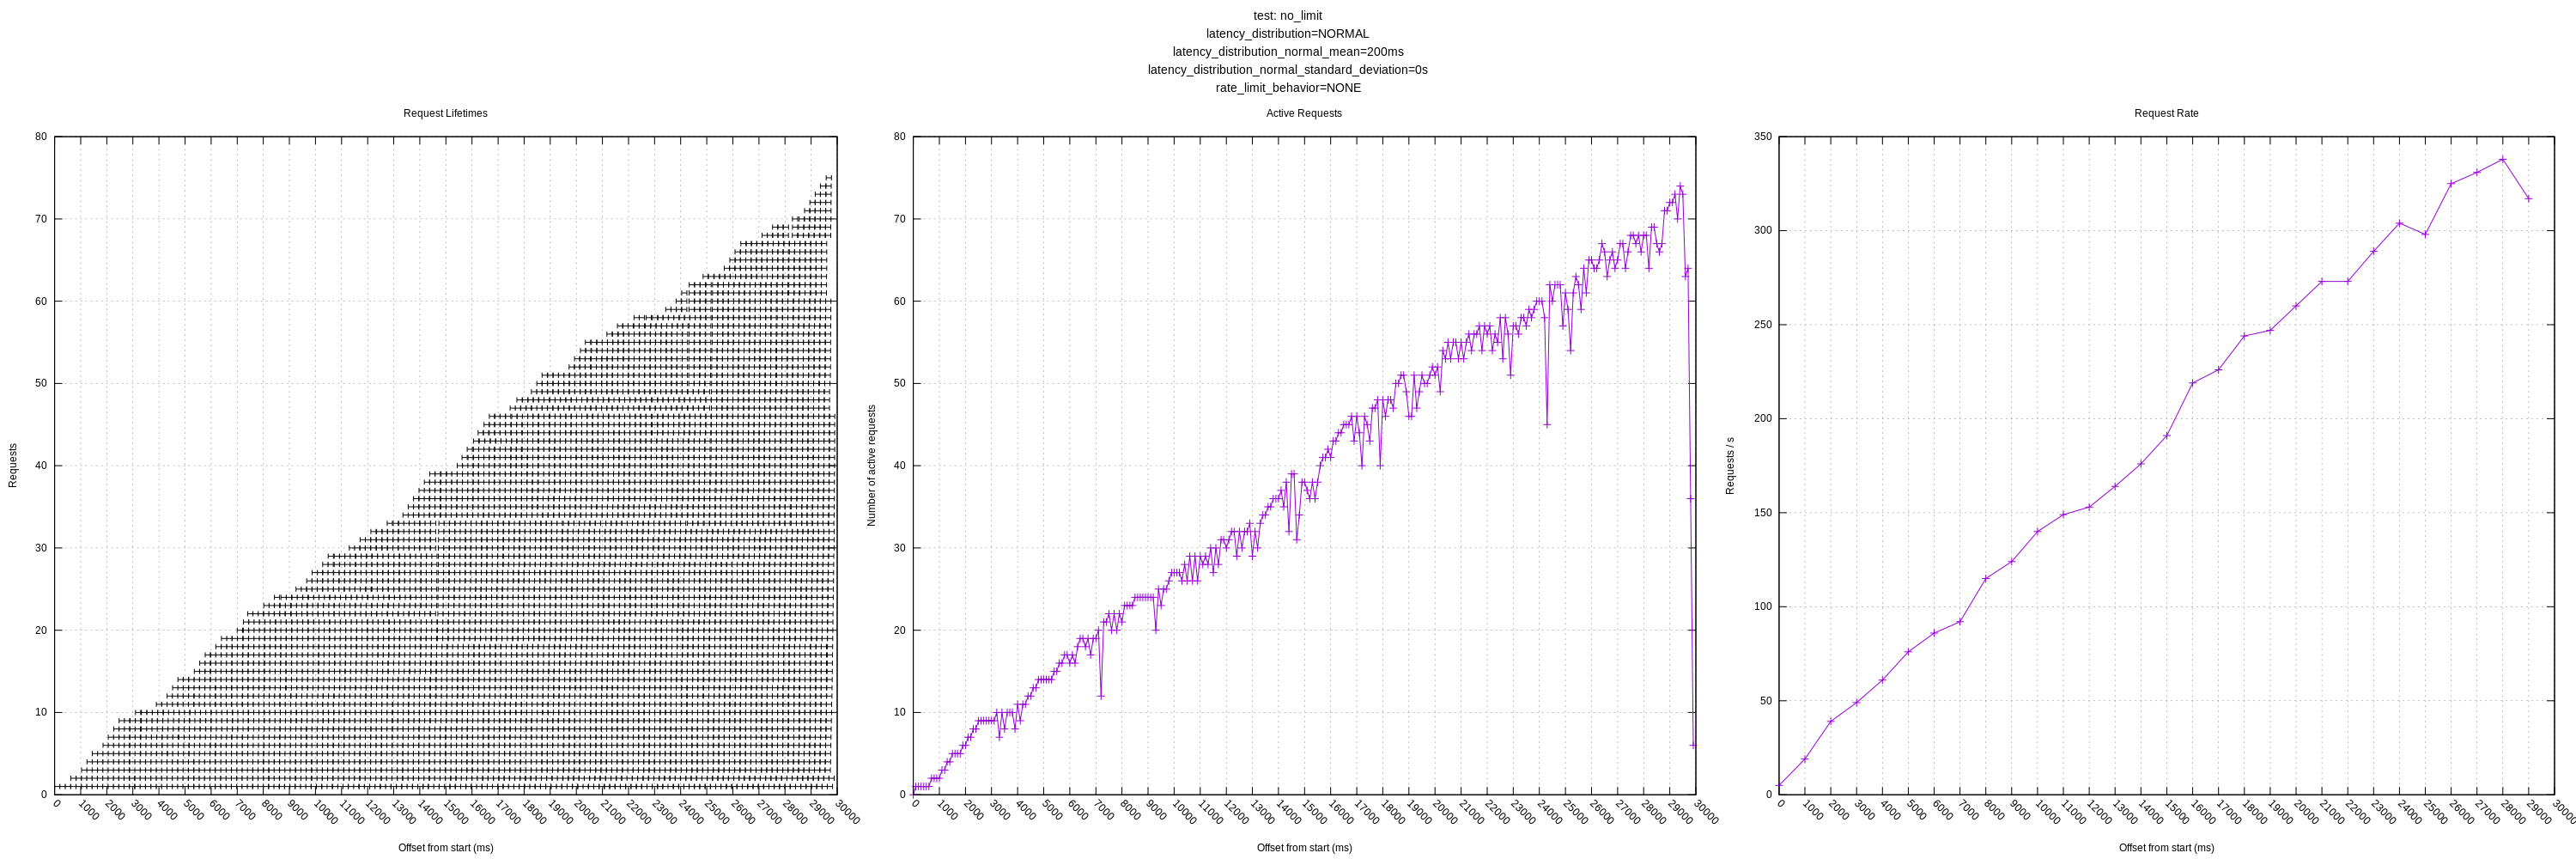
Some test results are below for master (a0534fe1). I ran them just for 10s to make the graphs more legible. I still want to additionally add:
- Increasing latency relative to load (maybe linear and some sort of power law distribution)
- Transient / total failures
- A plot of requests / second to more easily see the throughput
- Combine plots to organize them better when posting to issues like this
Some things to note:
- The behavior of the hard and "close" limits is poor, as expected, due to the algorithm including these requests in its mean calculations. This should be addressed by https://github.com/timberio/vector/issues/3424
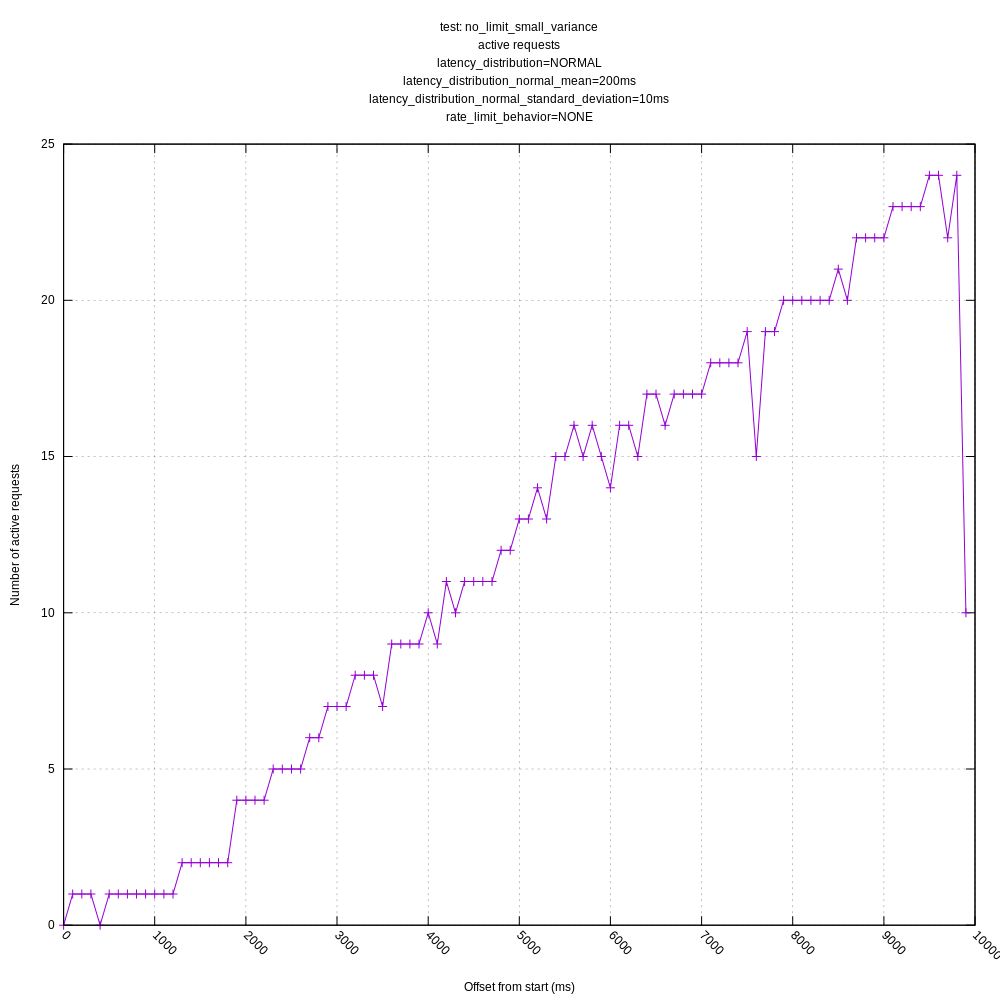
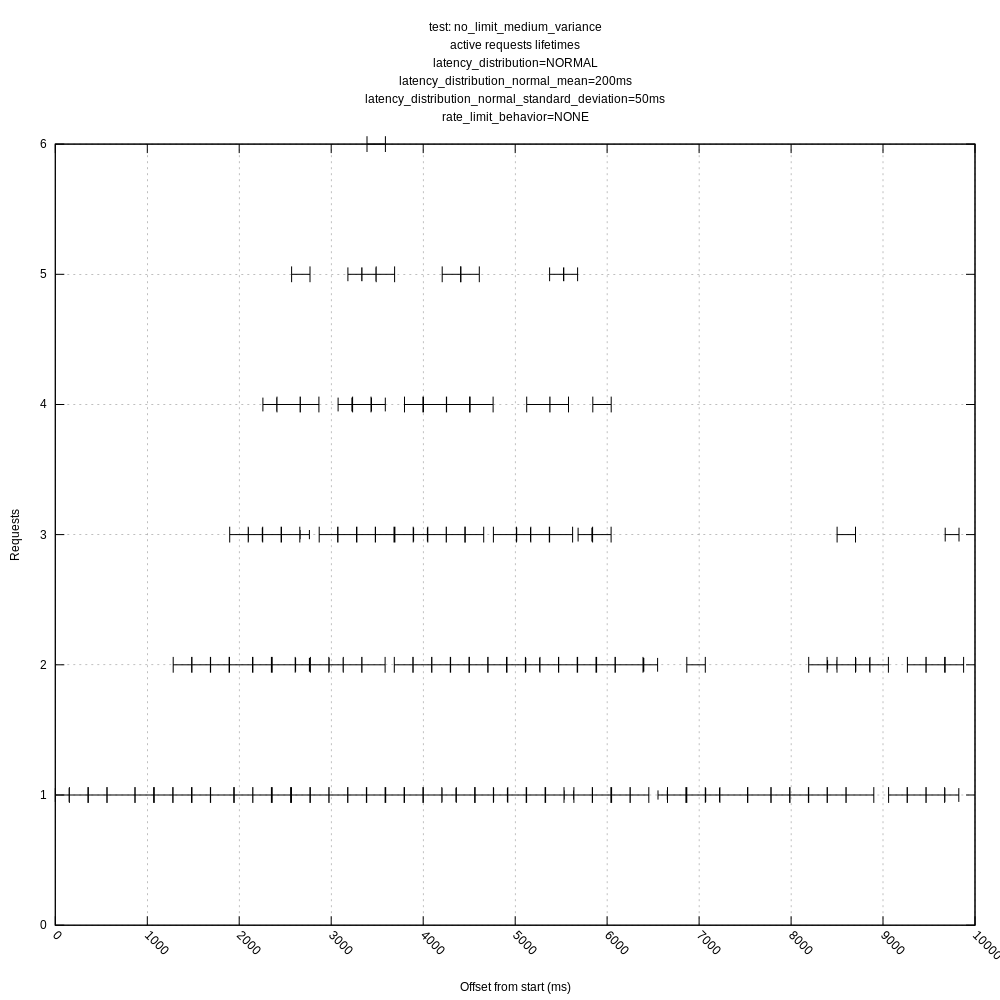
- The behavior of the algorithm is poor in high variance scenarios as it often sees requests greater than its mean and chooses to back-off even though there is no real need to (the server could handle many more requests with the same mean/variance). This was expected based on my understanding of the algorithm, but I wanted to see how it behaved in practice. I personally think we should address this issue sooner than later as it throttles concurrency much lower than it could; it should otherwise look like the "no limit, no variance" graphs.
jszwedko
on 19 Aug 2020
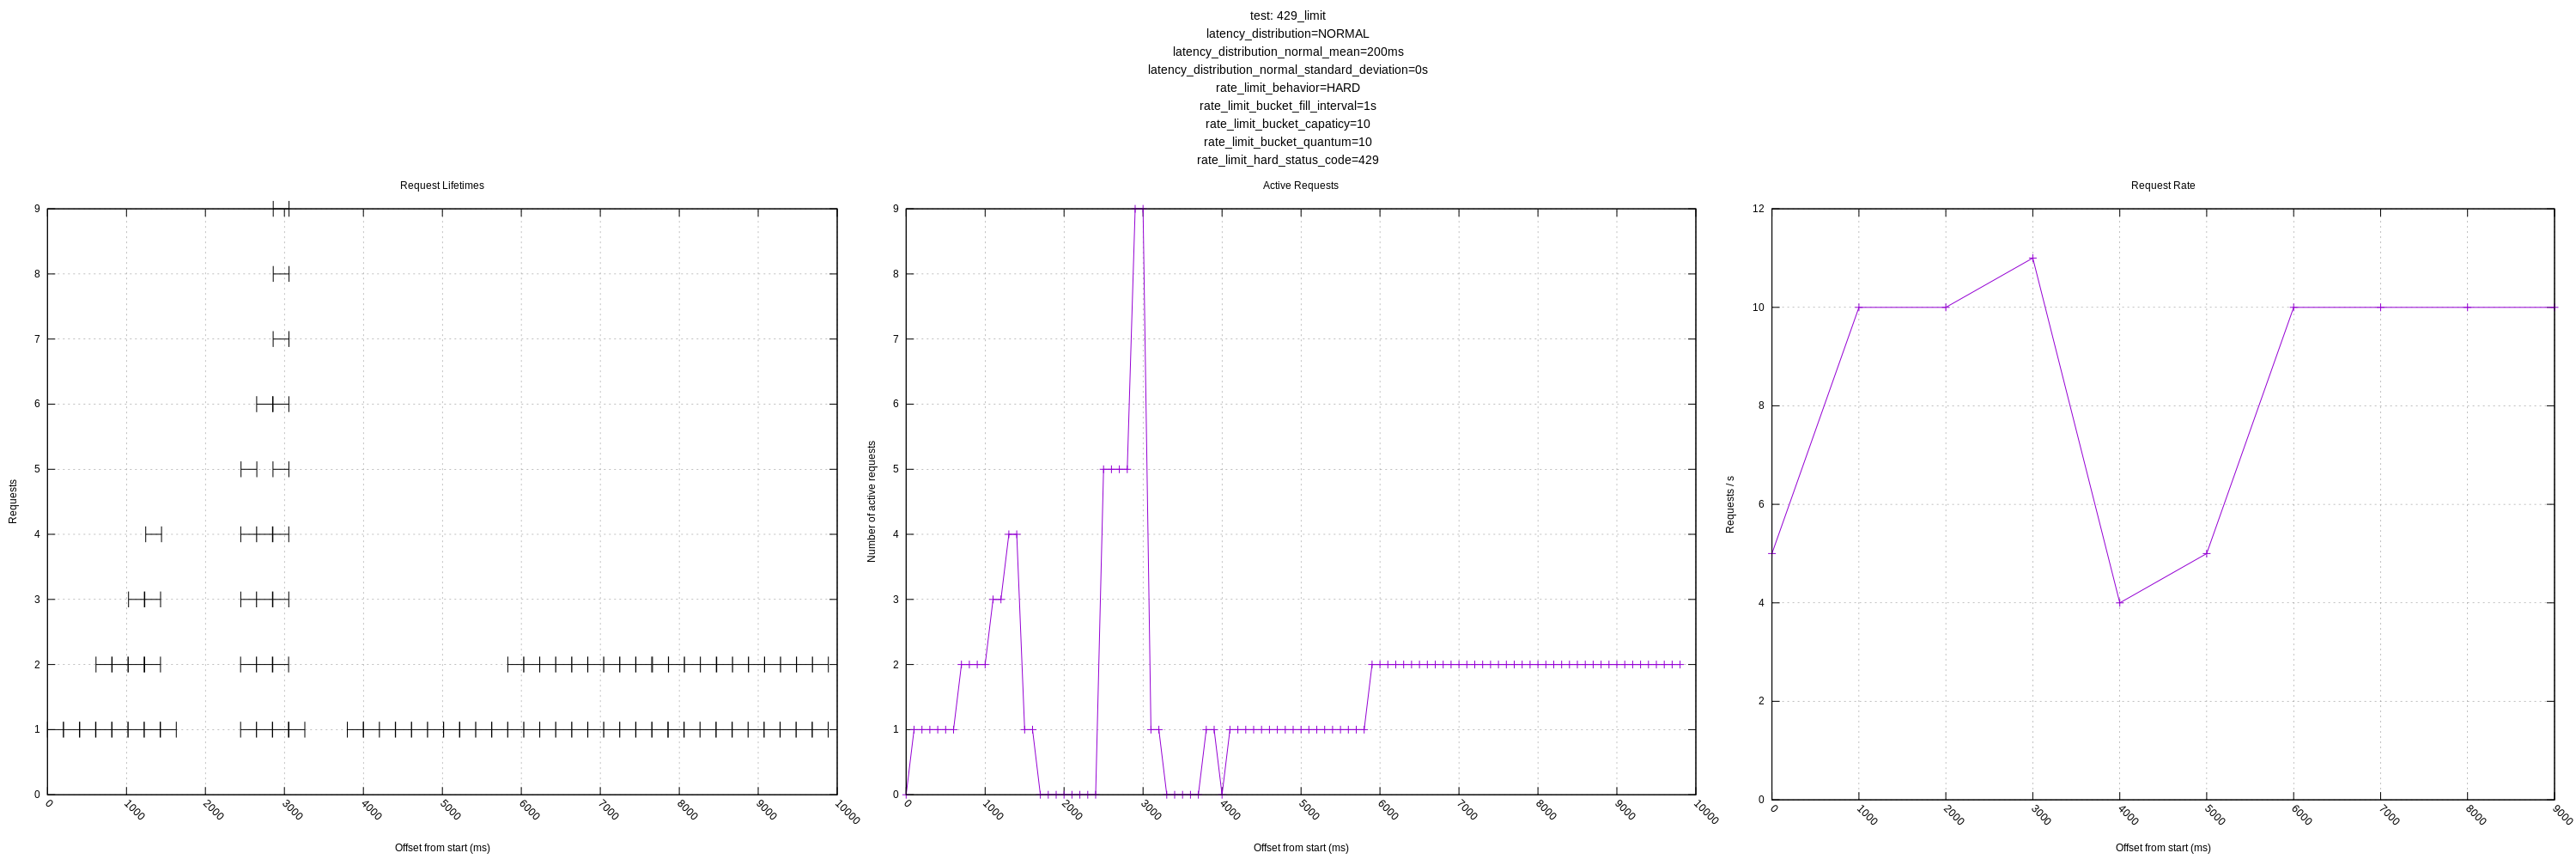
It just occurred to me that we're missing something big in these graphs. You have given the test server a rate limit (with adjustable behavior when the limit is exceeded). This is a primary concern for targeting managed services that have service limits like that. However, these graphs don't show how fast Vector is sending events, only how we are managing the concurrency. In this kind of situation, the users of Vector probably don't care what we do with concurrency, only that we stay close to the rate limit without manual management.
Note that none of my own tests try to determine this, so they are missing that detail as well. My internal test harness doesn't even have a mechanism for rate limiting, so that's a definite deficiency.
bruceg
on 20 Aug 2020
However, these graphs don't show how fast Vector is sending events, only how we are managing the concurrency. In this kind of situation, the users of Vector probably don't care what we do with concurrency, only that we stay close to the rate limit without manual management.
Definitely agreed. I just finished adding another plot for the request rate which I think will give us some idea of this. I also combined the plots into one plot to make it more legible.
I measured the rate by the number of requests ending in that second based on how prometheus recommends graphing it though that didn't feel quite right. I'm wondering if there is a more representative way we could measure it. Do you have thoughts?
New plots (I recommend clicking to expand):
Let me know if there are any other views you think would be interesting! I'll still plan on expanding the test server as mentioned above to have controls for increasing latency in response to load and introducing errors.
jszwedko
on 20 Aug 2020
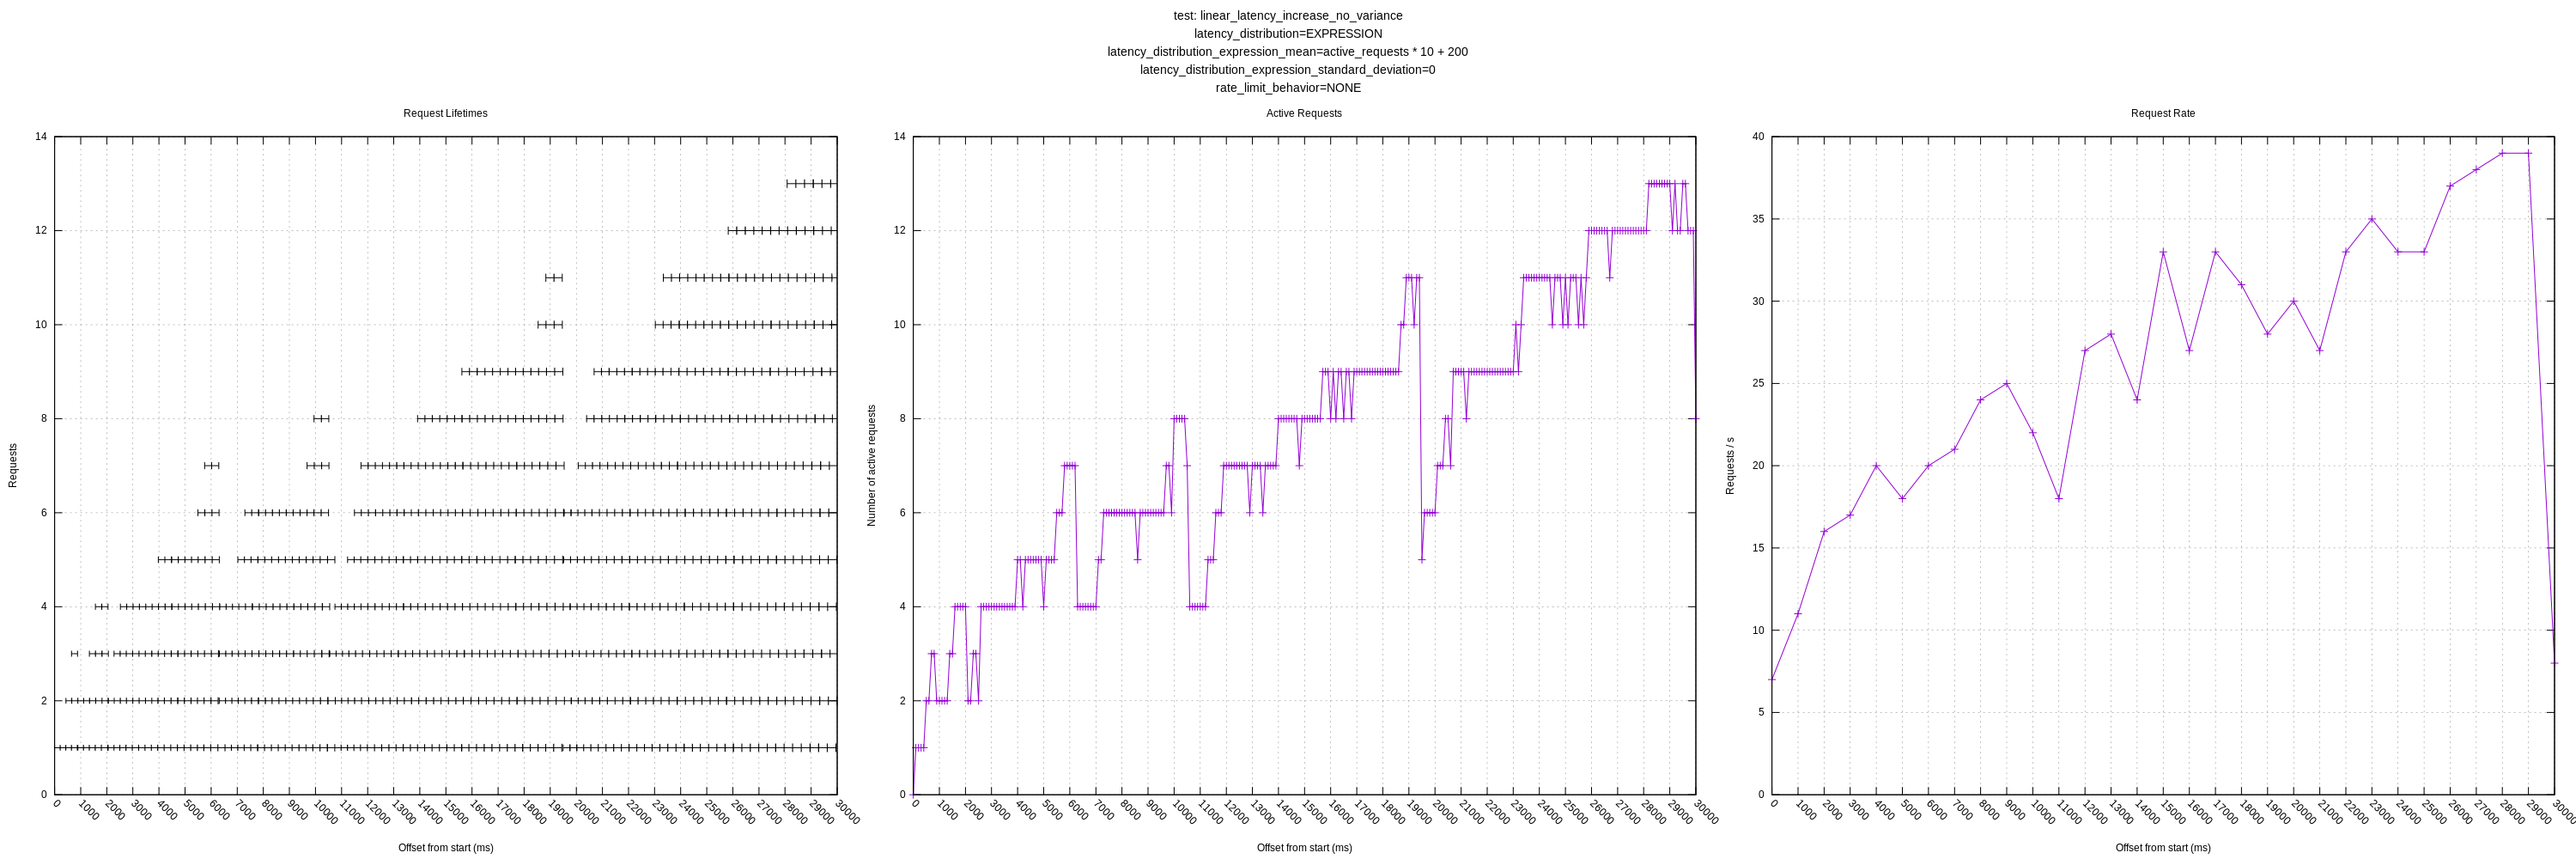
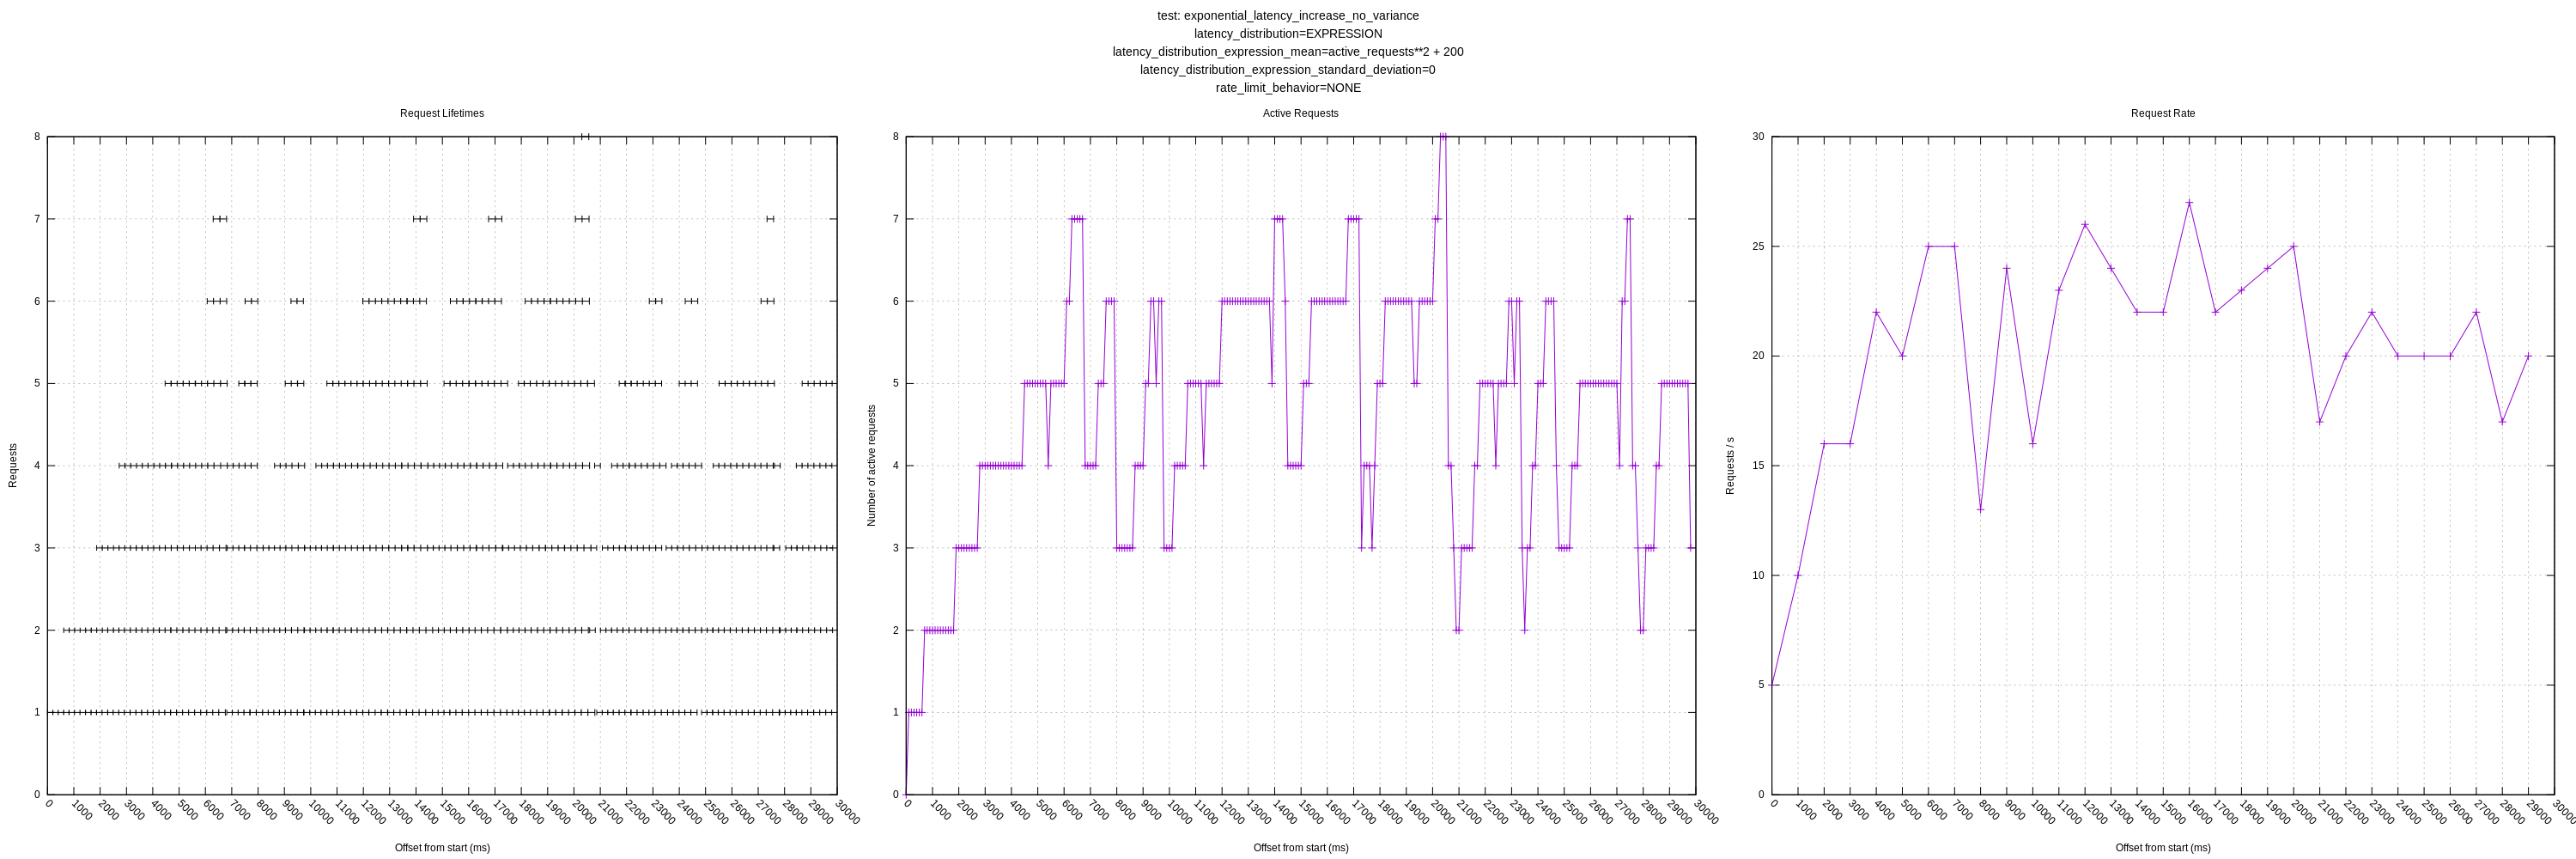
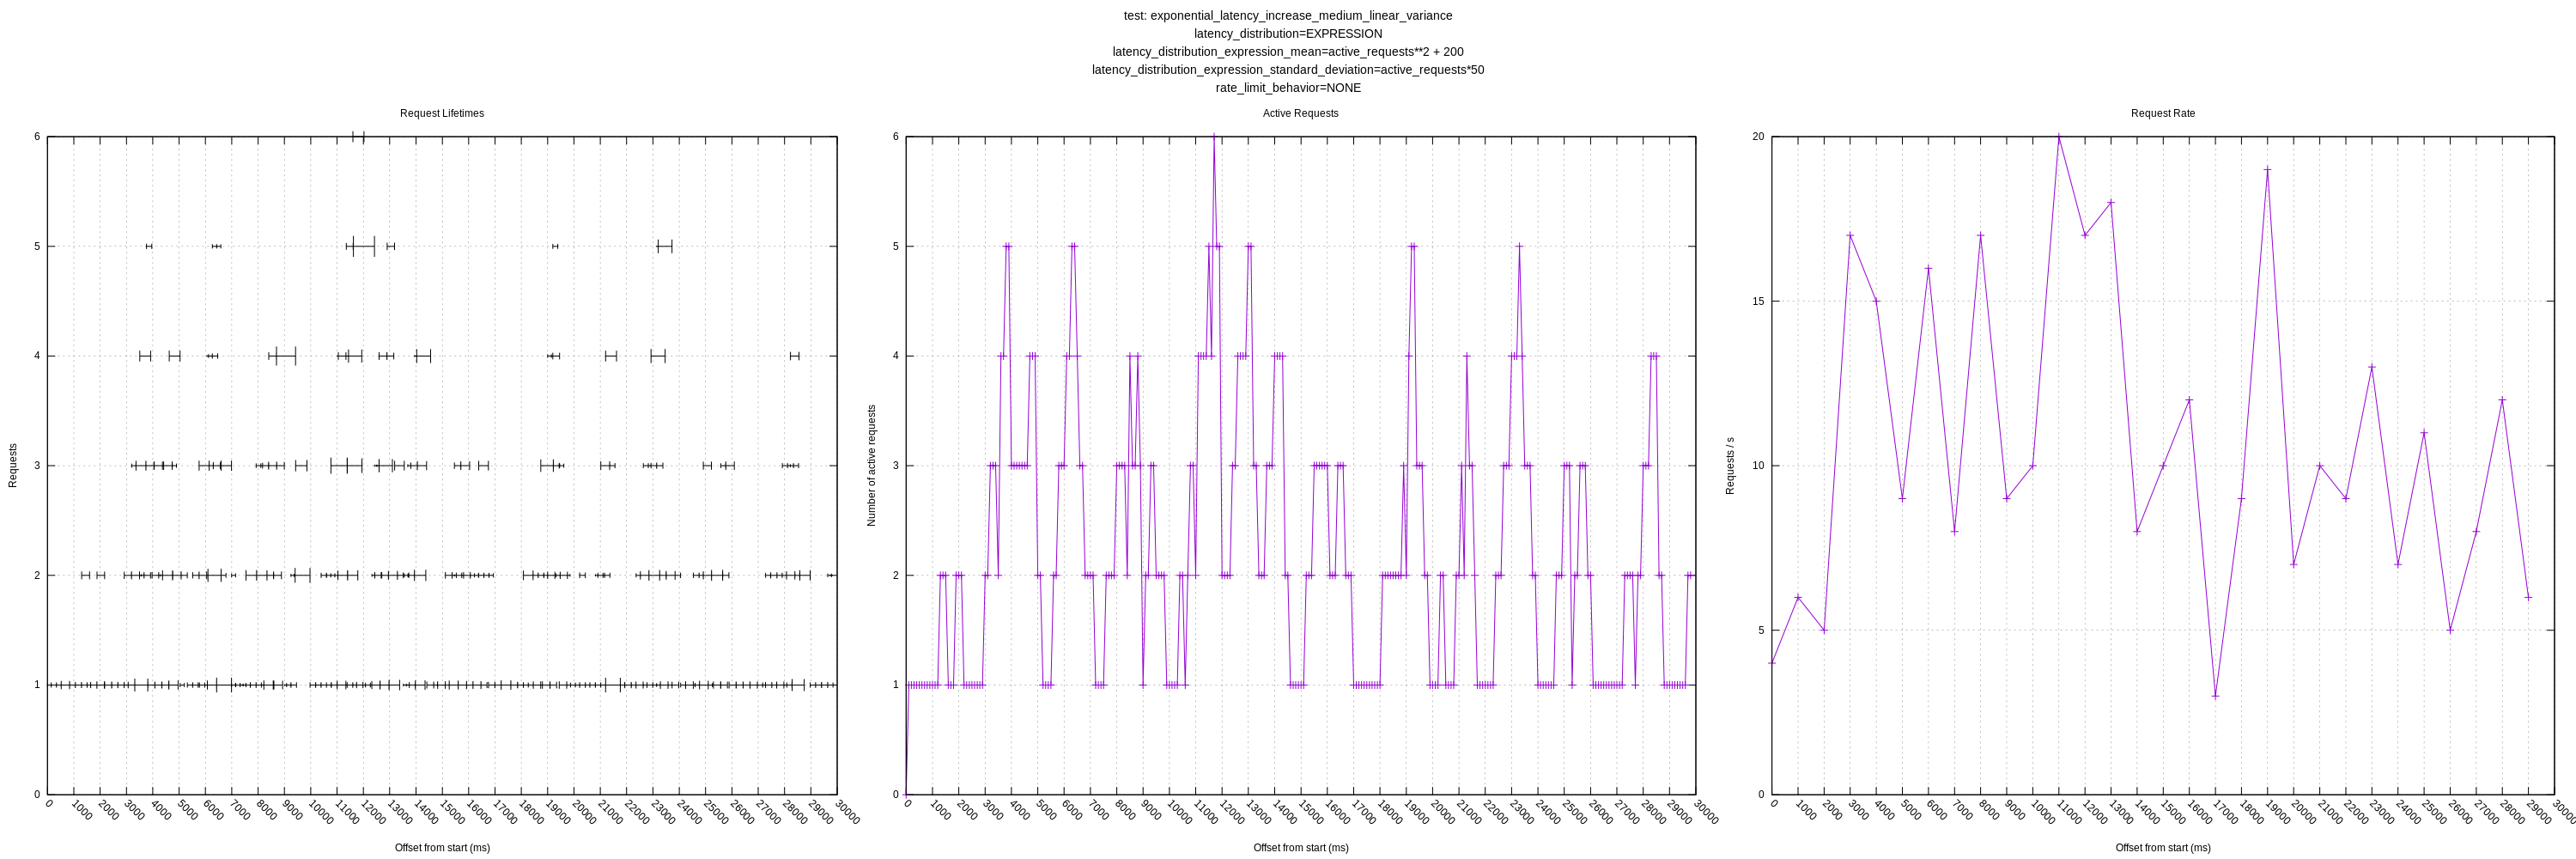
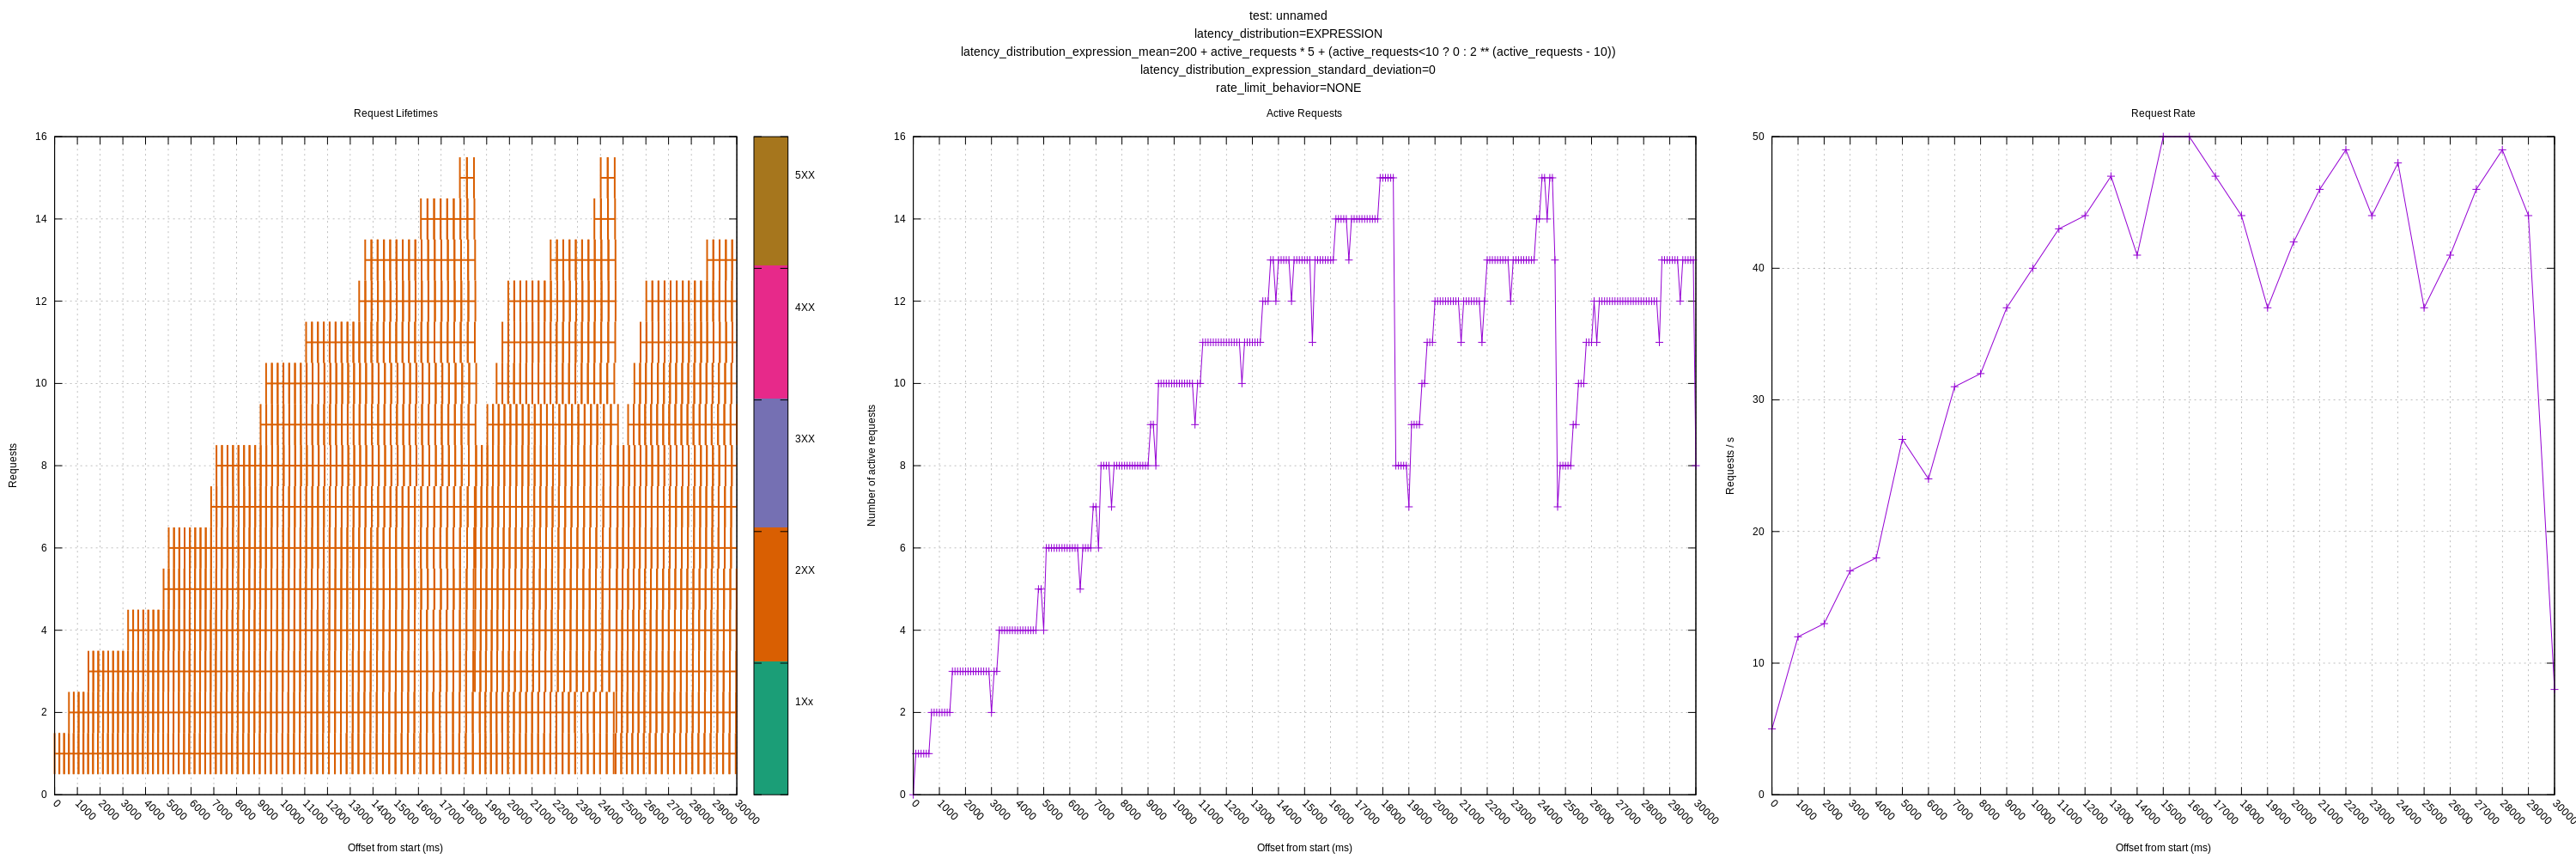
I did another round of tests using master with the changes to hard rate limiting (#3493) (931f6401) and with some added tests that increase latency relative to the number of active requests through the addition of the following flags (or env vars)
      --latency-expression-mean-ms string          expression to use to evaluate latency of request in ms; variables: [active_requests]; only applies when latency-distribution is EXPRESSION (default: '0') (default "0")
      --latency-expression-stddev-ms string        expression to use to evaluate stddev of the latency of request in ms; variables: [active_requests]; only applies when latency-distribution is EXPRESSION (default: '0') (default "0")
These apply when --latency-distribution is EXPRESSION and allow for things like: active_requests ** 2 + 200 which would scale the value based on the active requests, squared. There are some more details in the README. I'm feel like this is a fairly flexible approach that will allow us to simulate a wide variety of behaviors.
I think the remaining knob for this initial round is error rates which would error some requests randomly (or perhaps more often at higher load).
I added a few new combinations to the suite configuration file. I'm expecting we'll want to test additional permutations, but I'm not sure exactly what they will be yet. We could even define a matrix, but there are a lot of options so we'd end up with more graphs than would be reasonable to look at.
Some thoughts / questions with these new graphs:
It's interesting that the plot where latency is linear to the number of active requests, that it seems to grow unbounded in terms of the number of concurrent requests the concurrency algorithm will estimate. It backs off intermittently, but then starts growing again. My guess is that the increase in latency is small enough with each additional concurrent request, that it decides the increase does not represent new load (due to the threshold variable). I'm assuming the backoffs are, in part, due to random variation in the RTTs (though there is no artificial variation, there will still be some).
This raised another question for me: what should vector's behavior be in the face of a service where the latency increases with any sort of load? In the case where I have the latencies increase exponentially, _every_ additional concurrent request would indicate a change in the mean. If there were no threshold variable to account for some variation, I might have expected vector to hover around 1-2 concurrent requests.
My question regarding expecting variance from the mean (greater than 0.05 factor) is still outstanding as well. It's unclear to me how we should resolve this, but currently it will artificially limit vector to a lower number of concurrent requests than it could be achieving. (See the plots with "medium" or "large" variance).
A quick question: do you know if vector measures the throughput requests in HTTP-based sinks? I couldn't find anything (though I do see it'd be possible to calculate event throughput). I think this would be useful for users to monitor as they try out this feature (and also for any issue reports they might submit).
Curious to get any thoughts!
And now, the plots (running for 30s):


jszwedko
on 26 Aug 2020
It might be easier to view the plots all as one image:
jszwedko
on 26 Aug 2020
Another day, another plot.
I added a control for varying the error rate that uses the same expression approach as the latency expression flag I mentioned above.
For example, HTTP_TEST_ERROR_EXPRESSION='rand() < 0.1' will cause approximately 10% of the requests to fail (requests will fail if the expression returns true). It also allows for use of the active_requests variable so you can do things like "HTTP_TEST_ERROR_EXPRESSION": "rand() < (0.1 * active_requests)" to have the error rate increase relative to the concurrency. I'm hoping this approach is, again, flexible.
See README for more details: https://github.com/timberio/http_test_server/pull/1/files#diff-04c6e90faac2675aa89e2176d2eec7d8
Another improvement I made was plotting the failed requests on the request lifetime plot. I put all these at y=0 as they are generally low-latency requests (sub 1ms) and blended in when included with the successful requests. I colorcoded the requests too, but I'm not sure how useful that ended up being.
I didn't notice anything unusual; the algorithm seemed to back off as expected in the face of errors.
Plots:
I think this is the last knob we need for the initial round of QA. I'm curious to hear your thoughts still about my above comment (https://github.com/timberio/vector/issues/3255#issuecomment-681086863).
jszwedko
on 27 Aug 2020
Ok, I think we need (or at least, I do) to take a step back here and go back to the goals for this feature. I fear I had lost sight of what problems this feature was intended to solve, and have been muddying the waters since then. I'm going to restate where I'm at to help organize my thinking and help drive this to finished.
For clarity: The primary goal (so far as I understood it) is to maximize throughput without requiring the vector user to configure anything. The mechanism is to dynamically "discover" the current limit on the throughput and run as close to that limit as possible. Since all of the resources used by a request (network bandwidth, processing time, storage speed, etc) are finite, there will always be some limit, though it may not be possible to discover the limit if it is large enough.
As such, the primary data point of interest is that of throughput. It doesn't really matter what the concurrency level does internally, as long as it achieves the maximal throughput. The other graphs are interesting for documenting how it achieved the behavior, and very useful for diagnosing problems, but are then secondary.
The question is, what is the maximal throughput in these scenarios, and are we reaching it?
I see the following subdivision of scenarios:
- Artificial throughput limits (imposed by the configuration of the receiving service). AFAIK the only limit we are targeting is that of constrained requests per unit time. This will be a hard limit and the maximum throughput is obvious. It may be expressed by:
- Explicit backpressure (ie HTTP 429 responses)
- Dropped requests (by closed connections)
- Delayed/queued responses (until the limit is past)
- Natural throughput limits (caused by resource load levels). Here the limit will be relatively soft, and will typically show up as a mostly linear rise and then much larger spike in latency under increasing load. At a previous job running capacity simulations, this was called the "knee" of the load level vs response time graph. The cause of the limit doesn't matter much so long as we stay below that knee.
Of course, in both these cases, we still have to contend with some complicating factors: network latency is not 100% predictable, clocks have jitter, there are potentially other uses of the resources, etc. There is the additional requirement of dynamically adjusting to new conditions.
So then, where are we at, with both testing and validation?
- The test environment can express all three of the explicit limit mechanisms:
- Explicit (HARD): We fail
- Dropped (CLOSE): I think we succeed here, but perhaps take longer than desired to reach the limit.
- Delay (QUEUE): We succeed when the latency is predictable, and probably come close enough when it isn't.
- The test environment can express many kinds of natural conditions, but I am unclear if it can exhibit the knee-like behavior. I suspect we succeed when the slow rise in latency under load is below the hard-coded threshold ratio, and fail when it is greater. This ratio should be made more dynamic, perhaps based on a standard deviation measurement, although this too is not quite right.
None of the internal test harnesses I wrote actually test limits like this. It is possible the non-deterministic ones in auto_concurreny/tests.rs don't even have real value as they stand.
So, on to your comments:
It's interesting that the plot where latency is linear to the number of active requests, that it seems to grow unbounded in terms of the number of concurrent requests the concurrency algorithm will estimate. It backs off intermittently, but then starts growing again. My guess is that the increase in latency is small enough with each additional concurrent request, that it decides the increase does not represent new load (due to the threshold variable). I'm assuming the backoffs are, in part, due to random variation in the RTTs (though there is no artificial variation, there will still be some).
That would exactly match the algorithm I implemented, so that is how I would understand it as well.
This raised another question for me: what should vector's behavior be in the face of a service where the latency increases with any sort of load? In the case where I have the latencies increase exponentially, _every_ additional concurrent request would indicate a change in the mean. If there were no threshold variable to account for some variation, I might have expected vector to hover around 1-2 concurrent requests.
In the case of a linear increase, it should continue to increase its concurrency, since that is not evidence of reaching a limit. It should only back off when it reaches a super-linear increase. You are right that, when latency increases exponentially, the concurrency limit should stay fairly low, but that is indeed modulated by the threshold variable, making it a little more complex to answer.
Given the above discussion of natural limits, I think an exponential curve comes closer to expressing a limit condition, but still isn't quite right. I don't know a name for the so-called "knee" curve off hand, nor if it is even expressible without a conditional (ie if load < limit { X } else { Y }).
My question regarding expecting variance from the mean (greater than 0.05 factor) is still outstanding as well. It's unclear to me how we should resolve this, but currently it will artificially limit vector to a lower number of concurrent requests than it could be achieving. (See the plots with "medium" or "large" variance).
I think it would be best to calculate both mean and variance for each sample group, and use that variance to set the threshold rather than hard-coding it (possibly using a hard-coded minimum). There is not currently an issue open for this, but it could be considered to be part of #3423.
A quick question: do you know if vector measures the throughput requests in HTTP-based sinks?
I am not aware of any such measurements.
bruceg
on 28 Aug 2020
This is great assessment, thanks for putting to together and refocusing us. I also feel like I'd lost sight of the goals of this feature.
The test environment can express many kinds of natural conditions, but I am unclear if it can exhibit the knee-like behavior. I suspect we succeed when the slow rise in latency under load is below the hard-coded threshold ratio, and fail when it is greater. This ratio should be made more dynamic, perhaps based on a standard deviation measurement, although this too is not quite right.
I tried to make controlling the latency fairly expressive so I think we could model this sort of "knee" behavior. The library I'm using for the latency expression evaluation does allow for ternaries (and I think we could expand it with conditional support via spreadsheet-style functions like if(<some expression>, <value if true>, <value if false>)).
Would an expression like 200 + active_requests * 5 + (active_requests < 10 ? 0 : active_requests ** 2 give you a distribution like you want? That should be linear up until active_requests >= 10 at which point it'll start to show an exponential increase. I can try that out.
I think it would be best to calculate both mean and variance for each sample group, and use that variance to set the threshold rather than hard-coding it (possibly using a hard-coded minimum). There is not currently an issue open for this, but it could be considered to be part of #3423.
I think that would help with latency variance.
However, one thing that really stood out to me while reading this is:
As such, the primary data point of interest is that of throughput. It doesn't really matter what the concurrency level does internally, as long as it achieves the maximal throughput. The other graphs are interesting for documenting how it achieved the behavior, and very useful for diagnosing problems, but are then secondary.
I think this is exactly right and it made me wonder if maybe the concurrency algorithm shouldn't actually be optimizing for that directly, rather than indirectly through measuring the RTT increases as an indication of load. As long as we could add more concurrent requests and achieve higher throughput, we could keep increasing the number of concurrent requests even if it does increase the mean latency of those requests. We could stop adding them when adding one results in a drop to throughput. If the throughput at a given concurrency level starts dropping, we could backoff and start increasing until it drops again.
jszwedko
on 28 Aug 2020
I think we could expand it with conditional support via spreadsheet-style functions like
if(<some expression>, <value if true>, <value if false>)).
I don't think there's much value if it supports the ternary conditional operator.
Would an expression like
200 + active_requests * 5 + (active_requests < 10 ? 0 : active_requests ** 2give you a distribution like you want? That should be linear up untilactive_requests >= 10at which point it'll start to show an exponential increase. I can try that out.
That's not quite right. From 0-9 active requests the time increases in steps of 5, but at 10 it jumps by 105 but at 11 it increases by only 16. This is also only a quadratic increase at 10. I suggest BASE + req * SLOPE + (req < KNEE ? 0 : EXP ** (req - KNEE))
I wonder if maybe the concurrency algorithm shouldn't _actually_ be optimizing for [throughput] directly, rather than indirectly through measuring the RTT increases as an indication of load. As long as we could add more concurrent requests and achieve higher throughput, we could keep increasing the number of concurrent requests even if it does increase the mean latency of those requests. We could stop adding them when adding one results in a drop to throughput. If the throughput at a given concurrency level starts dropping, we could backoff and start increasing until it drops again.
:boom: :exploding_head: I had never even considered this. I think it is possible, but would of course require a rewrite of the inner controller (and tests, of course). Since it would still just be managing concurrency, none of that would affect the outer mechanics, though, so it's not a start-from-scratch idea. I think it would have to stop adding to concurrency, and even reduce it, if throughput stops increasing rather than when it decreases, which makes it a little more tricky to measure. I'll have to think some more about that.
bruceg
on 28 Aug 2020
@bruceg This really helped me recontextualize too. Thank you. :)
 Hoverbear
on 28 Aug 2020
Hoverbear
on 28 Aug 2020
That's not quite right. From 0-9 active requests the time increases in steps of 5, but at 10 it jumps by 105 but at 11 it increases by only 16. This is also only a quadratic increase at 10. I suggest BASE + req * SLOPE + (req < KNEE ? 0 : EXP ** (req - KNEE))
That makes sense to me. For:
- BASE=200
- SLOPE=10
- KNEE=10
- EXP=2
The latencies would look like:
gnuplot> f(x) = 200 + x * 10 + (0<=x && x<10 ? 0 : 2 ** (x - 10))
gnuplot> set xrange [0:20]
gnuplot> set xlabel "concurrency"
gnuplot> set ylabel "latency (ms)"
gnuplot> plot f(x)
Converting to throughput (req/s):
gnuplot> g(x) = x * (1000 / (f(x)))
gnuplot> set ylabel "requests/s"
gnuplot> plot g(x)
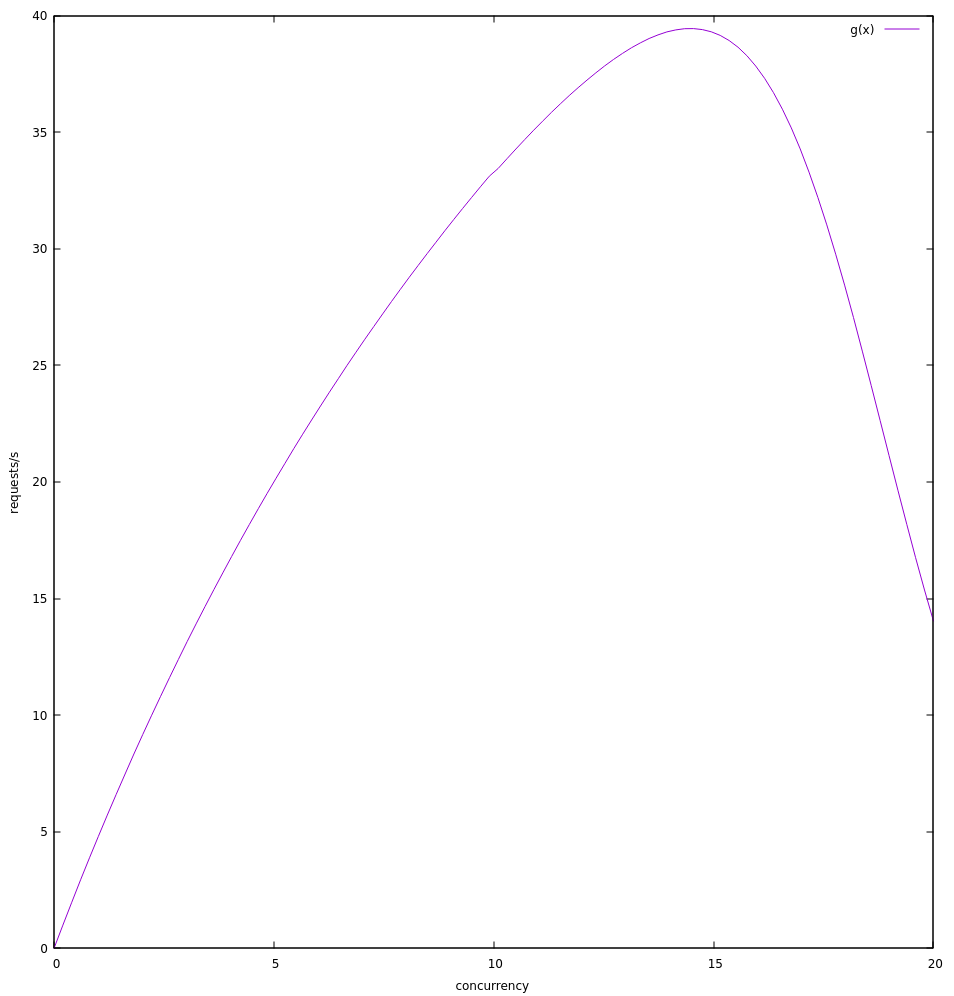
Seems like it would put the optimal concurrency between 14 and 15 at which point throughput starts dropping.
I'll see what the current algorithm does with that.
jszwedko
on 28 Aug 2020
Here's what I saw:

Which seems to show it hovering around 6 concurrent requests or 25 req/s.. The theoretical max seems to be close to 40 req/s. I'm wondering if it would be better with a lower slope. I'll try that too.
jszwedko
on 28 Aug 2020
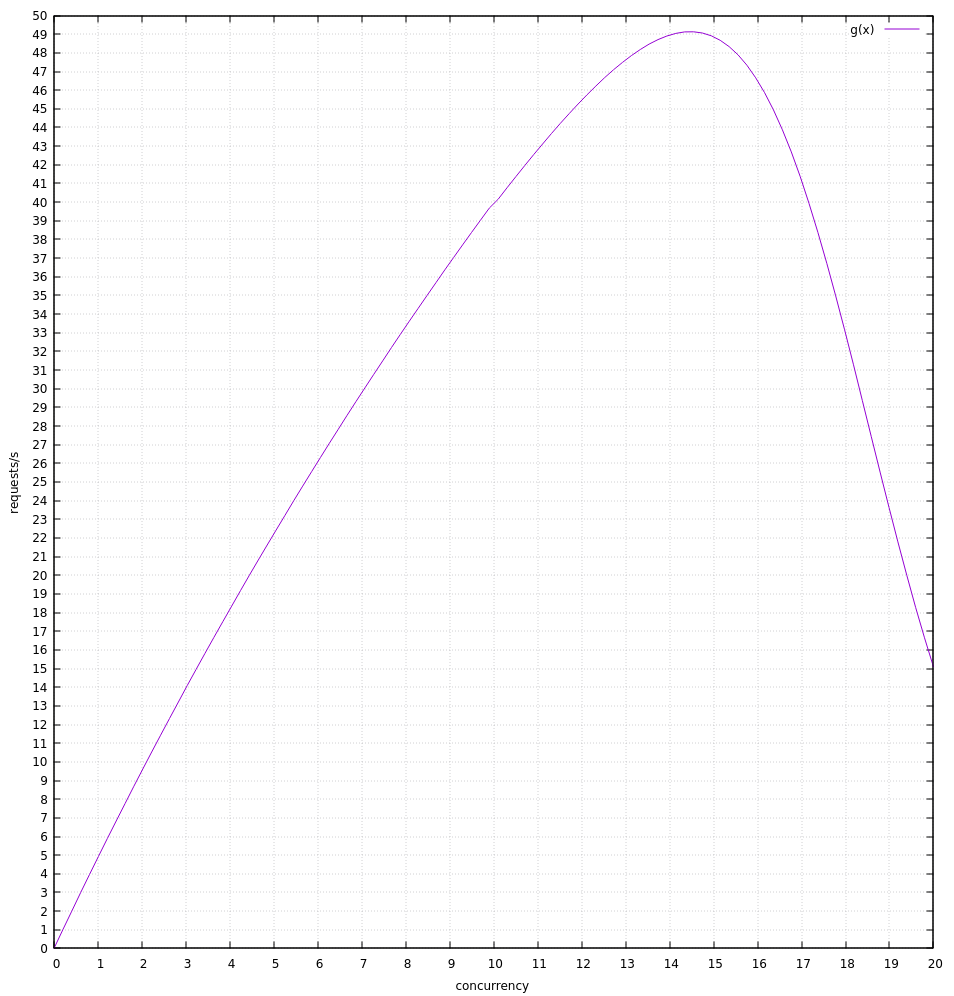
Yeah, it seems to do better with a lower slope. I think this points to the threshold value constraining it poorly in the previous example.
With SLOPE=5 I see it get much closer to the theoretical max.
theoretical throughput:
vector:
It seems like it averages around 90% of theoretical max throughput (just eyeballing it).
jszwedko
on 28 Aug 2020
Excellent! :smile: Obviously needs to be able to handle when the slope is a larger linear increase than hard-coded, but the second scenario looks pretty much ideal.
bruceg
on 28 Aug 2020
As per our planning conversation, here are the primary scenarios I am aware of:
- Artificial rate limit, explicit HTTP 429 notifications
- Appears to work
- Artificial rate limit, explicit HTTP 503 notifications
- Does not work
- Artificial rate limit, dropped requests
- Works somewhat (?)
- Artificial rate limit, queued requests
- Works well
- Natural rate limit, low load slope
- Works well
- Natural rate limit, high load slope
- Works poorly, only reaches a fraction of actual throughput limit
- Natural rate limit, additional load added mid-test
- This could be modelled where the slope and knee shift left at some time into the test run.
- Untested
- Natural rate limit, additional load removed mid-test
- Ditto, the above but shifting right during the test.
- Untested
Plus all of the above with high jitter (RTT variance), which likely works poorly due to not accounting for RTT variance. I am preparing a PR to account for this, which may also improve the response to a high(er) load slope.
bruceg
on 1 Sep 2020
Thanks for outlining these. I think these will serve as a good baseline.
I am curious what behaviors we'd see if we mixed them (like explicit 429s + the "knee" behavior), but it'd be difficult to test every permutation :smile:
I will aim to replace the ones in https://github.com/timberio/http_test_server/pull/1/files#diff-4808a89bae1bc5e82616d923d1e48cd5 with these 8. I think we can model the shifting load via the expression support if I add the time as a parameter or we use the ordinal request number and a sin wave or similar oscillation. I'll play with both.
jszwedko
on 1 Sep 2020
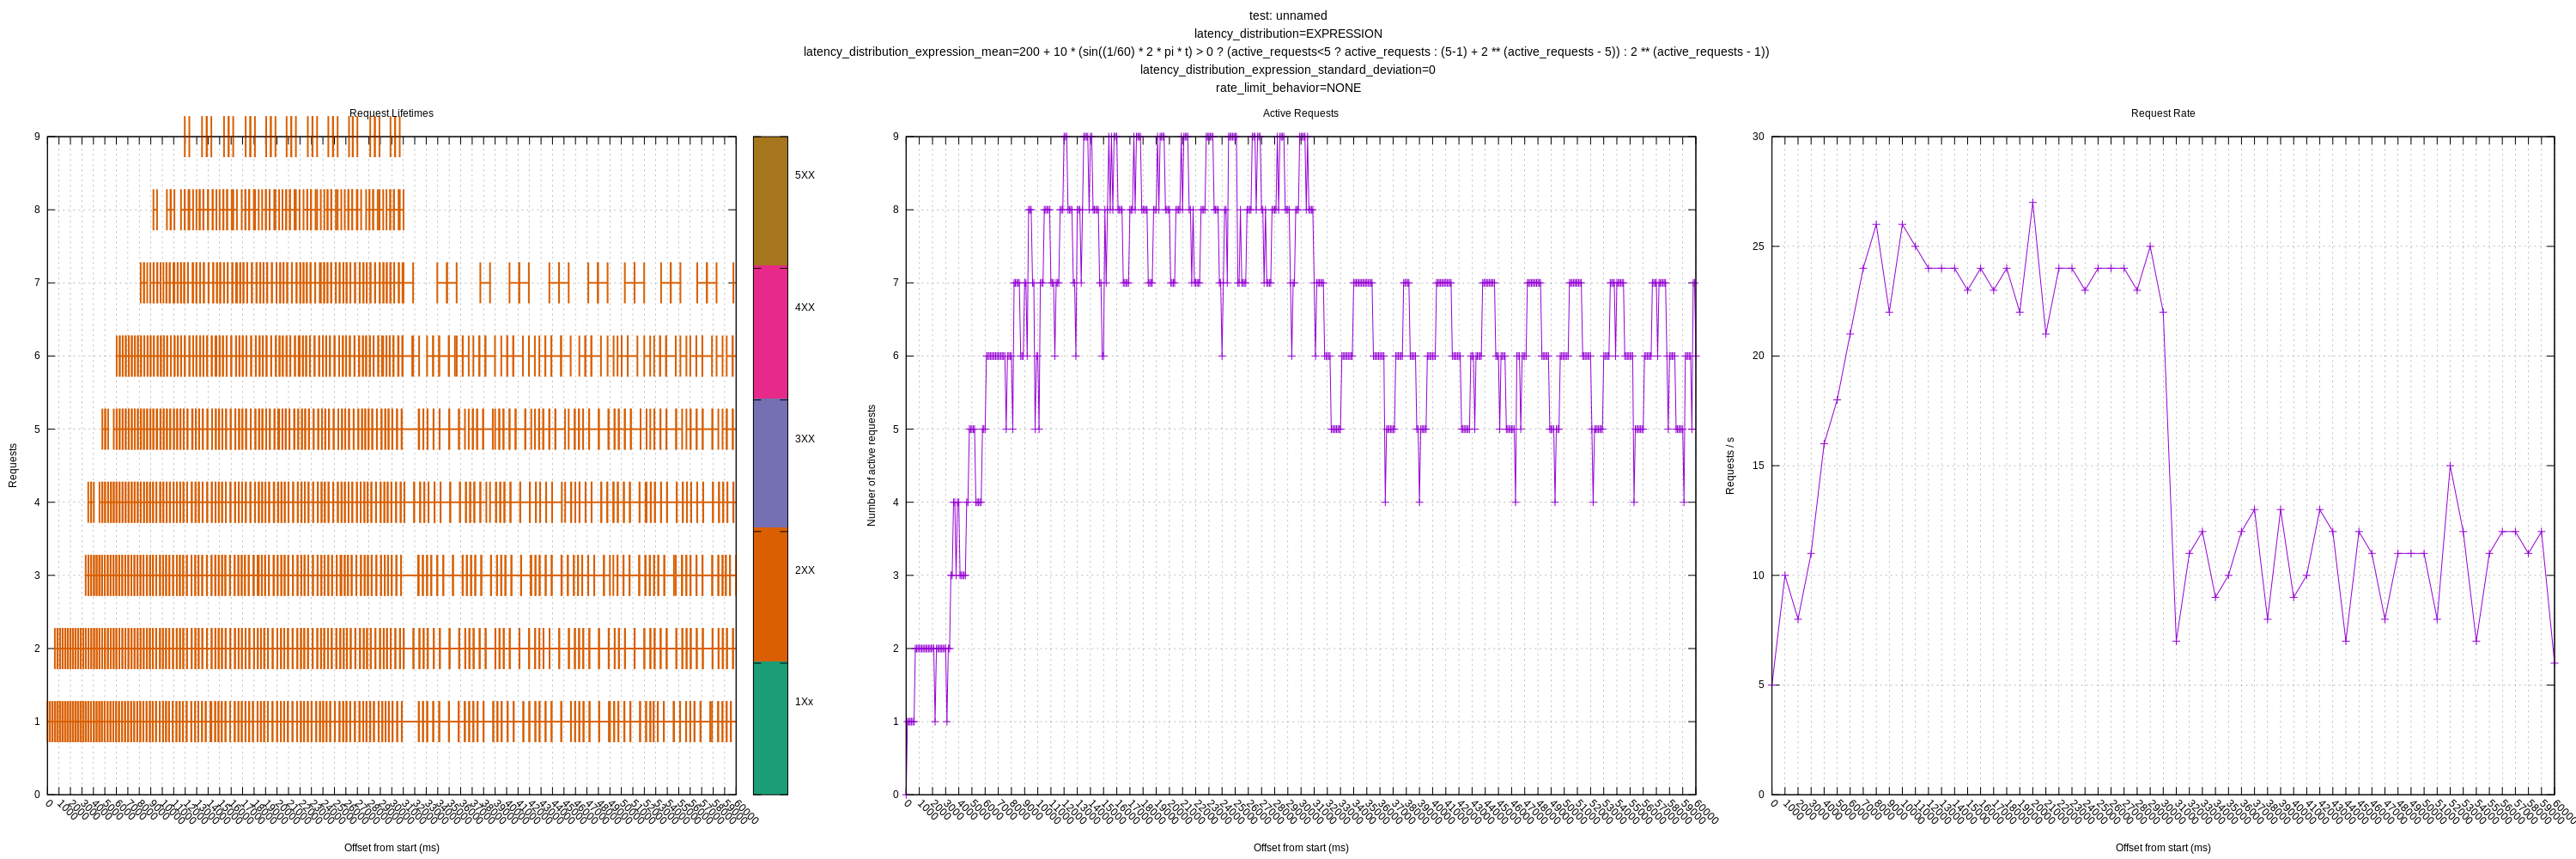
I attempted to model scenario 7 and 8. The algorithm seems to respond fairly well. These were testing with the head of master 4b47db9d.
For 7, I used:
200 +
10 * (sin((1/60) * 2 * pi * t) < 0 ?
    (active_requests<5 ? active_requests : (5-1) + 2 ** (active_requests - 5)) :
    2 ** (active_requests - 1))
Where t is the number of seconds since the start of the test. It isn't exact given the test server starts first and vector starts second, but should be pretty close.
This models shifting the "knee" left after 30 seconds (controlled by the sin() function period of 60).
The theoretical max requests look like:
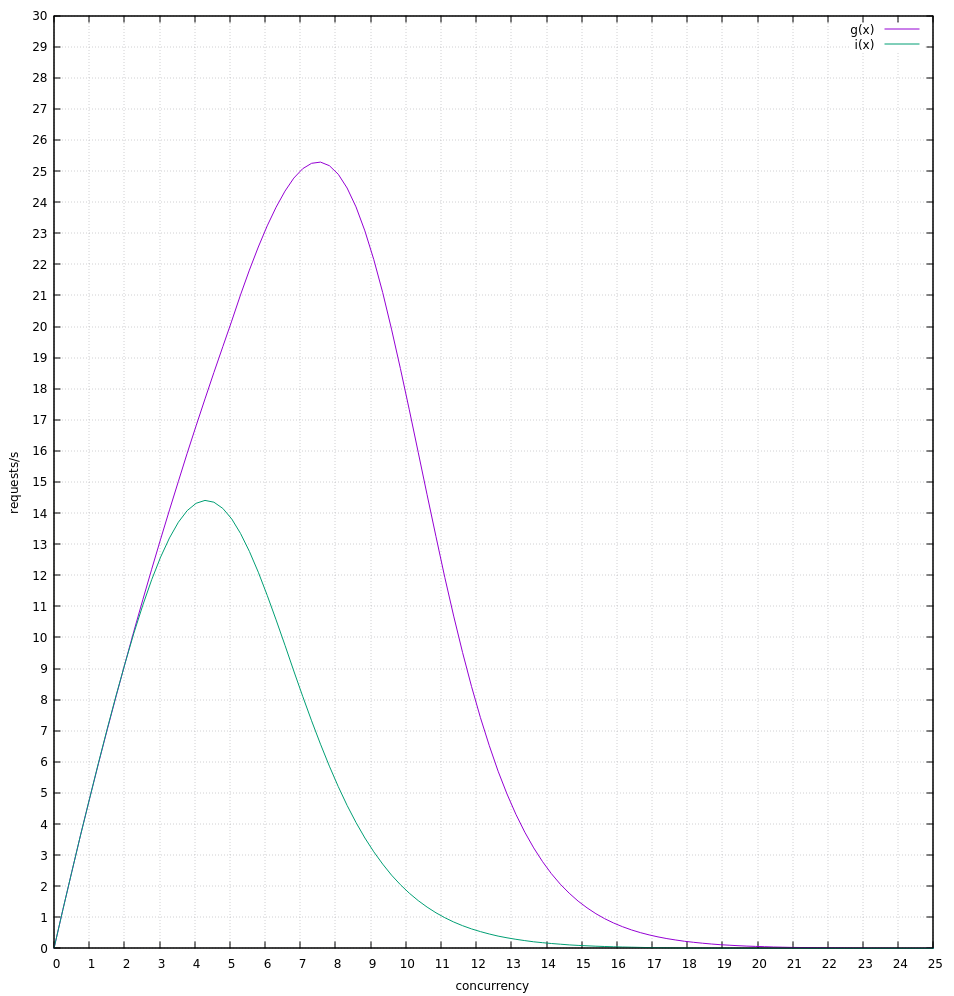
Where g(x) is before the shift at ~30s and i(x) is after. We can see the theoretical max is ~26 req/s before and 14 reqs/s after.
I ran this test for 60s to try to give it time to settle into each limit.
Plot:
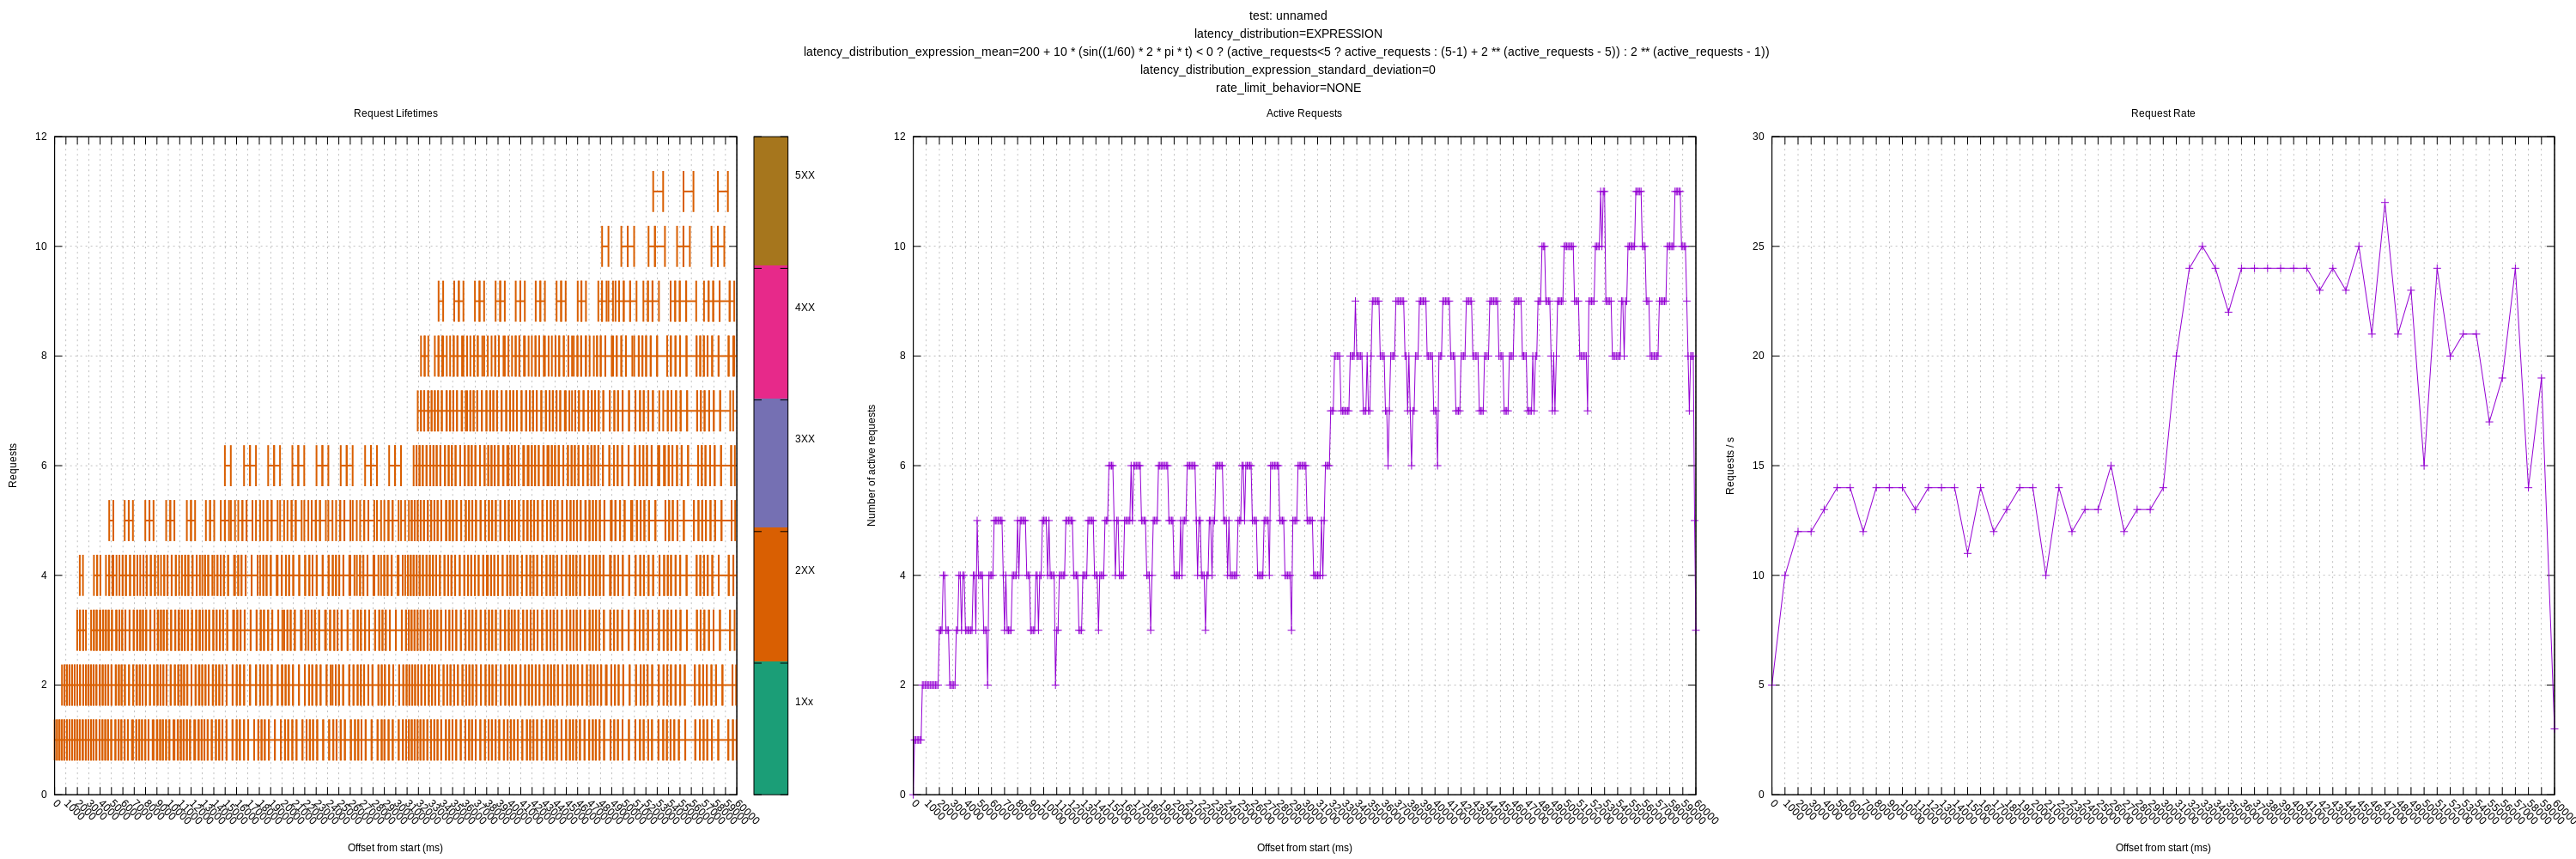
Conversely, for scenario 8, I simply switched the ternary using the sin so that it starts low and moves towards high:
200 +
10 * (sin((1/60) * 2 * pi * t) > 0 ?
    (active_requests<5 ? active_requests : (5-1) + 2 ** (active_requests - 5)) :
    2 ** (active_requests - 1))
Plot:
jszwedko
on 8 Sep 2020
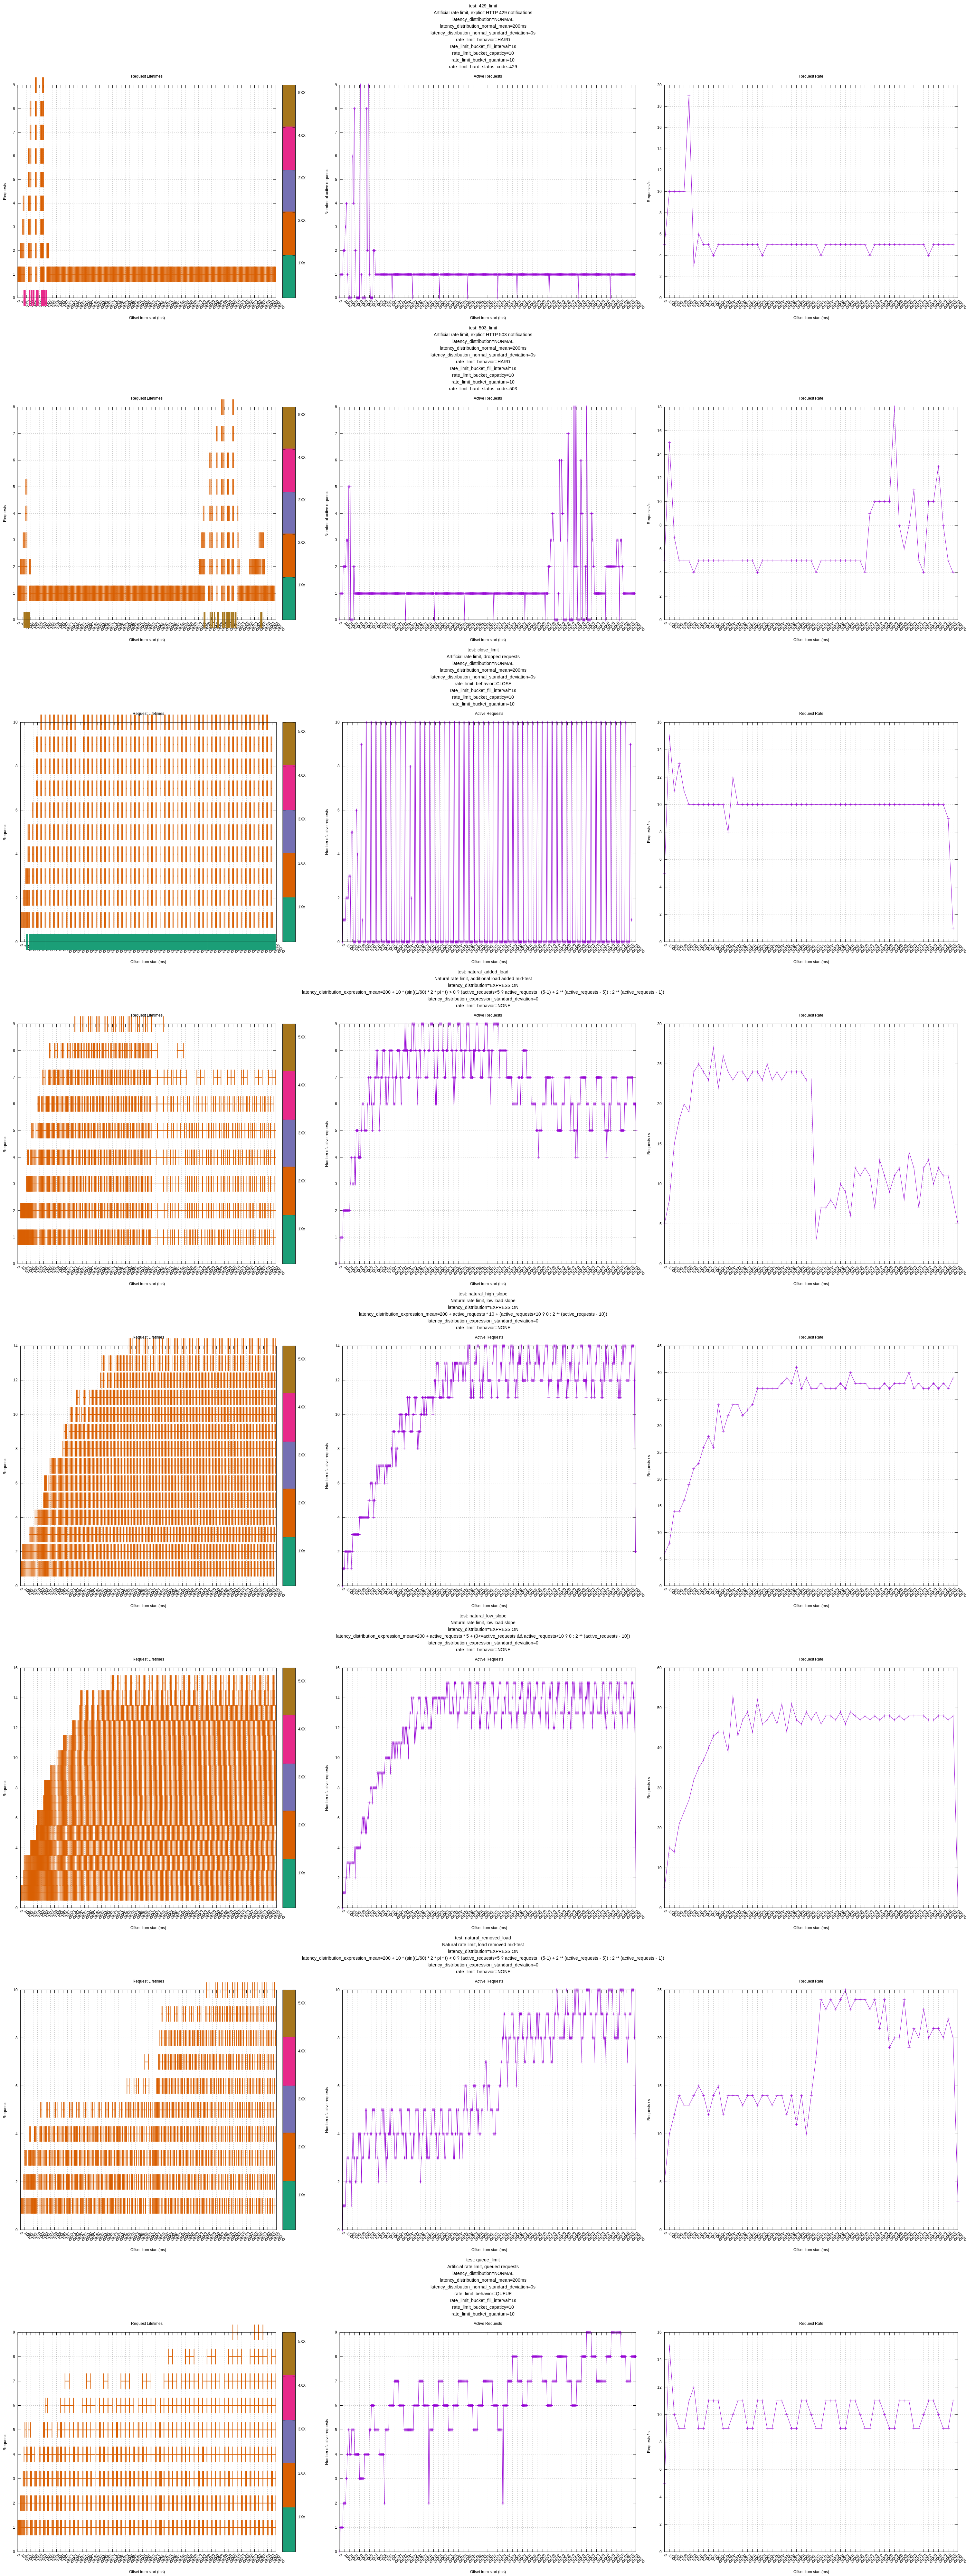
I encoded these two and the other scenarios described above into the suite, replacing the existing tests in https://github.com/timberio/http_test_server/pull/1/commits/0cdf987f8ae596661158e7ad610ebeca87fc2a4e.
Here's a current run of master (4b47db9d).
Notes:
- 429, 503, and "drop connection" behavior still seem wonky
jszwedko
on 8 Sep 2020
@jszwedko @bruceg great work on QA'ing this. I'm going to close this in favor of more specific issues like #4082 and #3998.
binarylogic
on 26 Sep 2020
Related issues
 LucioFranco
·
20Comments
binarylogic
·
21Comments
LucioFranco
·
20Comments
binarylogic
·
21Comments
 lukesteensen
·
23Comments
lukesteensen
·
20Comments
lukesteensen
·
23Comments
lukesteensen
·
20Comments
 KannarFr
·
16Comments
KannarFr
·
16Comments
Most helpful comment
As per our planning conversation, here are the primary scenarios I am aware of:
Plus all of the above with high jitter (RTT variance), which likely works poorly due to not accounting for RTT variance. I am preparing a PR to account for this, which may also improve the response to a high(er) load slope.