Version 1.3.3
HA backend: MySQL
Storage backend: s3
runtime env k8s
replicas: 3
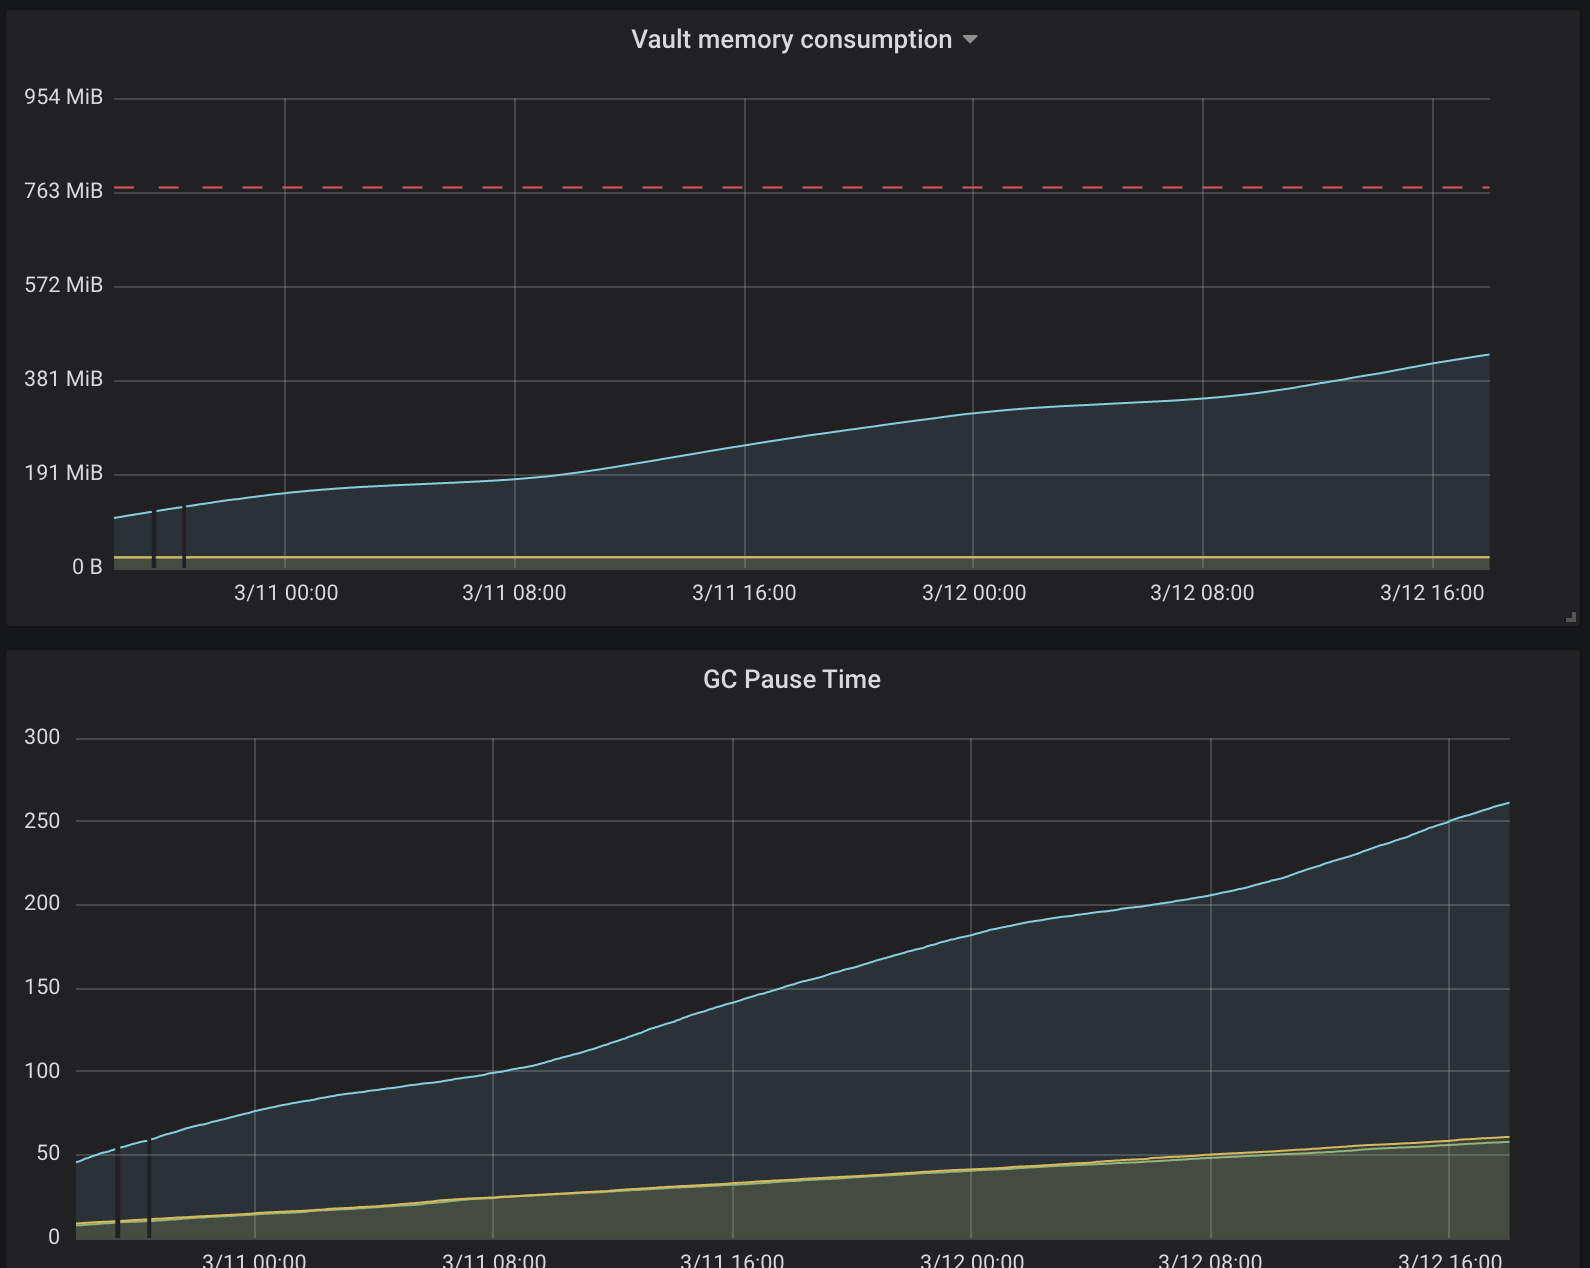
The only Vault feature used is transit engine which called at ~3reqps rate so it seems that transit engine is the main suspect.
 riuvshyn
All 4 comments
Hi! Thanks for opening this issue and providing these graphics.
Can you please add more background regarding how we could set up a Vault instance that's like yours and use it like you do?
- Your Vault config
- Which transit endpoints are in high use by your setup
That would help us reproduce it and potentially do a memory analysis. Thanks again!
 tyrannosaurus-becks
on 12 Mar 2020
tyrannosaurus-becks
on 12 Mar 2020
H! @tyrannosaurus-becks :)
endpoints are: /v1/transit/encrypt and /v1/transit/decrypt I think there are ~2x more decrypt calls.
config is very basic, it uses Mysql as HA backend and s3 as the main storage backend nothing special.
I just checked a similar setup without any load on it and there is no such mem growth, so I think you should be able to reproduce this even without HA setup, I think some simple script which will call transit encrypt/decrypt endpoints at ~5reqps will reproduce leak.
riuvshyn
on 12 Mar 2020
Thank you!
tyrannosaurus-becks
on 13 Mar 2020
@tyrannosaurus-becks Hi, I was doing some investigation on this because Vault leader pod reached mem limit a couple of days ago and wasn't killed by OOM killer and keeps working fine.
I was using container_memory_usage_bytes metric which seems to include some cached data which can be evicted on mem pressure scenarios.
So I've used then container_memory_working_set_bytes metric which is tracked by OOM killer and was surprised that actual mem consumption is very low and not growing at all.
Also I've checked heap which looks totally OK:
File: vault
Type: inuse_space
Time: Mar 16, 2020 at 10:30am (EET)
Entering interactive mode (type "help" for commands, "o" for options)
(pprof) top
Showing nodes accounting for 7392.11kB, 78.30% of 9440.73kB total
Showing top 10 nodes out of 81
      flat  flat%   sum%        cum   cum%
 1554.07kB 16.46% 16.46%  1554.07kB 16.46%  github.com/hashicorp/vault/vendor/github.com/beorn7/perks/quantile.newStream
 1497.22kB 15.86% 32.32%  3757.64kB 39.80%  runtime/pprof.writeHeapInternal
  650.62kB  6.89% 39.21%  1195.29kB 12.66%  compress/flate.(*compressor).init
  553.04kB  5.86% 45.07%  1748.33kB 18.52%  runtime/pprof.(*profileBuilder).locForPC
  544.67kB  5.77% 50.84%   544.67kB  5.77%  compress/flate.newDeflateFast
  532.26kB  5.64% 56.48%   532.26kB  5.64%  github.com/hashicorp/vault/vendor/github.com/golang/protobuf/proto.RegisterType
  520.04kB  5.51% 61.99%   520.04kB  5.51%  hash/crc64.makeSlicingBy8Table
     514kB  5.44% 67.43%  2068.07kB 21.91%  github.com/hashicorp/vault/vendor/github.com/prometheus/client_golang/prometheus.newSummary
  513.31kB  5.44% 72.87%   513.31kB  5.44%  regexp/syntax.(*compiler).inst
  512.88kB  5.43% 78.30%   512.88kB  5.43%  regexp.onePassCopy
So seems this is a false alarm :)
Maybe it still worth investigating why cache is growing along with GC pause time.
riuvshyn
on 16 Mar 2020
Related issues
 narayan8291
·
3Comments
narayan8291
·
3Comments
 gtmtech
·
3Comments
gtmtech
·
3Comments
 dwdraju
·
3Comments
dwdraju
·
3Comments
 Wonder007
·
3Comments
gtmtech
·
3Comments
Wonder007
·
3Comments
gtmtech
·
3Comments