Universal: inlineCriticalCss + extractCss have problems with global styles that can cause layout shifts
🐞 Bug report
What modules are related to this issue?
- [ ] aspnetcore-engine
- [ ] builders
- [ ] common
- [x ] express-engine
- [ ] hapi-engine
Is this a regression?
No
Description
I tested the new experimental inlineCriticalCss and there are some issues with global styles defined under "styles": [...] in the angular.json file...
build": {
  ...
  "options": {
    ...
    "styles": [ ... ]
  },
  ...
}
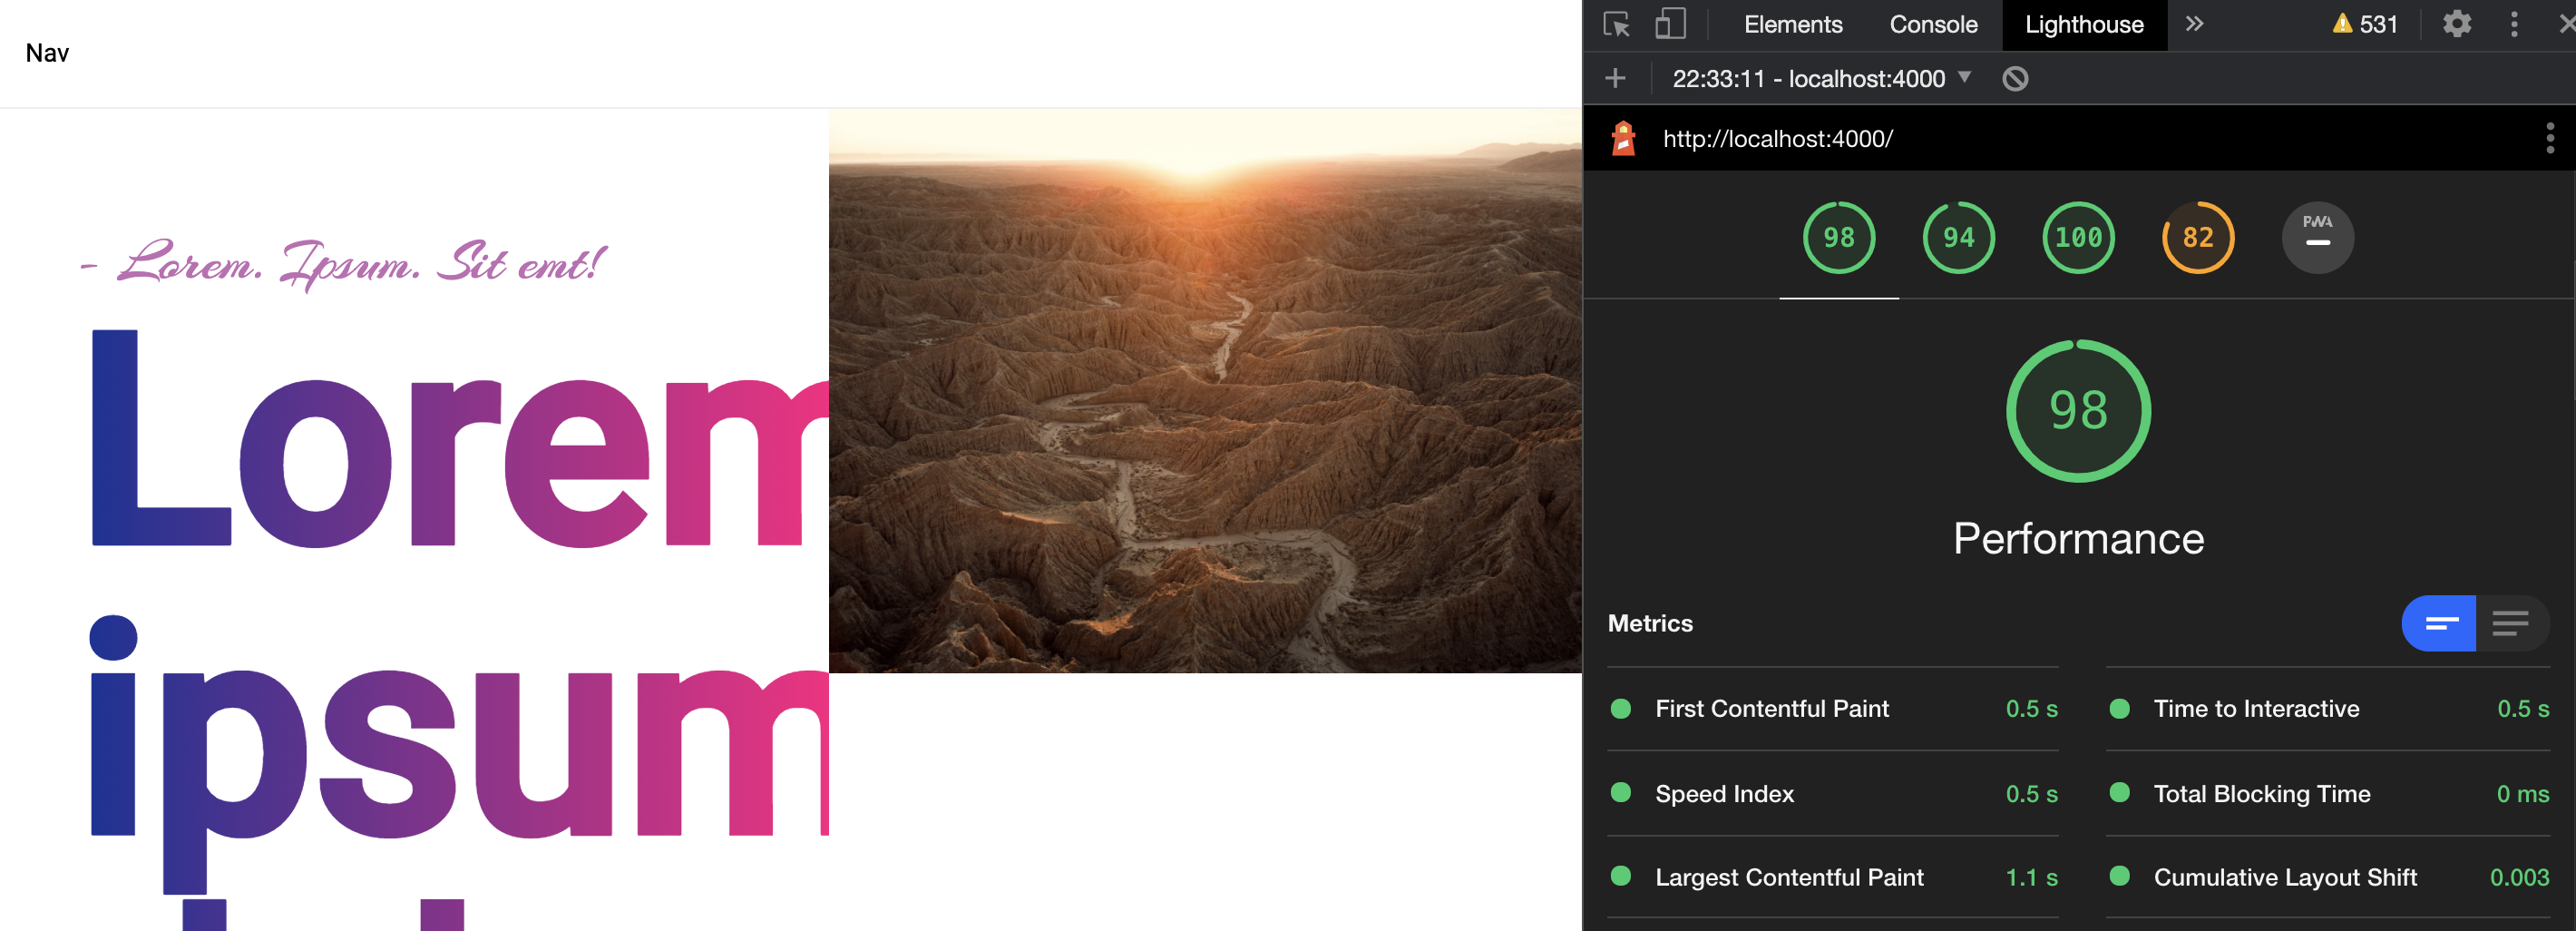
...for example the /src/styles.[s]css or NG Material themes. To make global styles work with inlineCriticalCss you must use extractCss: true to inline some of these styles otherwise they will be added at runtime. However, this causes some selector errors in the console. So I measured the performance of different solutions with Lighthouse (Chrome 87).
inlineCriticalCss:true + extractCss:true
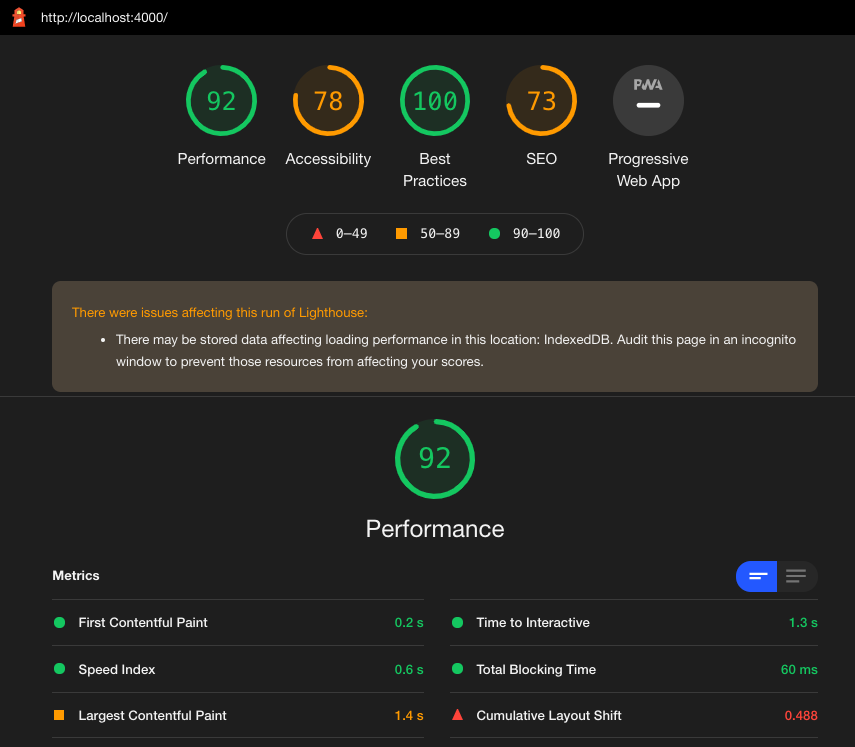
With this combination you get styles errors in the console. For example for NG Material.

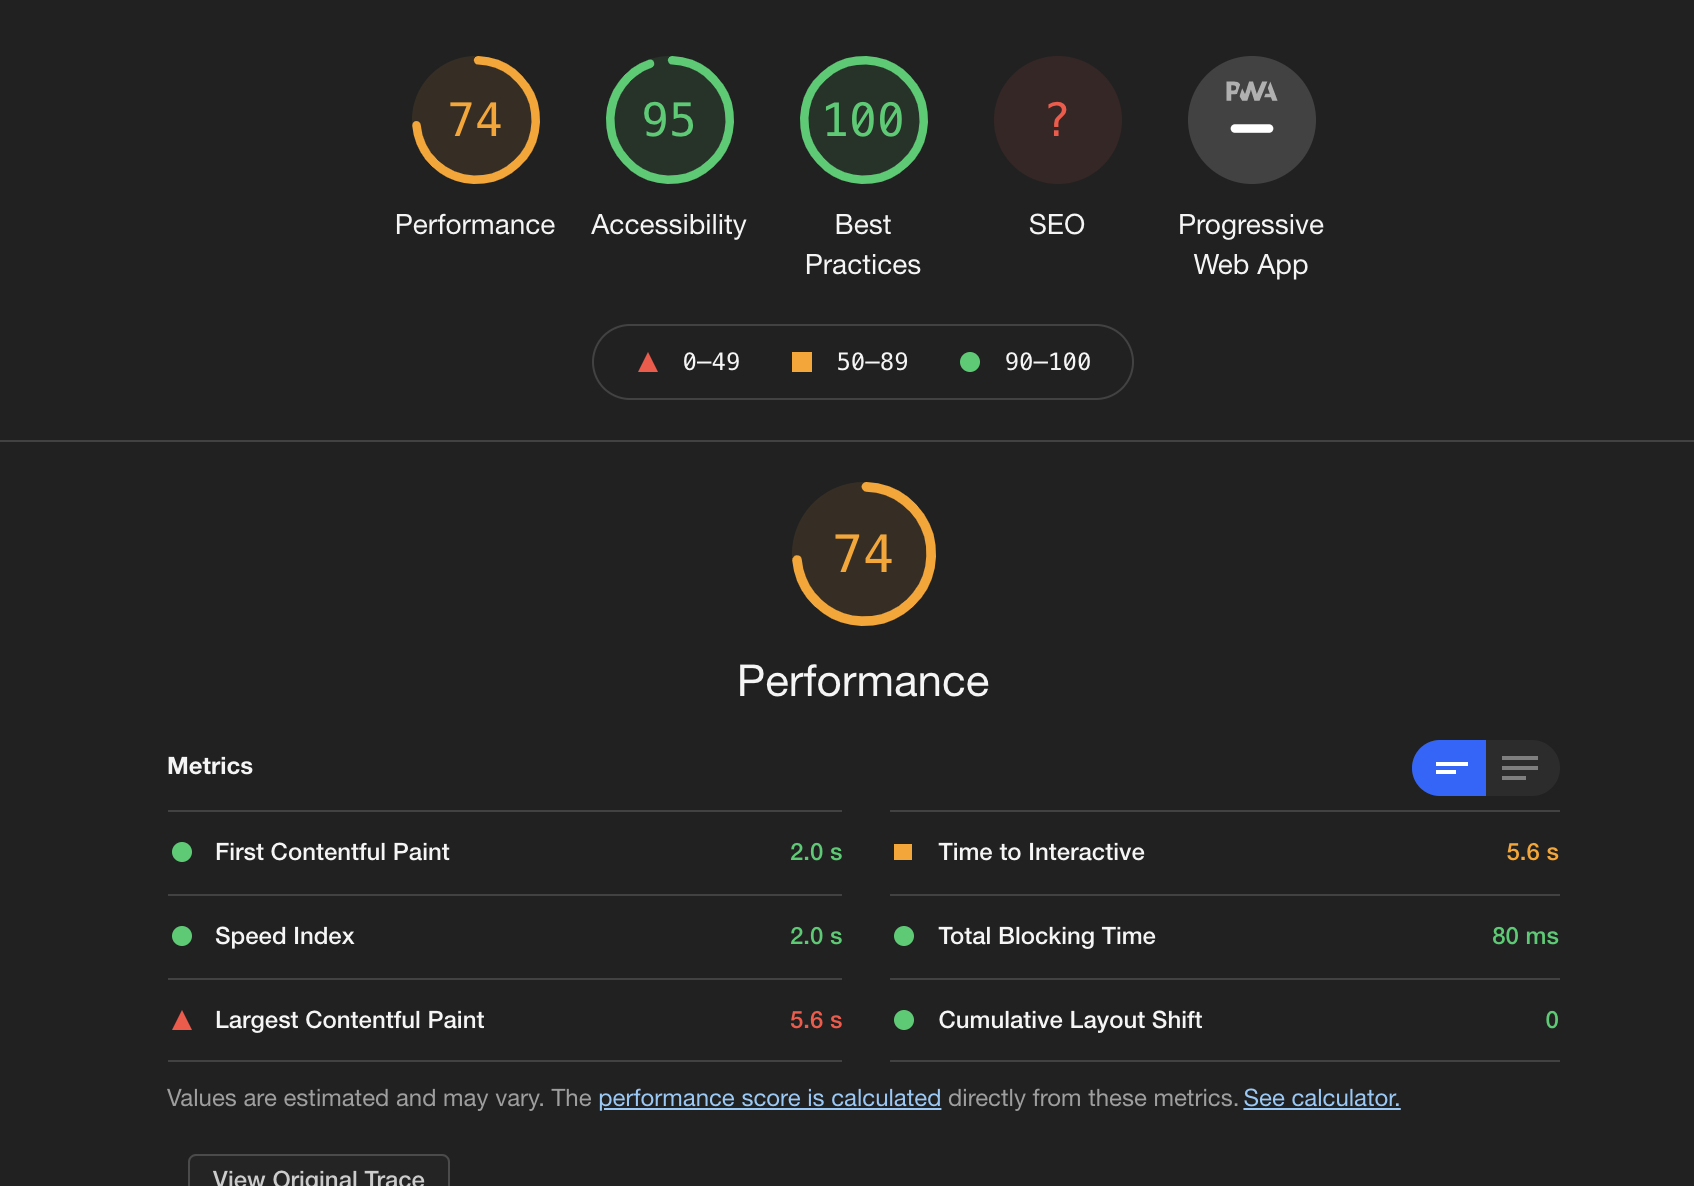
inlineCriticalCss:true + extractCss:false

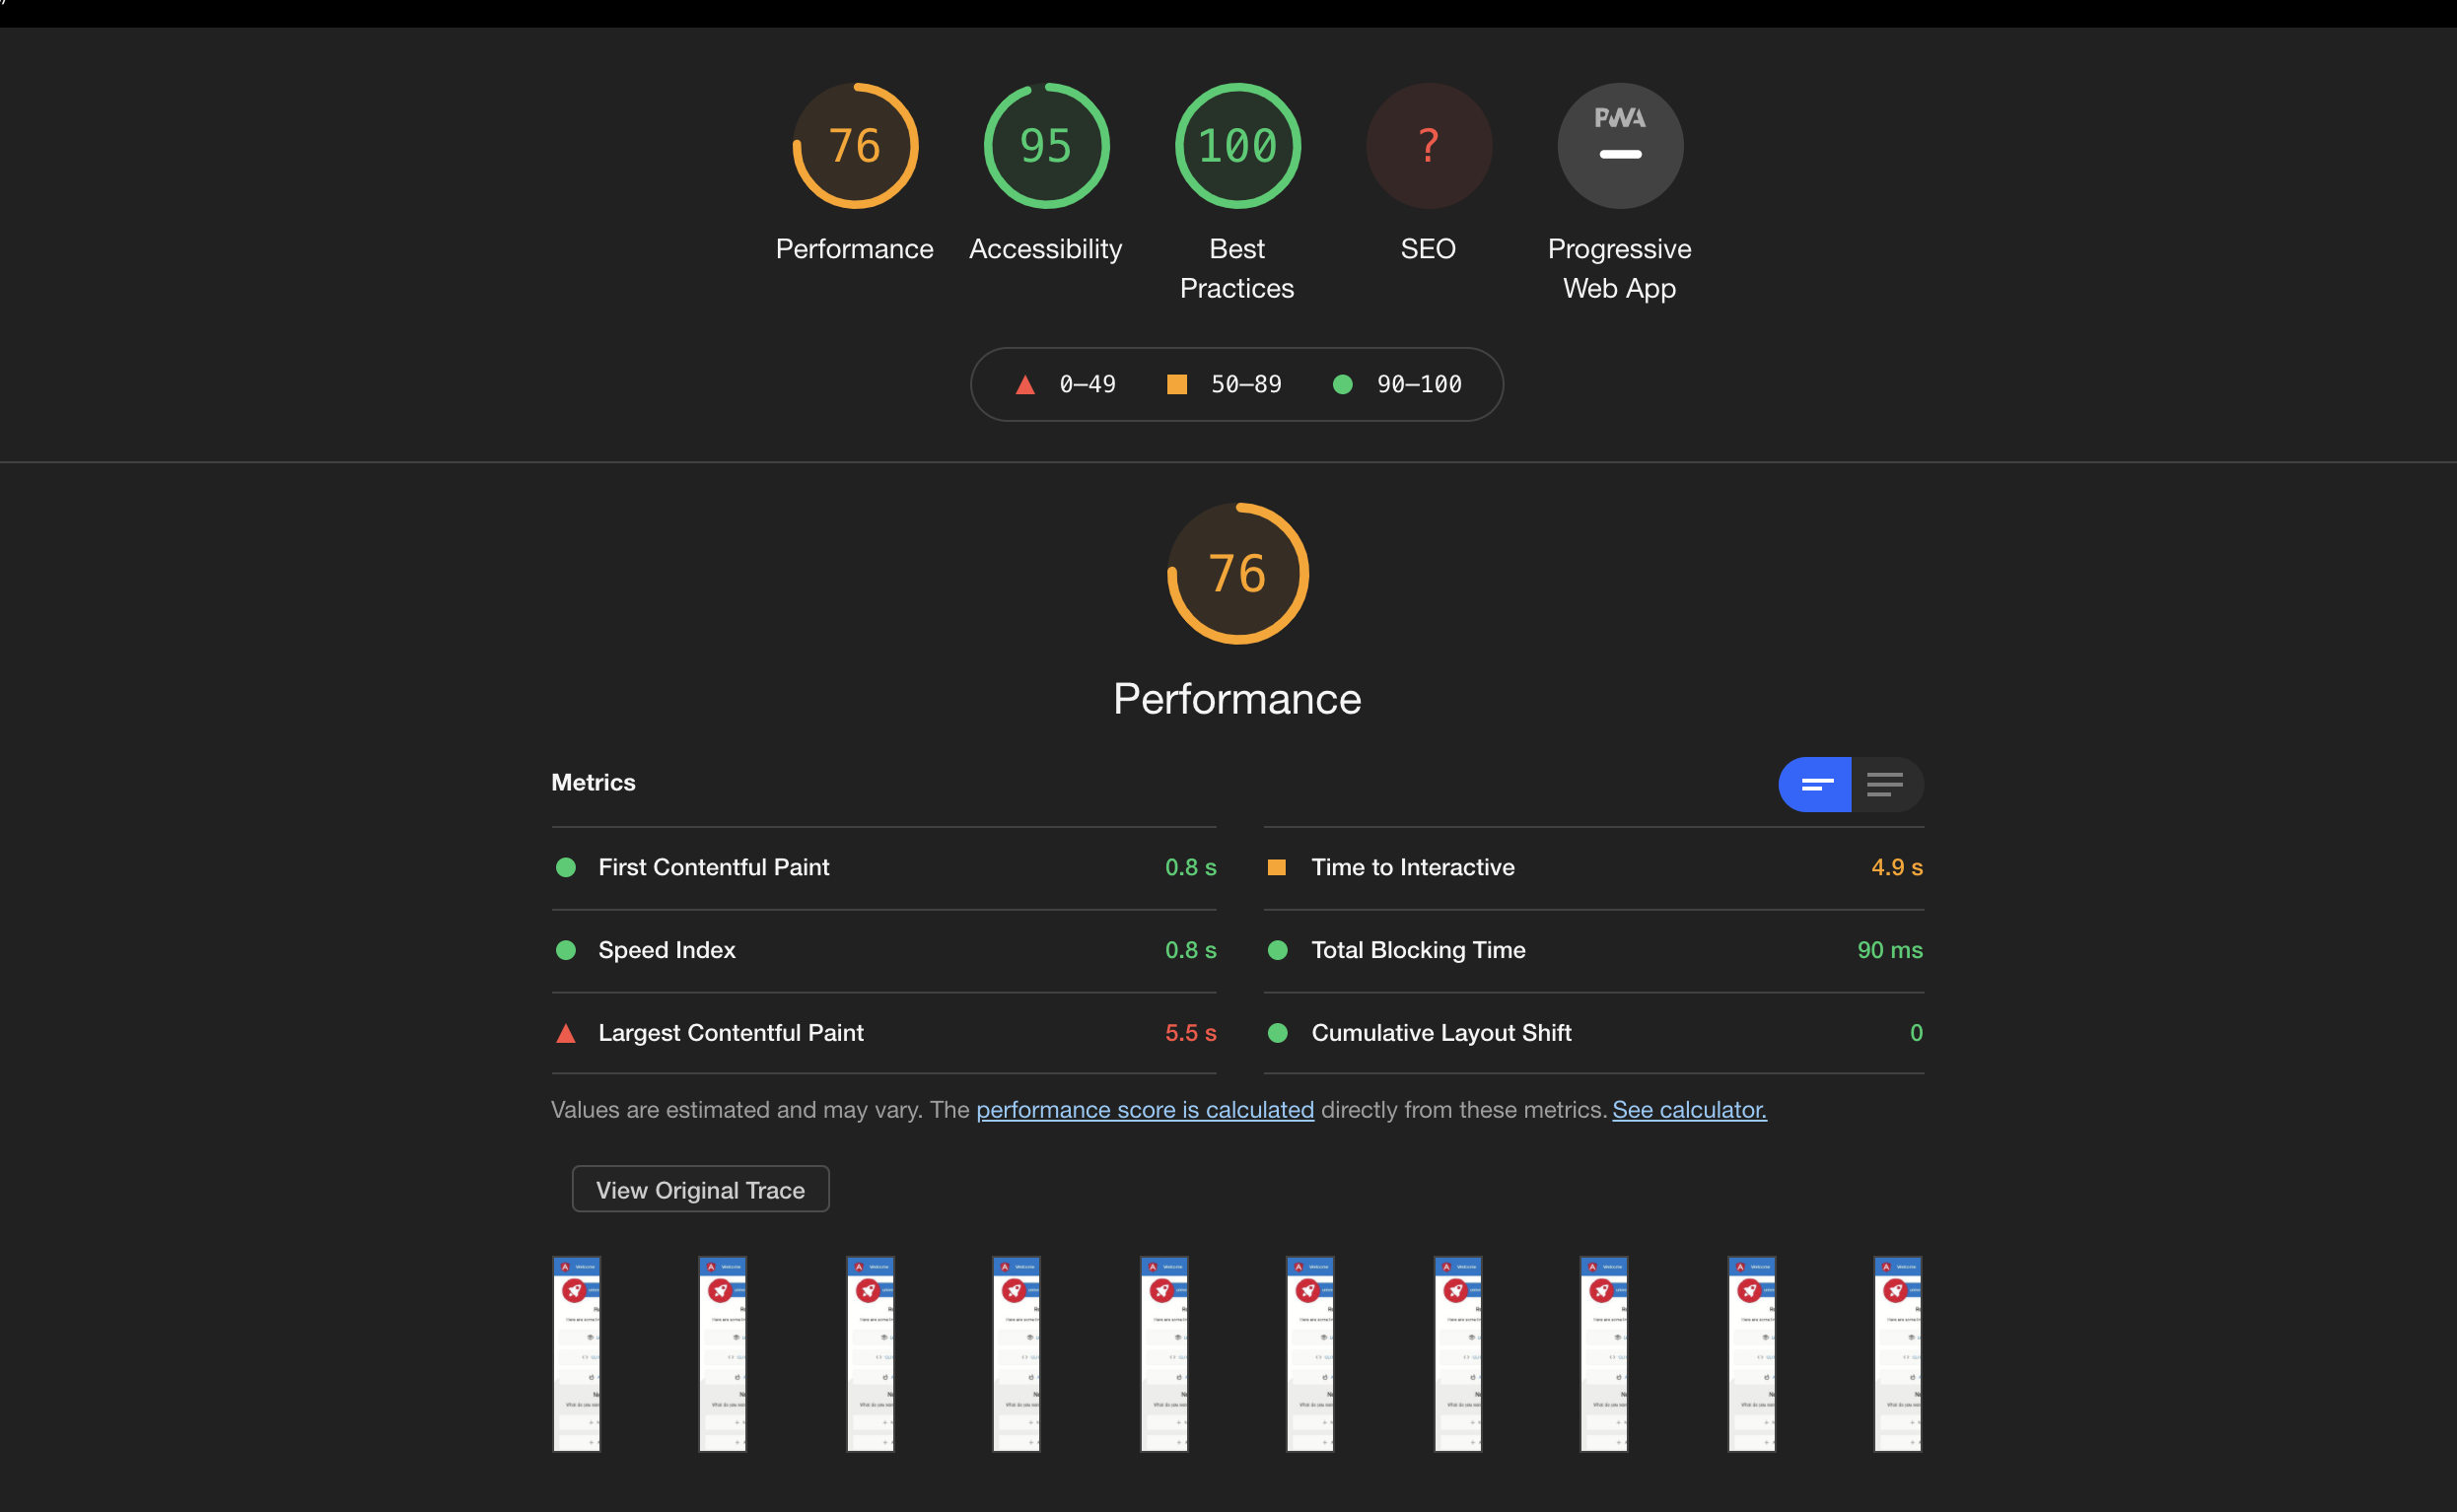
inlineCriticalCss:false + extractCss:true

PS. Ignore the problems that affect the run of Lighthouse. It was audited in an incognito window but Firebase is used and writes to IndexedDB.
tl;dr
In the current form of inlineCriticalCss it looks like you get the best performance (because of lower LCP & CLS) with global styles that can cause layout shifts without inlineCriticalCss and extractCss set to true.
🔬 Minimal Reproduction
- Add global styles that can cause layout shifts such as
.foo { display: flex; }when applied later and/or a NG Material theme to thestylesoption in your angular.json file. - Enable or disable
inlineCriticalCssandextractCssin the appropriate files.
// server.ts
  server.engine(
    "html",
    ngExpressEngine({
      bootstrap: AppServerModule,
      inlineCriticalCss: true,
    })
  );
// angular.json
      "architect": {
        "build": {
          ...
          "options": {
            ...
            "styles": [
              "node_modules/@angular/material/prebuilt-themes/indigo-pink.css",
              "src/styles.scss"
            ],
            ...
          },
          "configurations": {
            "production": {
              "fileReplacements": [
                {
                  "replace": "src/environments/environment.ts",
                  "with": "src/environments/environment.prod.ts"
                }
              ],
              "optimization": true,
              "outputHashing": "all",
              "sourceMap": false,
              "namedChunks": true,
              "extractLicenses": true,
              "vendorChunk": false,
              "commonChunk": false,
              "extractCss": true,
              "aot": true,
              "buildOptimizer": true
            }
          }
- Run
NODE_ENV=production ng build --prod && ng run <projectName>:server:production. - Run
node dist/server/main.js.
🌍 Your Environment
Angular CLI: 11.1.0-next.2
Node: 12.18.0
OS: darwin x64

Angular: 11.1.0-next.2
... animations, cli, common, compiler, compiler-cli, core, forms
... language-service, platform-browser, platform-browser-dynamic
... platform-server, router
Ivy Workspace: Yes

Package                         Version
---------------------------------------------------------
@angular-devkit/architect       0.1100.4
@angular-devkit/build-angular   0.1101.0-next.2
@angular-devkit/core            11.1.0-next.2
@angular-devkit/schematics      11.1.0-next.2
@angular/cdk                    11.0.1
@angular/fire                   6.1.4
@angular/material               11.0.1
@nguniversal/builders           11.1.0-next.0
@nguniversal/express-engine     11.1.0-next.0
@schematics/angular             11.1.0-next.2
@schematics/update              0.1101.0-next.2
rxjs                            6.6.3
typescript                      4.1.3
 akaufmann
All 7 comments
Hi @akaufmann, thanks for trying this new feature and the provided feedback.
Let me start by explaining the difference between extractCss and inlineCriticalCss,.
extractCss
This option enables extraction of CSS from .js into a .css file. This option is currently the default and in future it will be removed hence there wouldn't be an option to disable it. Previously, this option was used for a better DX.
inlineCriticalCss
Critical CSS is extracted and inlined into the HTML during rendering. This should improve FCP and reduce render blocking requests.
I tired to replicate the the above, using the steps you provided.
npx @angular/cli@next new universal-css
cd universal-css
ng add @angular/material@next
ng add @nguniversal/express-engine@next
in styles.scss added the mentioned CSS content
in app.component.html I referenced `.foo`
yarn build:ssr && yarn serve:ssr
The results are the below, I am not going to test using extractCss: false, because this is not recommended for production and as mentioned this is deprecated.
Without inlineCriticalCss
With inlineCriticalCss
I'll try to continue looking at this in the coming days, however, it would be great if you can share your project (even privately), or minimal reproduction as a Github project.
Thanks.
 alan-agius4
on 12 Dec 2020
alan-agius4
on 12 Dec 2020
Just relized that by Without inlineCriticalCss + extractCss you meant that both these options are false.
It’s interesting to see a low CLS for CSS which is loaded in JS, in the past we saw bad performance and FOUC reports when setting extractCss to false. The main reason for this is because it would take longer to load CSS, and make it non render blocking.
This option is also not intended to be used for production, it was intended for a better DX because of the overhead during watch mode to generate a .css file for stylesheets.
alan-agius4
on 12 Dec 2020
Thanks @alan-agius4 for the quick reply. I adjusted the headline for each test in my first comment to make it clearer what was set to true and what was not.
This option is currently the default and in future it will be removed hence there wouldn't be an option to disable it.
The extractCss is enabled in my app, I just wanted to check what the difference is, but thanks for clarifying that it should be true or can be omitted because this is the default for prod builds.
I see higher CLS with inlineCriticalCss: true and extractCss: true. I can't share the logic of the app but I've created a stripped down version here https://github.com/akaufmann/inlineCriticalCss-issue1918 with some lower numbers than the real app.
Here are the numbers I see with both set to true:
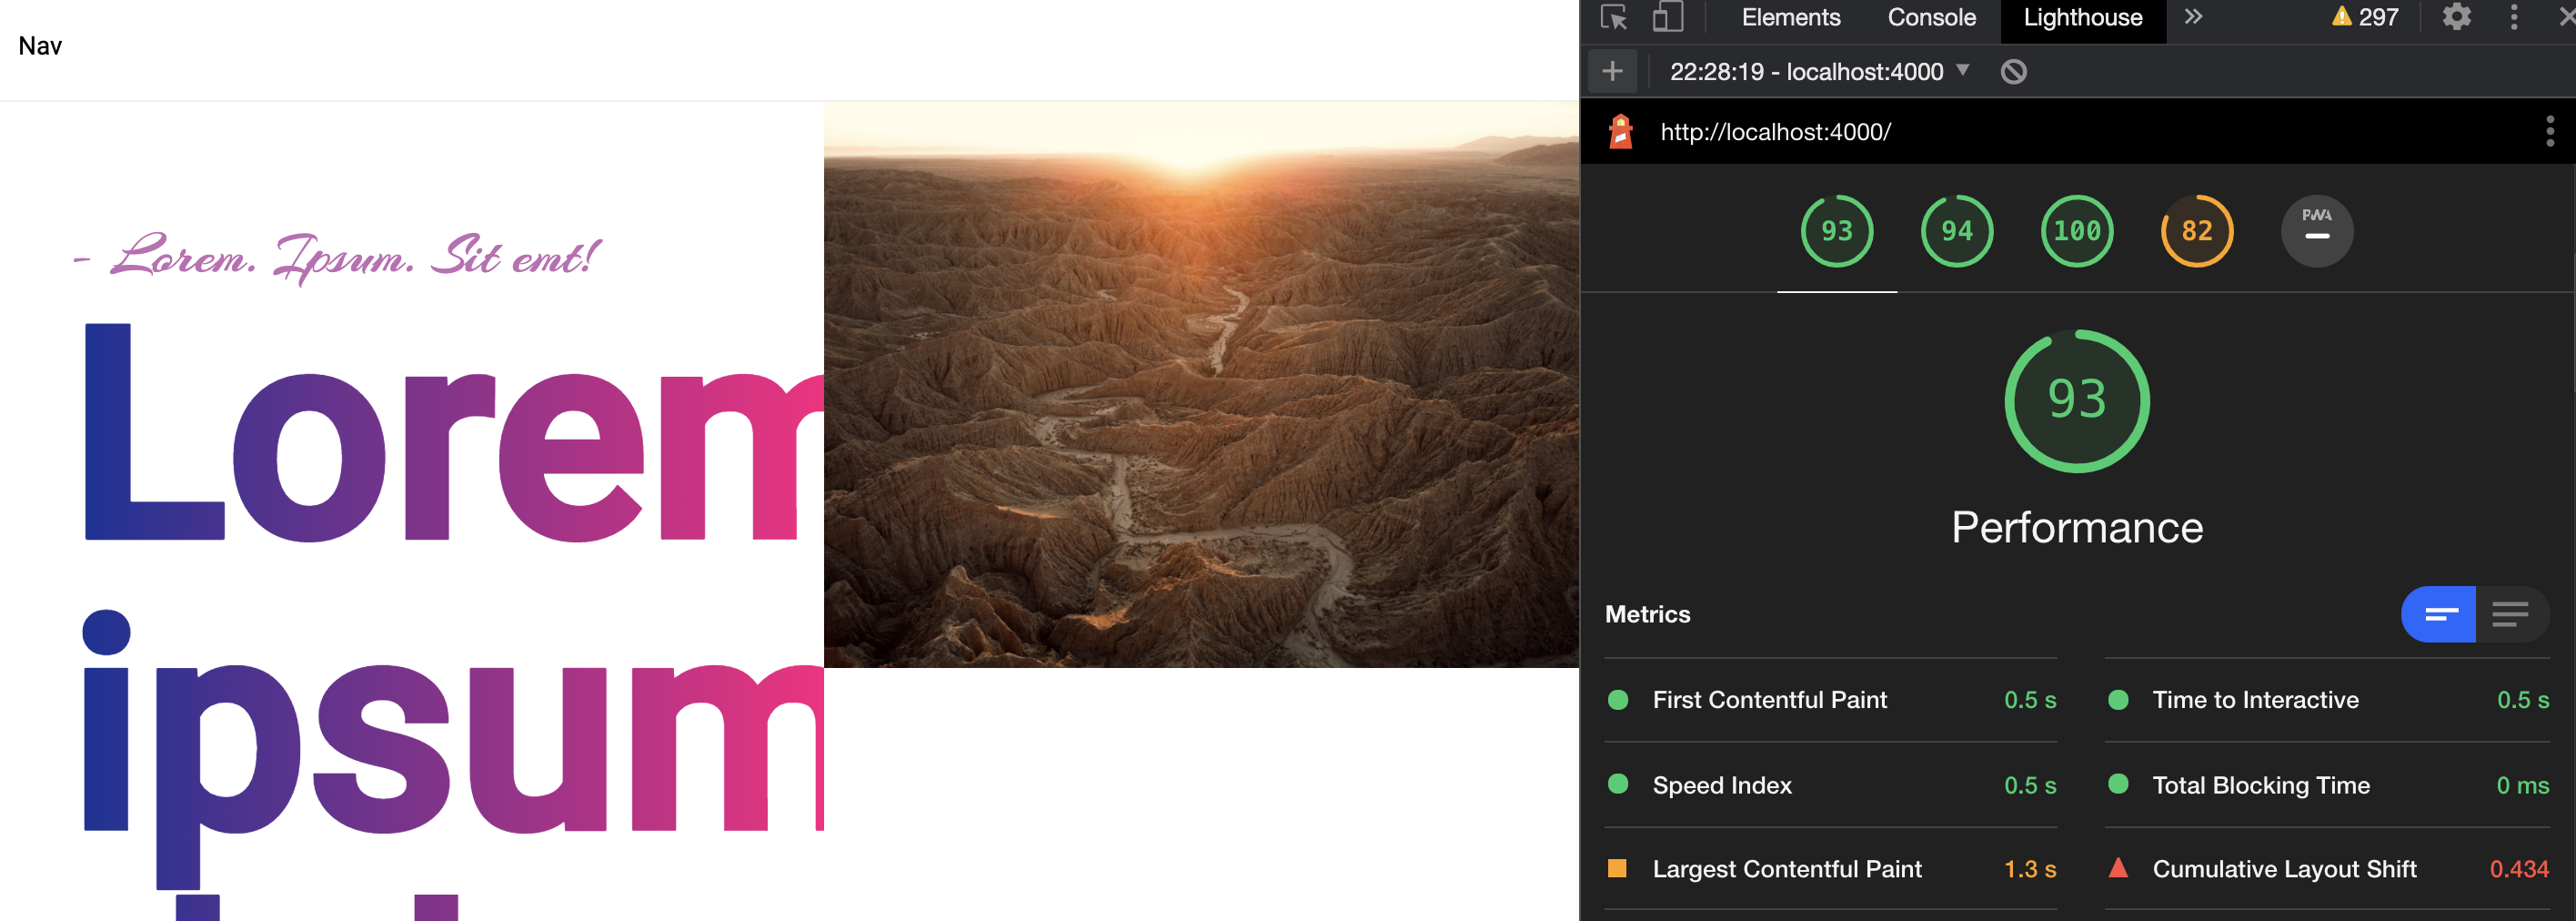
When I set inlineCriticalCss: false I see these numbers (side note: LCP is inconsistent from run to run).
akaufmann
on 12 Dec 2020
Thanks for the repro @akaufmann, I will look at it in next couple of days.
alan-agius4
on 13 Dec 2020
Hi @akaufmann,
I did take a look at the reproduction and found that;
- Critters is treating the CSS class
.md\:flexas a pseudo-classes instead of a CSS selector, this is causing the class not to be inlined and caused a drastic CLS. I have PR for this https://github.com/GoogleChromeLabs/critters/pull/68 - LCP, I download the reproduction with and without inlineCriticalCss, I get a constant LCP of ~1.2ms/1.4ms
alan-agius4
on 14 Dec 2020
Hi @alan-agius4!
LCP, I download the reproduction with and without inlineCriticalCss, I get a constant LCP of ~1.2ms/1.4ms
Yes correct, I see that too. In both cases, the numbers for LCP fluctuate in the same range for multiple runs.
Thanks @alan-agius4 for finding time to look at this so quickly and creating a fix in the Critters repo.
akaufmann
on 14 Dec 2020
The reason why LCP is fluctuating is because the duration of fetching external font resources varies between runs.
alan-agius4
on 14 Dec 2020
Related issues
 mmeylan
·
4Comments
mmeylan
·
4Comments
 flexchintoo
·
5Comments
flexchintoo
·
5Comments
 moczix
·
5Comments
moczix
·
5Comments
 inorganik
·
4Comments
inorganik
·
4Comments
 benrondeau
·
5Comments
benrondeau
·
5Comments
Most helpful comment
Hi @alan-agius4!
Yes correct, I see that too. In both cases, the numbers for LCP fluctuate in the same range for multiple runs.
Thanks @alan-agius4 for finding time to look at this so quickly and creating a fix in the Critters repo.