Umbraco-cms: 8.6.1 - Azure Web App - Indexes disappear completely
Hey Everyone,
So we have a multi-lingual site running in an Azure Web App and every so often (no pattern found yet) all the indexes completely disappear. By disappear, I mean that the examine dashboard errors as none of the indexes exist on disk at all. As various sections of the front end are powered by these indexes they result in errors being thrown.
At this point in time I'm looking for advise on things to look for in order to identify what is going on as I've never seen behaviour like this and there is nothing in the logs to indicate it has happened except errors when the front end tries to access the indexes?
Umbraco version
8.6.1
Reproduction
Unable to reproduce at this time
Specifics
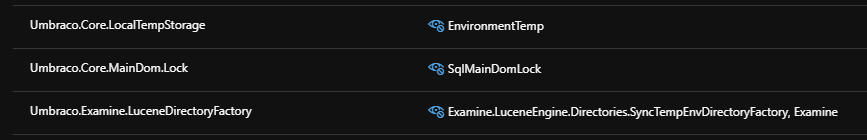
I've verified that all the correct settings are in place for Azure web apps based on the following docs:
https://our.umbraco.com/documentation/Getting-Started/Setup/Server-Setup/azure-web-apps#recommended-configuration

 NikRimington
All 61 comments
Are you load balancing? or slot swapping (which will act like load balancing if pointed to the same database). There's an issue with SqlMainDomLock for LB which you could be affected by which can cause all sorts of strange behavior. Its fixed in the upcoming 8.6.2. Perhaps you've seen/read this gigantic thread here? https://github.com/umbraco/Umbraco-CMS/issues/8006
 Shazwazza
on 1 Jun 2020
Shazwazza
on 1 Jun 2020
Hey Shannon :-)
Nope, not load balanced or slot swapping (Useful to know that slot swapping behaves like load balancing though as are looking to move to that in the future).
We are using Azure Pipelines to deploy straight to the live environment at the minute.
When the issue occurs (which is twice in the past 2 weeks so far), we fix it by touching web.config to trigger a restart.
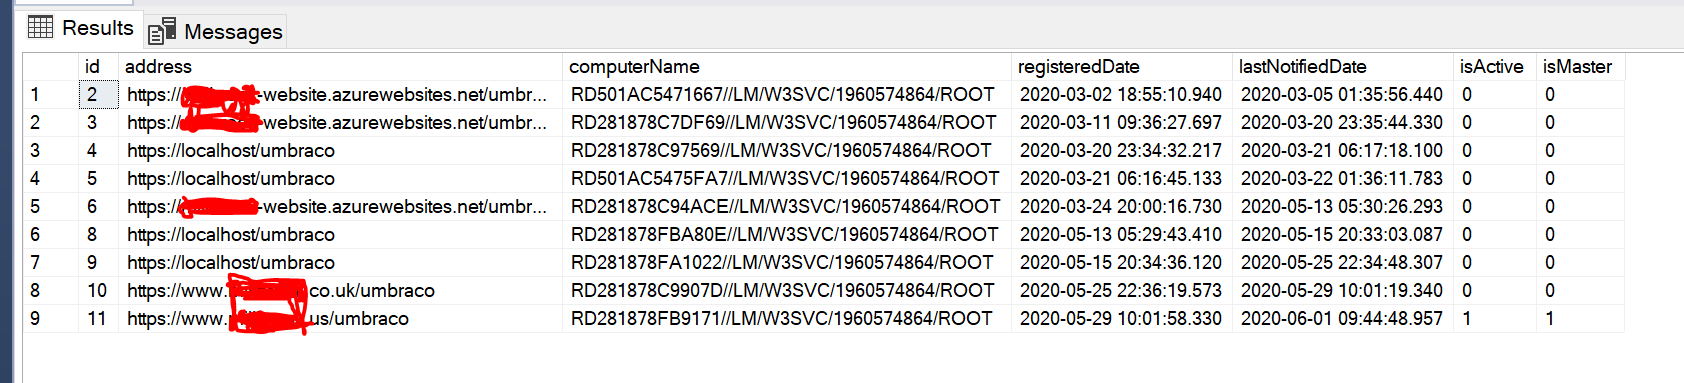
I did just check the umbracoServer table though and there are a lot of entries in there but they are all (as far as I can tell) for the same slot, so I'm guessing the changing names are when Azure moves things around.
NikRimington
on 1 Jun 2020
Hard to know then. Some users (in that giant thread i mentioned) reported strange things all at once, everyone seemed to experience something similar to you (see later in that thread). There's a chance that Azure either cleared all temp storage on their workers or something similar. We store lucene data there because it must be stored locally (not on the network share). What we are doing may not be officially supported, though MS do document that you 'can' store data where we are. They've been known to change things in their hosting like this. There's potential to try to detect something like this though so might be something to look into but would be hard to develop correctly without knowing exactly what happens. Do you have log entries leading up to and including when this occurred?
Shazwazza
on 1 Jun 2020
Do you think it would be worth trying your ExamineBlobStorage package as a way to make the examine indexes more robust and less influenced by Azure doing things?
NikRimington
on 1 Jun 2020
Hi @NikRimington I haven't ported that over for v8 quite yet. I will at some point once I find some time. Though it will have the same issue as here. Lucene doesn't run from blob storage, it's synced locally from blob storage, just like your indexes right now are synced from main storage using SyncTempEnvDirectoryFactory. If you are interested, I have a licensed project almost ready for launch if you want to try it out called ExamineX.
Shazwazza
on 1 Jun 2020
We've tried upgrading to 8.6.2, but we still get the issue on multiple v8 sites where the indexes vanish periodically. Do you think implementing Azure Local Cache might help mitigate? Is this essentially what SyncTempEnvDirectoryFactory does anyway?
https://docs.microsoft.com/en-us/azure/app-service/overview-local-cache
Thanks for any help/insight
Pete
 johnsonp57
on 29 Jun 2020
johnsonp57
on 29 Jun 2020
@johnsonp57 yes that is pretty much exactly what SyncTempEnvDirectoryFactory does.
@NikRimington I'm missing some info for a question above
Do you have log entries leading up to and including when this occurred?
I want to help but i need more information about some things:
- stack traces
- logs
- Have you tried using TempEnvDirectoryFactory instead of SyncTempEnvDirectoryFactory?
- When you say "none of the indexes exist on disk at all" what files/disk are you referring too? The files in App_Data or the local temp files? (btw you cannot see the local temp files unless you do this https://github.com/projectkudu/kudu/wiki/Configurable-settings#use-the-same-process-for-the-user-site-and-the-scm-site)
Shazwazza
on 1 Jul 2020
@johnsonp57 Also what is your config? Is this the same as @NikRimington with these 3 settings configured? https://our.umbraco.com/documentation/Getting-Started/Setup/Server-Setup/azure-web-apps#recommended-configuration
Shazwazza
on 1 Jul 2020
@Shazwazza it's taken a while to be able to marry up log entries to when the issue starts occurring but, fortunately, yesterday we were able to do just that. We also enabled the ability to see the local/temp files and my original statement that "none of the indexes exist on disk" is actually incorrect. The files do exist, but the problem is that Lucene is unable to access them.
Part of the issue I've been having in getting you information you required is the logs in general weren't showing signs of restarts and it's only recently I've learnt more about diagnostics things on Azure Web Apps.
When we looked in the Azure Application Event Logs on the web app we could see hundreds of entries that look like this:
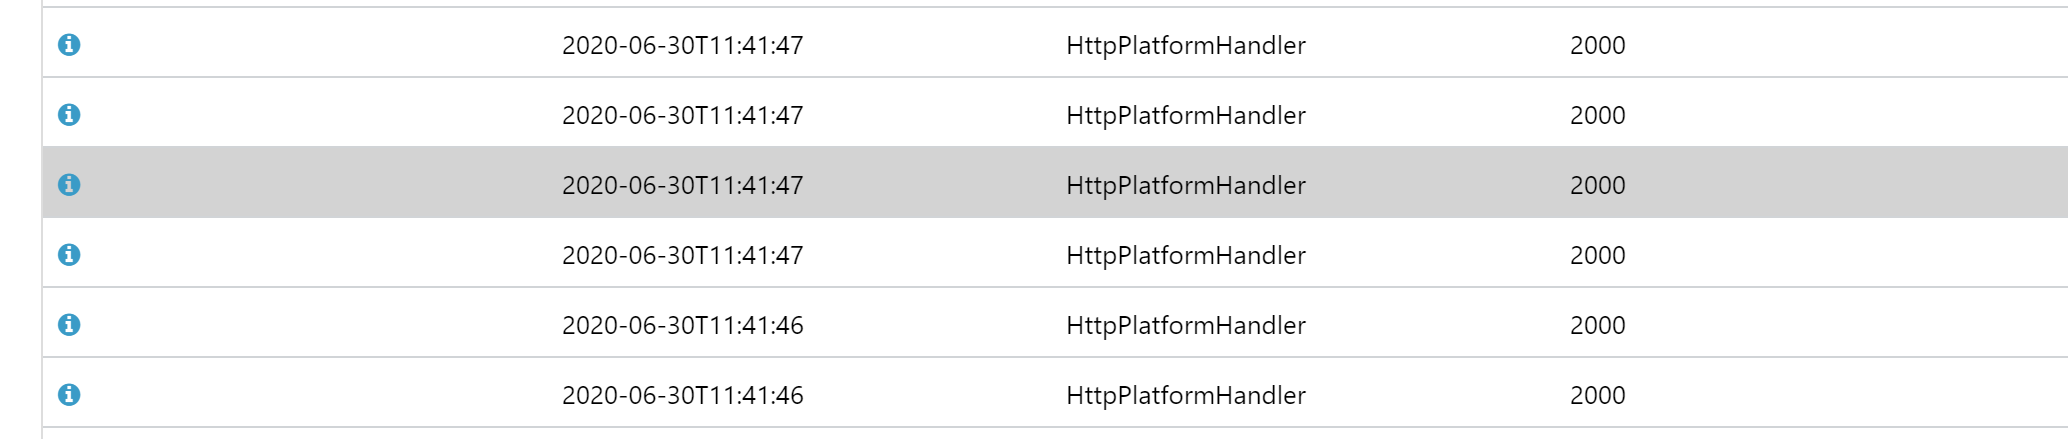
The underlying details of these are Global configuration changed. Change path: MACHINE/WEBROOT/APPHOST/WEBSITE/APP_DATA/CACHE/C/7/C, ApplicationManager: 00000272B30A20B0 [TID 10864] [PID 10976] where the path changes but always seems to be in the Image Processor Cache, followed by Recycling application MACHINE/WEBROOT/APPHOST/WEBSITE/APP_DATA/CACHE/C/7/C [TID 10864] [PID 10976]
One the error occurs and the Indexes have "vanished" this is the error that is thrown every time you try and access an index:
Lucene.Net.Store.AlreadyClosedException: this IndexReader is closed
   at Lucene.Net.Index.IndexReader.EnsureOpen() in d:\Lucene.Net\FullRepo\trunk\src\core\Index\IndexReader.cs:line 204
   at Lucene.Net.Index.DirectoryReader.GetFieldNames(FieldOption fieldNames) in d:\Lucene.Net\FullRepo\trunk\src\core\Index\DirectoryReader.cs:line 1055
   at Examine.LuceneEngine.Providers.LuceneSearcher.GetAllIndexedFields() in C:\projects\examine-qvx04\src\Examine\LuceneEngine\Providers\LuceneSearcher.cs:line 101
   at Examine.LuceneEngine.Providers.BaseLuceneSearcher.CreateQuery(String category, BooleanOperation defaultOperation, Analyzer luceneAnalyzer, LuceneSearchOptions searchOptions) in C:\projects\examine-qvx04\src\Examine\LuceneEngine\Providers\BaseLuceneSearcher.cs:line 64
   at Examine.LuceneEngine.Providers.BaseLuceneSearcher.CreateQuery(String category, BooleanOperation defaultOperation) in C:\projects\examine-qvx04\src\Examine\LuceneEngine\Providers\BaseLuceneSearcher.cs:line 49
   at ****.****.Core.Blog.BlogService.GetPagedPostsFeed(Int32 page, Int32 pageSize, Guid parent, IEnumerable`1 categories) in D:\a\1\s\src\****.****.Core\Blog\BlogService.cs:line 93
Our current working theory is that due to all the restarts, some of them aren't completing successfully and at some point start up operations are happening at the same time as shut down operations resulting in Lucene being a closed state.
We've followed advice from your 2016 blog post about the FCN and moved the Image Processor Cache out of the web root, however this morning the issue is back (just with out the entries in the Application Event Log).
The Umbraco logs show no signs of restarts that I can find other than when I forced a restart to bring the the indexes back.
What does the TempEnvDirectoryFactory setting do? I've not tried it no.
So you are aware @johnsonp57 and I work together so he is referring to the same site(s) as I am (we've currently got 3 different ones showing the same issue).
NikRimington
on 1 Jul 2020
Today's occurrence doesn't have any errors around it, it appears to have happened somewhere between two different errors:
This is from the Umbraco logs
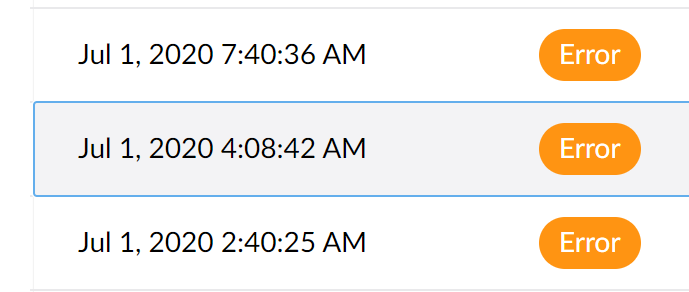
The error at 4am is ImageProcessor, and the one at 7.40 is me checking the site is workingLucene.Net.Store.AlreadyClosedException: this IndexReader is closed
There are no indications of a shutdown/resart or anything between these two points in time.
NikRimington
on 1 Jul 2020
So I've been trying to dig through Umbraco logs to find things that stand out as "related" but this could be red herring.
However, there are occurrences where rebuilding the indexes fail with the following exception being thrown:
System.AggregateException: One or more errors occurred. ---> System.InvalidOperationException: This SqlTransaction has completed; it is no longer usable.
   at System.Data.SqlClient.SqlTransaction.ZombieCheck()
   at System.Data.SqlClient.SqlTransaction.Commit()
   at NPoco.Database.CompleteTransaction()
   at Umbraco.Core.Scoping.Scope.DisposeLastScope() in d:\a\1\s\src\Umbraco.Core\Scoping\Scope.cs:line 388
   at Umbraco.Core.Scoping.Scope.Dispose() in d:\a\1\s\src\Umbraco.Core\Scoping\Scope.cs:line 365
   at Umbraco.Core.Services.Implement.ContentService.GetPagedDescendants(Int32 id, Int64 pageIndex, Int32 pageSize, Int64& totalChildren, IQuery`1 filter, Ordering ordering) in d:\a\1\s\src\Umbraco.Core\Services\Implement\ContentService.cs:line 606
   at Umbraco.Examine.ContentIndexPopulator.PopulateIndexes(IReadOnlyList`1 indexes) in d:\a\1\s\src\Umbraco.Examine\ContentIndexPopulator.cs:line 77
   at System.Threading.Tasks.Parallel.<>c__DisplayClass17_0`1.<ForWorker>b__1()
   at System.Threading.Tasks.Task.InnerInvokeWithArg(Task childTask)
   at System.Threading.Tasks.Task.<>c__DisplayClass176_0.<ExecuteSelfReplicating>b__0(Object )
   --- End of inner exception stack trace ---
   at System.Threading.Tasks.Task.ThrowIfExceptional(Boolean includeTaskCanceledExceptions)
   at System.Threading.Tasks.Task.Wait(Int32 millisecondsTimeout, CancellationToken cancellationToken)
   at System.Threading.Tasks.Parallel.ForWorker[TLocal](Int32 fromInclusive, Int32 toExclusive, ParallelOptions parallelOptions, Action`1 body, Action`2 bodyWithState, Func`4 bodyWithLocal, Func`1 localInit, Action`1 localFinally)
   at System.Threading.Tasks.Parallel.ForEachWorker[TSource,TLocal](IEnumerable`1 source, ParallelOptions parallelOptions, Action`1 body, Action`2 bodyWithState, Action`3 bodyWithStateAndIndex, Func`4 bodyWithStateAndLocal, Func`5 bodyWithEverything, Func`1 localInit, Action`1 localFinally)
   at System.Threading.Tasks.Parallel.ForEach[TSource](IEnumerable`1 source, Action`1 body)
   at Umbraco.Examine.IndexRebuilder.RebuildIndexes(Boolean onlyEmptyIndexes) in d:\a\1\s\src\Umbraco.Examine\IndexRebuilder.cs:line 55
   at Umbraco.Web.Search.BackgroundIndexRebuilder.RebuildOnStartupTask.Run() in d:\a\1\s\src\Umbraco.Web\Search\BackgroundIndexRebuilder.cs:line 93
---> (Inner Exception #0) System.InvalidOperationException: This SqlTransaction has completed; it is no longer usable.
   at System.Data.SqlClient.SqlTransaction.ZombieCheck()
   at System.Data.SqlClient.SqlTransaction.Commit()
   at NPoco.Database.CompleteTransaction()
   at Umbraco.Core.Scoping.Scope.DisposeLastScope() in d:\a\1\s\src\Umbraco.Core\Scoping\Scope.cs:line 388
   at Umbraco.Core.Scoping.Scope.Dispose() in d:\a\1\s\src\Umbraco.Core\Scoping\Scope.cs:line 365
   at Umbraco.Core.Services.Implement.ContentService.GetPagedDescendants(Int32 id, Int64 pageIndex, Int32 pageSize, Int64& totalChildren, IQuery`1 filter, Ordering ordering) in d:\a\1\s\src\Umbraco.Core\Services\Implement\ContentService.cs:line 606
   at Umbraco.Examine.ContentIndexPopulator.PopulateIndexes(IReadOnlyList`1 indexes) in d:\a\1\s\src\Umbraco.Examine\ContentIndexPopulator.cs:line 77
   at System.Threading.Tasks.Parallel.<>c__DisplayClass17_0`1.<ForWorker>b__1()
   at System.Threading.Tasks.Task.InnerInvokeWithArg(Task childTask)
   at System.Threading.Tasks.Task.<>c__DisplayClass176_0.<ExecuteSelfReplicating>b__0(Object )<---
There also other occurrences of zombie transactions causing boot failures (but less frequently and these don't seem to coincide with Index issues)
NikRimington
on 1 Jul 2020
Another update - This time I think I know the "problem" but not the cause, so hopefully some helpful information in it.
At 13:40 (approx) this site was restarted in order to bring back the indexes and at the same time I bumped the error logging up to Debug on the live environment. Approximately 10 minutes later the indexes disappeared again and this is a snapshot of the log at this point in time:
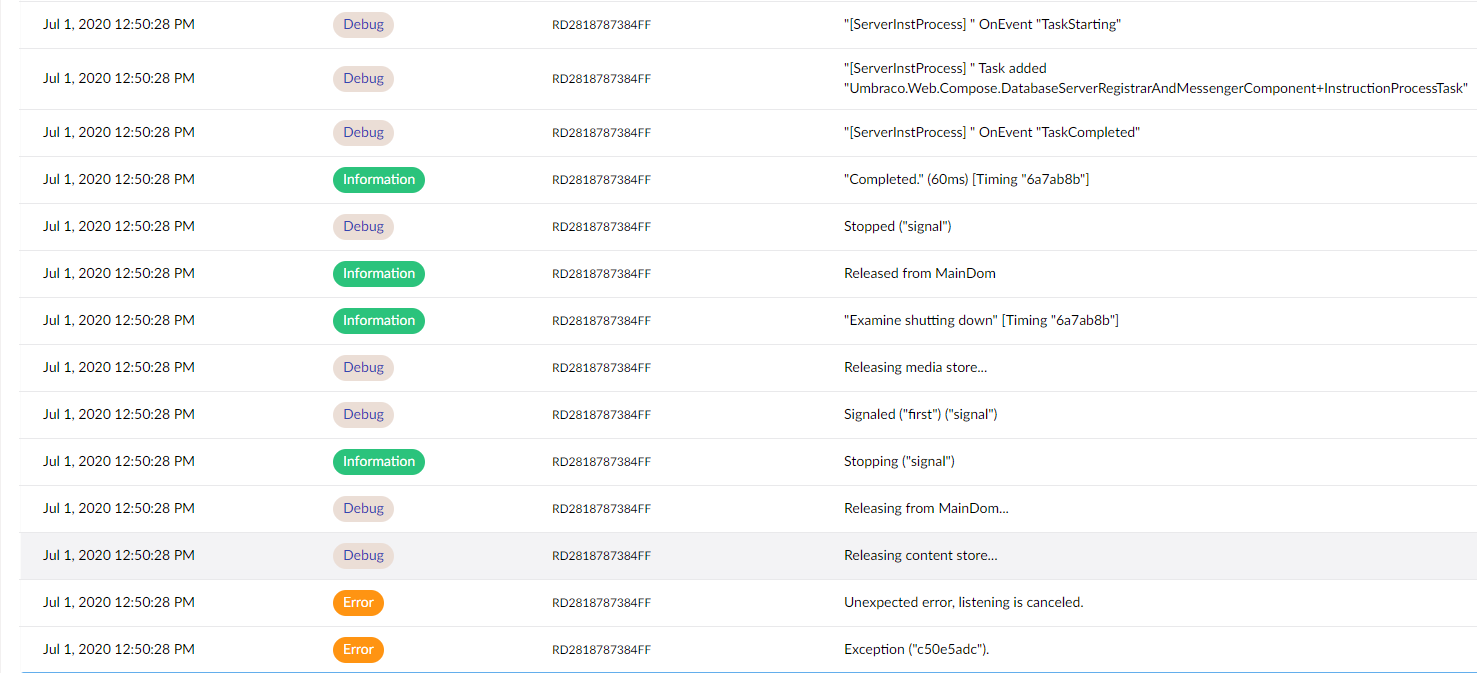
(I have a copy of the actual log file which I can e-mail to you if you want it).
Just before the error at the bottom the following 2 debug entries are present:
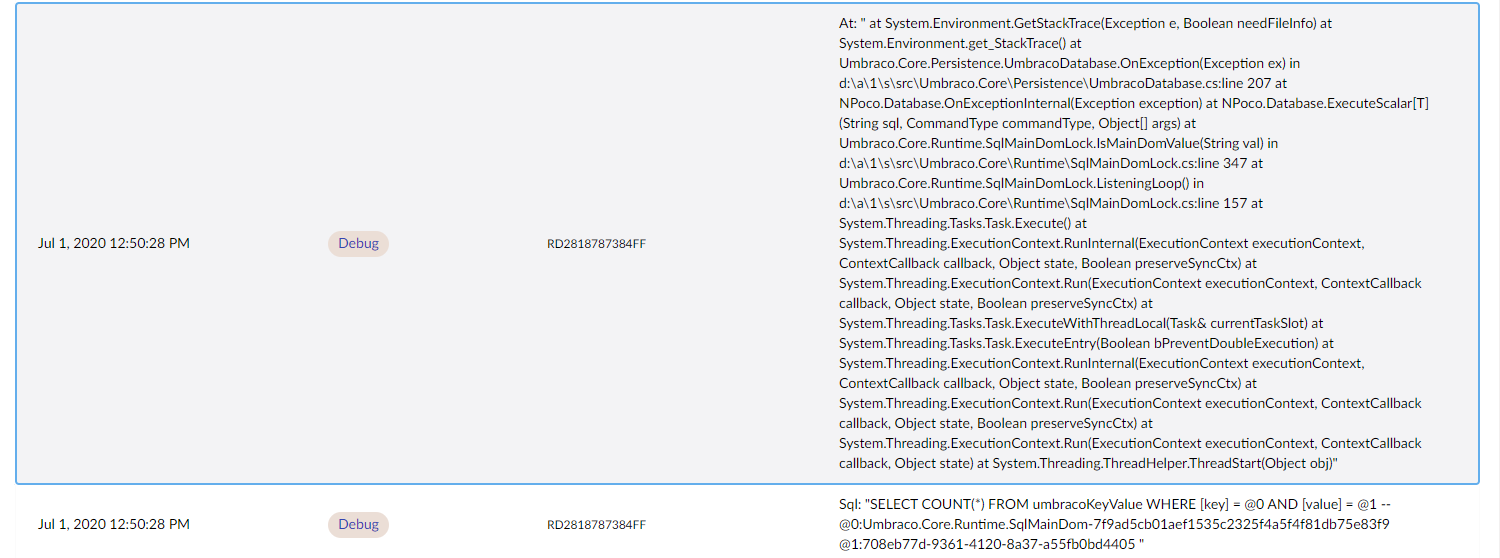
What I believe is happening is that something (yet to be identified) is triggering the MainDomLock to release and re-establish itself. What this is then doing is triggering the disposal of the ExamineManager instance, leading to the Lucene indexes becoming unavailable.
The site that this was identified on is running 8.6.3 on an Azure WebApp. It doesn't do any slot swaps or anything so shouldn't be considering itself as a load-balanced setup (although there are multiple entries in the Server table, but only a single isActive and isMaster entry).
NikRimington
on 1 Jul 2020
Many thanks @NikRimington 👍 I know this is all frustrating but it's important to try to get to the root cause. I'm also happy to add some code into Examine to see if we can mitigate some of this strangeness but as you've noted it's most likely not an Examine/Lucene issue, its the management of it which is controlled by MainDom and when you've got restart loops things can get real ugly.
The 'zombie' error is also interesting and I think that's actually a bug and at some point I'm pretty sure we've removed the parallelization of these queries, perhaps that is only in dev/v8 branch or in netcore but it could certainly be part of the issue and we will remove that parallization call since it's causing more problems than solving them.
I can see that you have Debug level logging enabled but what I find extremely strange is that you said there's nothing in your actual log files indicating shutdown or startup? If you could send me your raw logs that would be super appreciated, my email is shannon at umbraco dot com.
What does the TempEnvDirectoryFactory setting do? I've not tried it no.
The differences are listed here https://our.umbraco.com/Documentation/Getting-Started/Setup/Server-Setup/Load-Balancing/file-system-replication#examine-directory-factory-options "SyncTempEnvDirectoryFactory" is used for single instance Azure sites purely as a performance helper so that indexes don't need to be rebuilt from scratch when azure moves your site to another worker. It is the exact same concept as the Blob storage provider for lucene/examine, except instead of having the 'main' index in blob storage it's just in normal storage but the actual lucene index operates from local/temp storage which lazily 'syncs' the files from main storage when required.
I'll have a peek into the CMS and Examine code based on your stack traces but will be super helpful if you can get me your raw log files too. Thanks!
Shazwazza
on 2 Jul 2020
Have created a PR regarding the Parallel usage based on one of your stack traces https://github.com/umbraco/Umbraco-CMS/pull/8371
Shazwazza
on 2 Jul 2020
At the risk of adding potentially irrelevant information to the issue and letting the GitHub issue spiral out of control again, I want to report my similar experience of today.
My logs look similar to @NikRimington's: (no notable logs before and after this screenshot as far as I can tell)
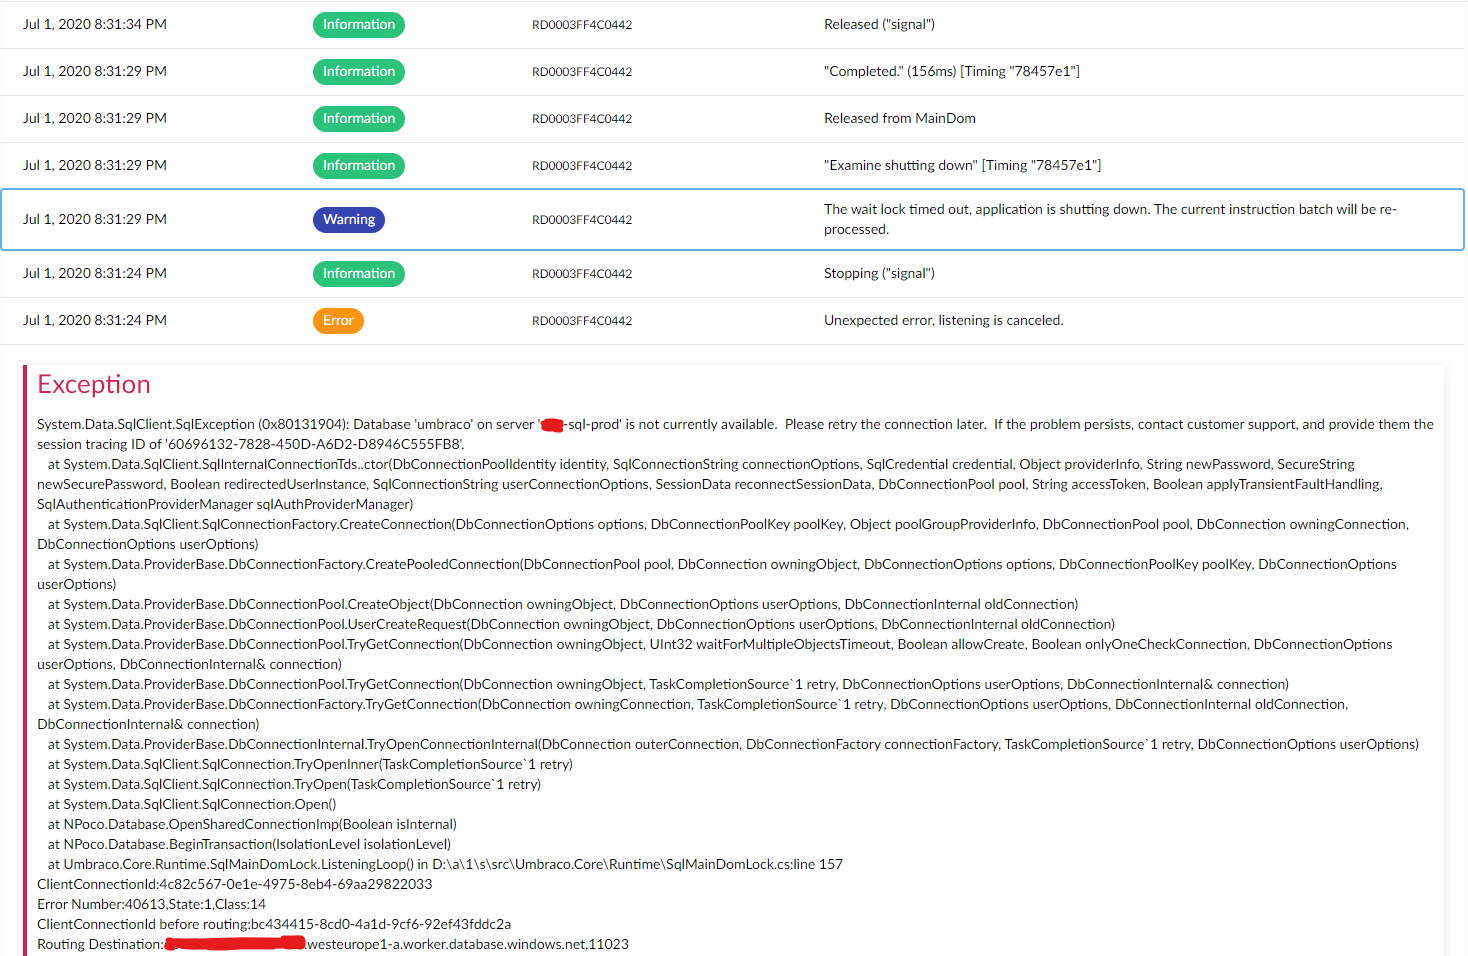
It looks as if there was an issue connecting to the SQL database, resulting in the application trying to shut itself down. However, it seems like it never did, as after this screenshot no logs occurred for about twelve hours, and even after that no logs seem to indicate actual restarting. If the application actually restarted I would expect more logging in that sense (e.g. terminating scheduled tasks, 'booting' logs, etc). This only occurred when I touched the web.config this morning.
Symptoms of the issue point mostly to Examine: On media/content save/publish, the error 'App is shutting down so index batch operation is ignored' is thrown. The Examine Dashboard was also broken (in the logs there is a warning 'Cannot get GetIndexFieldCount, the writer is already closed'). We are actually not using Examine on the website, so the website seemed to keep on working. I also think most of the publishing actually succeeded, but I did not explore this fully.
After touching the web.config, the website restarted fully and all seemed well again. After rebuilding the InternalIndex from the dashboard, the index contained a few more documents than before rebuild, likely due to the publishes mentioned earlier not being indexed properly.
Some more info about the set-up: There are one non-public-facing site ('CMS') and two public-facing sites ('PUB') running on the same database, hosted on Azure. Additionally, every site has a 'staging' instance on a slot in Azure, connecting to the same database for 'swapping' (not sure if they are always running). All sites are running 8.6.2, the content is not multi-lingual. We use explicit master server registration as documented here to let the CMS site(s) be ServerRole.Master. We have the same configuration as @NikRimington mentioned in their original post, with two (small) exceptions:
- We use
TempEnvDirectoryFactoryinstead ofSyncTempEnvDirectoryFactoryon our CMS instances. - The first three settings are set in the (transformed) web.config instead of in Azure.
The logs shown are from the CMS instance, but the logs on the other two instances are exactly the same. The logs on the three staging instances are completely empty except for these exact 6 log entries.
If I had to guess, it seems like the MainDom is released without shutting down the application, leaving the instances behind in a sort of corrupt state, in which Examine seems to suffer.
 rbottema
on 2 Jul 2020
rbottema
on 2 Jul 2020
 nul800sebastiaan
on 2 Jul 2020
nul800sebastiaan
on 2 Jul 2020
@nul800sebastiaan I don't think #8371 fixes this issue, as that only fixes a (probably unrelated) exception shown in the posted logs...
 ronaldbarendse
on 2 Jul 2020
ronaldbarendse
on 2 Jul 2020
I think I had the same problem (and not on Azure)
Examine Management: Failed to retrieve indexer details: https://www.dropbox.com/s/5njt4hcr4bwuahg/Sk%C3%A6rmbillede%202020-07-02%2011.27.36.png?dl=0
It didn't solve anything trying to restart the website. I ended up deleting the TEMP folder, and after a restart everything seems to work fine again.
I get the issue every time I add a new domain - or the site gets a visit from a new domain/subdomain.
 webtimisten
on 2 Jul 2020
webtimisten
on 2 Jul 2020
@NikRimington Regarding the ImageProcessor exceptions, besides moving the disk cache outside the webroot, you might also want to upgrade to ImageProcessor.Web 4.12.1, as that fixes some errors while cleaning/trimming the cache directories: https://github.com/JimBobSquarePants/ImageProcessor/pull/807.
ronaldbarendse
on 2 Jul 2020
@nul800sebastiaan I don't think #8371 fixes this issue, as that only fixes a (probably unrelated) exception shown in the posted logs...
Whoops! Thanks for that, it's a side-issue indeed!
nul800sebastiaan
on 2 Jul 2020
I think I had the same problem (and not on Azure)
Examine Management: Failed to retrieve indexer details: https://www.dropbox.com/s/5njt4hcr4bwuahg/Sk%C3%A6rmbillede%202020-07-02%2011.27.36.png?dl=0
@webtimisten Just as a note: screenshots are not searchable, if you can copy the text of the error over then it's infinitely easier to figure out if your issue is related/fixed/etc. :-)
nul800sebastiaan
on 2 Jul 2020
@ronaldbarendse interesting, the errors we saw from ImageProcessor appeared to be related to PostProcessor, we only moved Image Processor cache because of it's mention in Application Event Logs with regards to config changes and restarts. Don't think we've seen issues of it having problems deleting folders but good to know so we can ugprade that as well just in case :-)
NikRimington
on 2 Jul 2020
Actually - after fixing the problem by deleting the TEMP folder and restarting the website, it broke again.
I get this error in the browser console on Examine Management:
DependencyHandler.axd?s=xxx.....&t=Javascript&cdv=1312276129:739
Possibly unhandled rejection: {"errorMsg":"Failed to retrieve indexer details","data":{"Message":"An error has occurred.","ExceptionMessage":"The 'ObjectContent`1' type failed to serialize the response body for content type 'application/json; charset=utf-8'.","ExceptionType":"System.InvalidOperationException","StackTrace":null,"InnerException":{"Message":"An error has occurred.","ExceptionMessage":"Could not create an index searcher with the supplied lucene directory","ExceptionType":"System.ApplicationException","StackTrace":"   at Examine.LuceneEngine.Providers.LuceneSearcher.ValidateSearcher()
   at Examine.LuceneEngine.Providers.LuceneSearcher.GetLuceneSearcher()
   at Umbraco.Examine.ExamineExtensions.GetIndexDocumentCount(LuceneIndex indexer)
   at Umbraco.Examine.LuceneIndexDiagnostics.get_DocumentCount()
   at Umbraco.Examine.UmbracoExamineIndex.get_DocumentCount()
   at Umbraco.Web.Editors.ExamineManagementController.CreateModel(IIndex index)
   at System.Linq.Enumerable.WhereSelectEnumerableIterator`2.MoveNext()
   at System.Linq.Buffer`1..ctor(IEnumerable`1 source)
   at System.Linq.OrderedEnumerable`1.<GetEnumerator>d__1.MoveNext()
   at Newtonsoft.Json.Serialization.JsonSerializerInternalWriter.SerializeList(JsonWriter writer, IEnumerable values, JsonArrayContract contract, JsonProperty member, JsonContainerContract collectionContract, JsonProperty containerProperty)
   at Newtonsoft.Json.Serialization.JsonSerializerInternalWriter.SerializeValue(JsonWriter writer, Object value, JsonContract valueContract, JsonProperty member, JsonContainerContract containerContract, JsonProperty containerProperty)
   at Newtonsoft.Json.Serialization.JsonSerializerInternalWriter.Serialize(JsonWriter jsonWriter, Object value, Type objectType)
   at Newtonsoft.Json.JsonSerializer.SerializeInternal(JsonWriter jsonWriter, Object value, Type objectType)
   at System.Net.Http.Formatting.BaseJsonMediaTypeFormatter.WriteToStream(Type type, Object value, Stream writeStream, Encoding effectiveEncoding)
   at System.Net.Http.Formatting.JsonMediaTypeFormatter.WriteToStream(Type type, Object value, Stream writeStream, Encoding effectiveEncoding)
   at System.Net.Http.Formatting.BaseJsonMediaTypeFormatter.WriteToStream(Type type, Object value, Stream writeStream, HttpContent content)
   at System.Net.Http.Formatting.BaseJsonMediaTypeFormatter.WriteToStreamAsync(Type type, Object value, Stream writeStream, HttpContent content, TransportContext transportContext, CancellationToken cancellationToken)
--- End of stack trace from previous location where exception was thrown ---
   at System.Runtime.CompilerServices.TaskAwaiter.ThrowForNonSuccess(Task task)
   at System.Runtime.CompilerServices.TaskAwaiter.HandleNonSuccessAndDebuggerNotification(Task task)
   at Umbraco.Web.WebApi.AngularJsonMediaTypeFormatter.<WriteToStreamAsync>d__1.MoveNext()
--- End of stack trace from previous location where exception was thrown ---
   at System.Runtime.CompilerServices.TaskAwaiter.ThrowForNonSuccess(Task task)
   at System.Runtime.CompilerServices.TaskAwaiter.HandleNonSuccessAndDebuggerNotification(Task task)
   at System.Web.Http.WebHost.HttpControllerHandler.<WriteBufferedResponseContentAsync>d__22.MoveNext()","InnerException":{"Message":"An error has occurred.","ExceptionMessage":"doc counts differ for segment _3: fieldsReader shows 2 but segmentInfo shows 5","ExceptionType":"Lucene.Net.Index.CorruptIndexException","StackTrace":"   at Lucene.Net.Index.SegmentReader.CoreReaders.OpenDocStores(SegmentInfo si)
   at Lucene.Net.Index.SegmentReader.Get(Boolean readOnly, Directory dir, SegmentInfo si, Int32 readBufferSize, Boolean doOpenStores, Int32 termInfosIndexDivisor)
   at Lucene.Net.Index.IndexWriter.ReaderPool.Get(SegmentInfo info, Boolean doOpenStores, Int32 readBufferSize, Int32 termsIndexDivisor)
   at Lucene.Net.Index.IndexWriter.ReaderPool.GetReadOnlyClone(SegmentInfo info, Boolean doOpenStores, Int32 termInfosIndexDivisor)
   at Lucene.Net.Index.DirectoryReader..ctor(IndexWriter writer, SegmentInfos infos, Int32 termInfosIndexDivisor)
   at Lucene.Net.Index.IndexWriter.GetReader(Int32 termInfosIndexDivisor)
   at Lucene.Net.Index.IndexWriter.GetReader()
   at Examine.LuceneEngine.Providers.LuceneSearcher.ValidateSearcher()"}}},"status":500}
FYI: We're preparing an 8.6.4 patch release with a few other fixes as well.
If you'd like test #8371 is at least helpful in eliminating that specific error then you could try the build from the build server: https://dev.azure.com/umbraco/Umbraco%20Cms/_build/results?buildId=43686&view=results (download from the "3 published" artifacts).
nul800sebastiaan
on 2 Jul 2020
@rbottema
Some more info about the set-up: There are one non-public-facing site ('CMS') and two public-facing sites ('PUB') running on the same database, hosted on Azure. Additionally, every site has a 'staging' instance on a slot in Azure, connecting to the same database for 'swapping' (not sure if they are always running). All sites are running 8.6.2, the content is not multi-lingual. We use explicit master server registration as documented here to let the CMS site(s) be
ServerRole.Master. We have the same configuration as @NikRimington mentioned in their original post, with two (small) exceptions:
I don't think the explict master instructions are for your scenario (mine as well), and I'm not sure the flexible-advanced instructions are correct.
Here's what I think should happen:
Frontend server 1 - staging slot instance - Explict Replica
Frontend server 1 - production slot instance - Explict Replica
Frontend server 2 - production slot instance - Explict Replica
Frontend server 2 - staging slot instance - Explict Replica
Backoffice server - production slot instance - Single/electable
Backoffice server - staging slot instance - Single/electable
I'm not sure anyone should be using an explicit master as you would want to use leader election to choose which backoffice slot is the master, and maybe you would want an api to allow turning on and off the ability to be elected / resign.
I would assume you would want:
- backoffice Prod slot - elected master, backoffice Staging slot, not elected master/ not electable
- Swap backoffice staging slot into production slot once the staging slot was warmed up / tests passing.
- New backoffice Prod slot elected leader, old code on backoffice staging slot not the leader/ master.
Otherwise you could run into the staging slot starting, and then two instances trying to do scheduled publishing at the same time (it happens in v7 with explicit master)
 nzdev
on 3 Jul 2020
nzdev
on 3 Jul 2020
@Shazwazza , not sure if this helps, but with the site that has been experiencing this the worst recently, the "shutdown" of MainDom appears to happen shortly after the publishing of content (not always but often). As no new content was published over the weekend, the site has been "stable" since about 16:00 on Friday (till the time of this update)
NikRimington
on 5 Jul 2020
Thanks @NikRimington , yes i believe this an SqlMainDom issue that needs to be investigated to see how it can cause itself to shutdown without being signaled by the app directly that it's shutting down. Any chance you are able to email me your raw logs from before? If you have logs of before and when this starts happening it would be very useful.
Shazwazza
on 6 Jul 2020
No problem, I've sent you over the entire set of logs we have to the site that is currently experiencing this the worst. However I'm unable to tell you exactly when the problem started. I do believe that the issue didn't exist before 8.6.0 (as there was no SqlMainDom). This site had the issue while running 8.6.0, and I upgraded it to 8.6.2 last week to see if it helped but as we know the issue persisted. Let me know if you need anything else (or if the logs don't arrive).
NikRimington
on 6 Jul 2020
Thanks @NikRimington for the logs they are helpful. I can immediately see the error that causes SqlMainDom to shutdown which is due to an SQL timeout issue. That is quite odd considering the query it's doing is to fetch a single row value, it is a very fast query so I feel like at that time there's either a distributed lock held or the SQL server is under a super heavy load. I'm researching this today to see where this can be further error checked and how to prevent this in the first place. MainDom in Umbraco entirely controls Examine's lifetime so that needs to be resolved.
Out of curiosity what Azure SQL Tier are you running? S2 or above?
Shazwazza
on 7 Jul 2020
No problem, I did wonder if the SQL timeouts could be a cause. The sites are running SQL in an Elastic Standard pool. I don't know if that makes a difference?
NikRimington
on 7 Jul 2020
@NikRimington what is the configuration of the Elastic pool? Number of databases, max DTUs/vCores for the pool and if you have a max per database?
 sitereactor
on 7 Jul 2020
sitereactor
on 7 Jul 2020
I "think" this is what you are asking? (I didn't set it up so I'm just sharing the information I can find)
Resource configuration & pricing : Standard: 100 eDTUs
Elastic databases : 41 databases
Elastic database settings : 0-50 eDTUs
NikRimington
on 7 Jul 2020
Yes, exactly. Thanks!
@Shazwazza so this does correspond to an S2 instance. I wonder if it could have been a transient error where a retry could have helped?
sitereactor
on 7 Jul 2020
This looks more like a deadlock/transaction lock to me, especially because the SqlMainDomLock seems to poll the database quite aggressively (every 100ms if it's trying to acquire the MainDom or 1000ms to check whether it's still the MainDom).
A single slow SQL query shouldn't shutdown the MainDom, so in testing manual locks could be used to simulate this or by adding WAITFOR DELAY statements in the executed queries...
ronaldbarendse
on 7 Jul 2020
You can ignore the problem I experienced. It was because my host created a new app pool every time I added a new subdomain for the same Umbraco installation.
webtimisten
on 7 Jul 2020
According to the logs SqlMainDomLock quits due to an Sql timeout not a deadlock, however there's also some other issues to sort out with regards to managing the db instance in SqlMainDomLock that can cause a double committed transaction (zombie transaction) but this isn't the cause.
There are some interesting logs from @NikRimington 's site which are due to some Sql server configurations I think which is why i asked about what type of server it is. @sitereactor yes! you are correct there is a couple logs about
I wonder if it could have been a transient error where a retry could have helped?
But we do have retries in the core and have had them for years, unless you know of a different retry that might be necessary when dealing with elastic pools?
In another couple of cases the SQL server could not be authorized which caused SqlMainDomLock to stop:
System.Data.SqlClient.SqlException (0x80131904): A connection was successfully established with the server, but then an error occurred during the login process. (provider: TCP Provider, error: 0 - The specified network name is no longer available.) ---> System.ComponentModel.Win32Exception (0x80004005): The specified network name is no longer available
And another case where SQL server just couldn't be reached causing SqlMainDomLock to stop:
System.Data.SqlClient.SqlException (0x80131904): Connection Timeout Expired. The timeout period elapsed while attempting to consume the pre-login handshake acknowledgement. This could be because the pre-login handshake failed or the server was unable to respond back in time. The duration spent while attempting to connect to this server was - [Pre-Login] initialization=24351; handshake=12766; ---> System.ComponentModel.Win32Exception (0x80004005): The wait operation timed out
And another case where the limits were exceeded on the Sql elastic pool causing SqlMainDomLock to stop:
System.Data.SqlClient.SqlException (0x80131904): Resource ID : 1. The request limit for the elastic pool is 100 and has been reached. See 'http://go.microsoft.com/fwlink/?LinkId=267637' for assistance.
Our recommended minimum for Sql Azure is S2 https://our.umbraco.com/documentation/Getting-Started/Setup/Server-Setup/azure-web-apps#recommended-configuration but we know that higher DTUs work better. I'm no expert in Sql elastic pools (Morten is though! ;) ) but according to what you posted above @NikRimington you have
Elastic database settings : 0-50 eDTUs
which would be about an S2 instance per database which it seems you are exceeding, I 'think' this is the docs about exceeding 'request' limits: https://docs.microsoft.com/en-us/azure/azure-sql/database/resource-limits-logical-server#sessions-and-workers-requests
@NikRimington you also have errors regarding index rebuilds and a Forms bug that I reported here https://github.com/umbraco/Umbraco.Forms.Issues/issues/373 however it appears this is already fixed in Forms 8.4.1 https://github.com/umbraco/Umbraco.Forms.Issues/issues/339 so you should definitely update.
I am continuing to work on this today and there is definitely some improvements in various areas to make so I'm thankful for the logs posted here and the discussion!
- Improvements to SqlMainDomLock
- better management of db instances and transactions
- changes to polling, though this doesn't seem to be causing issues it can be investigated to be more optimized
- better detection of various types of SQL server errors (there are tons) to respond differently depending on the type of error and the state of the application
- Investigation into scheduled publishing lock request timeouts (also reported here https://github.com/umbraco/Umbraco-CMS/issues/8392) which occurs around the same time as when SqlMainDomLock fails
- Don't short circuit index rebuilding if one of the populators throws an exception, continue with the other populators
Will report back with any updates.
Shazwazza
on 8 Jul 2020
Some of these transient error's are not retried https://docs.microsoft.com/en-us/azure/azure-sql/database/troubleshoot-common-errors-issues#transient-fault-error-messages-40197-40613-and-others
nzdev
on 8 Jul 2020
@Shazwazza , thanks for the update very interesting read (although some if it's a bit over my head). As an fyi, the site was upgrade from 8.6.0 to 8.6.3 and forms was updated to 8.4.1 at the same time so that should already have been addressed in the latter end of the logs.
NikRimington
on 8 Jul 2020
I am closing this issue based on the work done in PR https://github.com/umbraco/Umbraco-CMS/pull/8398 which has plenty of notes and fixes. SqlMainDomLock will no longer shut down the MainDom if an SQL error occurs.
Shazwazza
on 9 Jul 2020
@NikRimington @rbottema @nzdev The 8.6.4 build we intend to release is now available from the Artifacts on this build (where it says 3 published): https://dev.azure.com/umbraco/Umbraco%20Cms/_build/results?buildId=43999&view=results
We need to await test results from real-life usage to actually test this on your environments to make sure we have now eliminated the problems even in setups that might have different configurations on what we've tested it on. This needs to happen before we can release this build, so the sooner that happens, the sooner we can release! 😄
Please give it a spin and let us know how it goes!
nul800sebastiaan
on 9 Jul 2020
@nul800sebastiaan what's the best way to install it? Is there a pre-release nuget by any chance? Or does it need to be a manual install?
NikRimington
on 9 Jul 2020
If you need a NuGet I would recommend you get a free trial on MyGet and upload it there, you'll need to add it to your sources by dropping a NuGet.config in the root of your project that looks a bit like this:
<?xml version="1.0" encoding="utf-8"?>
<configuration>
  <packageSources>
    <add key="MyGet" value="https://www.myget.org/F/myusername/api/v3/index.json" />
  </packageSources>
</configuration>
That should get your build server to pick it up and deploy it.
The other option is to drop in the dlls on your target environment 🙈 there's no JS/HTML/CSS changes in this release, just the dlls.
nul800sebastiaan
on 9 Jul 2020
@nul800sebastiaan No need to use MyGet, as you can use the Azure DevOps Artifacts feed of the build (https://dev.azure.com/umbraco/Umbraco%20Cms/_packaging?_a=connect&feed=UmbracoCms%40Local) or download them and use local directories (https://docs.microsoft.com/en-us/nuget/hosting-packages/local-feeds).
ronaldbarendse
on 9 Jul 2020
Ahh, if it's just DLL changes I can just drop them in, wasn't sure if there were JS changes for anything else pending on the 8.6.4 release :-)
NikRimington
on 9 Jul 2020
@ronaldbarendse Oh! I didn't think we had that enabled since it's usually a paid option.. not sure if it works, not tried yet..
@NikRimington Yes, just dlls, note that you will be faced with the upgrade screen for a minute!
nul800sebastiaan
on 9 Jul 2020
@Shazwazza , @nul800sebastiaan just as an update, I installed 8.6.4 onto the site that has been having the problem the most on Friday at 10am and it appears to have been stable since. I'm continuing to monitor so will feed back again in a couple of days time, but it's looking positive.
Nik
NikRimington
on 13 Jul 2020
Hey @Shazwazza, the site has continued to be stable as far as I'm aware. No restarts that I can see, and more importantly, no losing access to the indexes! I'm happy to work on the assumption that this has fixed the issue!
Thanks for all your help with it, keep up the great work! #h5yr
NikRimington
on 14 Jul 2020
Just to make sure you are not waiting for my feedback: we are not currently running the custom 8.6.4 build, as the issue seemed to be mostly one-off for that client.
rbottema
on 15 Jul 2020
@nul800sebastiaan is there anything we can do to expedite the release of 8.6.4? We'd like to roll out these fixes and prefer to use official sources - thanks!
johnsonp57
on 20 Jul 2020
@johnsonp57 Yes, we can expedite the release as soon as we have a few more results from testing. So please use the build from the official source that I linked to make sure that the fix applies to your specific case as well.
@NikRimington How has it been going since then, still all good?
nul800sebastiaan
on 20 Jul 2020
@nul800sebastiaan yeah it's all be stable since applying the 8.6.4 patch.
I'll talk with @johnsonp57 about getting it on another site to test as we work together. 👍
NikRimington
on 20 Jul 2020
@nul800sebastiaan , we are now running this on 4 sites (5 as of later today) to address the issue and all the sites are stable with no fresh bugs being reported after applying the 8.6.4 dlls.
It would be great if we could get the official release out soon :-)
NikRimington
on 30 Jul 2020
Unfortunately we have started getting similar symptoms re-occur on 3 of the sites which have the pre-release 8.6.4 dll's applied. It is not happening with such regularity, but is still an issue. Here are 2 stack traces from sites that we had to restart yesterday and today. Examine shuts down immediately after and MainDom is released.


Let us know if we can provide any further info to help diagnose this
Thanks
johnsonp57
on 7 Aug 2020
Hi thanks for the info but those are very different errors to the ones caused and fixed here. An sql lock timeout isn't the same as an sql timeout which you are seeing. Also the fix in 8.6.4 even if you got an sql timeout will still not cause maindom to stop which you would have seen of that was the case.
Shazwazza
on 7 Aug 2020
Thanks for looking. The errors are different, but the symptom is the same - Examine shuts down and MainDom is released hence it felt relevant to this issue. I can create it as a separate issue?
johnsonp57
on 7 Aug 2020
Hi yes sorry I misread the description and didn't see that maindom stops. That is particularly strange based on how that code works and those stack traces. It will take some investigation to see if those correlate. Any info on reproduction steps would help but I think it's best to open a separate issue since its a different case.
Shazwazza
on 7 Aug 2020
@Shazwazza we've updated to v8.6.4 and have the appropriate settings for MainDom, LocalTempStorage and LuceneDirectoryFactory but we're still experiencing Lucene.Net.Store.AlreadyClosedException exceptions. Which is causing errors to pop up consistently for content editors.
We don't have any load balancing at all besides what you would get with and Azure Web App maintenance.
Not sure what else we need to be trying here?
 luke-barnett
on 21 Sep 2020
luke-barnett
on 21 Sep 2020
@luke-barnett do you have steps to replicate from a vanilla Umbraco installation? If so please open a new issue with those steps, stack traces, details, etc...
Shazwazza
on 21 Sep 2020
@Shazwazza not from a vanilla install we're a vendor so it's a little more tricky to just sink time into an investigation so looking for any shortcuts that I could kick off with.
8006 is also pretty similar to what we're seeing, except that we do have custom indexes being created in code (and I couldn't immediately follow the trail of the how the Umbraco.Examine.LuceneDirectoryFactory setting would be respected in their creation).
Apologies if it's obvious, but is their any detail to consume around the difference between TempEnvDirectoryFactory and SyncTempEnvDirectoryFactory? I've seen it as something to try.
I'll dive a little deeper into the logs we've got but if there are any clear things that I should be looking for that would be greatly appreciated.
luke-barnett
on 21 Sep 2020
@luke-barnett some replies inline:
we do have custom indexes being created in code
If you remove all of your custom indexing code does the problem go away?
not from a vanilla install we're a vendor so it's a little more tricky to just sink time into an investigation so looking for any shortcuts that I could kick off with.
This is how I will need to figure out the problem so without steps to replicate it makes a bit difficult.
Apologies if it's obvious, but is their any detail to consume around the difference between TempEnvDirectoryFactory and SyncTempEnvDirectoryFactory? I've seen it as something to try.
See https://our.umbraco.com/Documentation/Getting-Started/Setup/Server-Setup/Load-Balancing/azure-web-apps#luceneexamine-configuration
If you are load balancing or scaling (scaling is load balancing but that needs to be taken care of separately as well, you can't just turn on scaling in your azure web app) you need to follow all of the configuration docs on doing that correctly.
Shazwazza
on 22 Sep 2020
You can add this to your serilog.config file for more information about MainDom logging:
<add key="serilog:minimum-level:override:Umbraco.Core.Runtime.MainDom" value="Debug" />
<add key="serilog:minimum-level:override:Umbraco.Core.Runtime.SqlMainDomLock" value="Debug" />
MainDom is what controls Examine and shuts it down. The only way that Examine's cancelation tokens have been canceled is by MainDom or some manual code disposing IExamineManager.
Shazwazza
on 22 Sep 2020
Related issues
 jesperordrup
·
3Comments
jesperordrup
·
3Comments
 nielslyngsoe
·
3Comments
nielslyngsoe
·
3Comments
 0Neji
·
3Comments
0Neji
·
3Comments
 Frost117
·
4Comments
Frost117
·
4Comments
 janvanhelvoort
·
4Comments
janvanhelvoort
·
4Comments
Most helpful comment
@Shazwazza , @nul800sebastiaan just as an update, I installed 8.6.4 onto the site that has been having the problem the most on Friday at 10am and it appears to have been stable since. I'm continuing to monitor so will feed back again in a couple of days time, but it's looking positive.
Nik