Umap: Are euclidian distances interpretable in the embedding?
Hi,
I have a couple of questions regarding the interpretability of the results obtained with UMAP. I apologize if the questions are too trivial and should be posted elsewhere.
Third, UMAP often performs better at preserving aspects of global structure of the data than t-SNE. This means that it can often provide a better "big picture" view of your data as well as preserving local neighbor relations.
I was wondering whether euclidian distances in the embedding are interpretable. Taking the MNIST example:
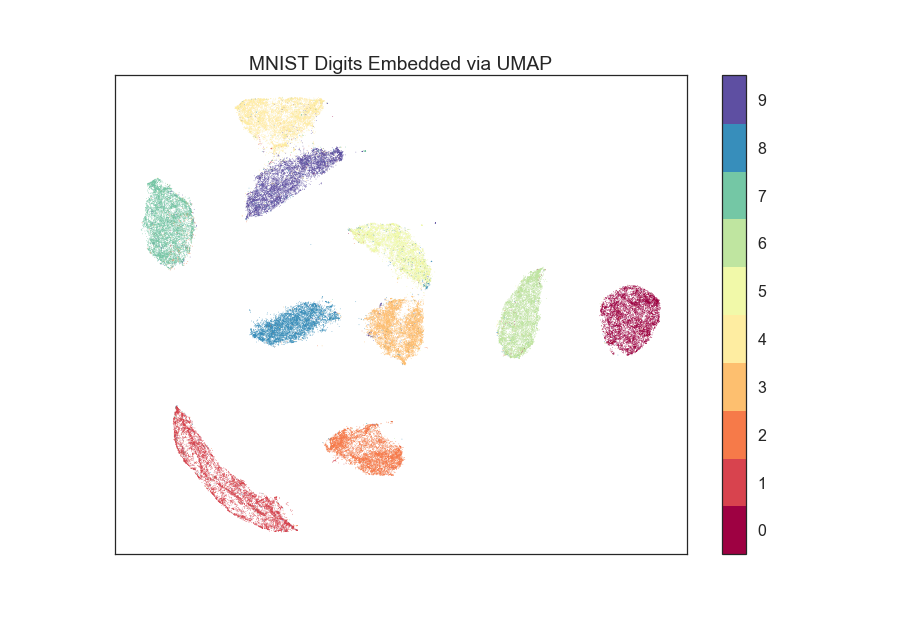
Does it make sense to say that the digit "3" is as distant to "0" as it is from "1"?
Or that because the area of the cluster of "1"s is larger than the area of the cluster of "8"s, that there is more variability in "1"s than there is in "8"s?
Is there any way of interpreting of the axes mean, i.e., if we were to take a random point in the 2D space, could we apply an inverse transformation to figure out what the N-D object would've looked like?
Thank you for your awesome project!
 dangom
All 16 comments
There is no interpretability to the axes unfortunately -- any rotation
would be an equally valid/correct embedding.
As for interpreting distances -- I think the kind of inferences you are
drawing are valid, but I would be wary of trying to draw very distance
specific information beyond general big picture type statements such as you
made.
On Wed, Jul 25, 2018 at 7:02 AM Daniel Gomez notifications@github.com
wrote:
Hi,
I have a couple of questions regarding the interpretability of the results
obtained with UMAP. I apologize if the questions are too trivial and should
be posted elsewhere.Third, UMAP often performs better at preserving aspects of global
structure of the data than t-SNE. This means that it can often provide a
better "big picture" view of your data as well as preserving local neighbor
relations.I was wondering whether euclidian distances in the embedding are
interpretable. Taking the MNIST example:[image: MNIST example]
https://raw.githubusercontent.com/lmcinnes/umap/master/images/umap_example_mnist1.pngDoes it make sense to say that the digit "3" is as distant to "0" as it is
from "1"?
Or that because the area of the cluster of "1"s is larger than the area of
the cluster of "8"s, that there is more variability in "1"s than there is
in "8"s?Is there any way of interpreting of the axes mean?
Thank you for your awesome project!
—
You are receiving this because you are subscribed to this thread.
Reply to this email directly, view it on GitHub
https://github.com/lmcinnes/umap/issues/92, or mute the thread
https://github.com/notifications/unsubscribe-auth/ALaKBZVZg4A5JsP0hfmIO-mhDqPUqv9dks5uKFBXgaJpZM4Vf4UP
.
 lmcinnes
on 26 Jul 2018
lmcinnes
on 26 Jul 2018
Please forgive me if I'm just recapitulating what @dangom has already asked.
I'm also curious if I'm able to use the distances from the cluster centroids to determine, for instance, potential outlier scores.
E.g. If a set of neighbors has a small Euclidean distance from each other but are very distant from the rest of the data points, are these interpretable as outliers?
On the contrary, if I have a cluster of points, A, near another cluster of points, B, with A and B more distant to a cluster C than to each other, can these distances be interpreted directly as A being more similar to B but both of them being less similar to C than to each other?
Thank you! I'm really excited about using this algorithm in my work.
 cjnolet
on 13 Aug 2018
cjnolet
on 13 Aug 2018
If you find a group that is well separated from the other points then that
is a general "big picture" feature that yes, you can have some confidence
is calling an outlier group. If you were to specifically measure distances
from the main mass to two outlier groups that were approximately the same
distances from the main mass and infer which one is more outlying ... that
would be taking things too far. Does that make sense?
On Mon, Aug 13, 2018 at 4:36 PM Corey J. Nolet notifications@github.com
wrote:
Please forgive me if I'm just recapitulating what @dangom
https://github.com/dangom has already asked.I'm also curious if I'm able to use the distances from the cluster
centroids to determine, for instance, potential outlier scores.E.g. If a set of neighbors has a small Euclidean distance from each other
but are very distant from the rest of the data points, are these
interpretable as outliers?On the contrary, if I have a cluster of points, A, near another cluster of
points, B, with A and B more distant to a cluster C than to each other, can
these distances be interpreted directly as A being more similar to B but
both of them being less similar to C than to each other?Thank you! I'm really excited about using this algorithm in my work.
—
You are receiving this because you commented.
Reply to this email directly, view it on GitHub
https://github.com/lmcinnes/umap/issues/92#issuecomment-412655040, or mute
the thread
https://github.com/notifications/unsubscribe-auth/ALaKBSAkgnP0oYDzhUpsOAsEYg8VU3DFks5uQeM6gaJpZM4Vf4UP
.
lmcinnes
on 14 Aug 2018
I have the same question, but wanted to get specific. Here are some plots generated from variants of my data using UMAP with various parameters


I understand that nothing can be interpreted between the plots.
But, for a given plot, can I conclude that clusters that are closer together are more "similar" than those that are far away?
 birdsarah
on 24 Sep 2018
birdsarah
on 24 Sep 2018
Yes, clusters that are closer together are* more similar than those that are far apart. I put an asterisk there because (as with many things) there some caveats there. UMAP will try to lay things out well, but there may be, for example, relationships among clusters that can't be represented in 2-dimensions. That is to say, there are certainly pathological cases where this wouldn't necessarily be true. I also wouldn't put much stock in the exact distances -- if you are judging by eye that, say, in the top left plot the small cluster on the left is more similar to the large central cluster than the tiny cluster on the extreme left is to the central cluster, I think that's accurate. If you have to count grid squares carefully to make your judgement ... I would be wary. Taking the top left example again; there are two small clusters on either side of the central cluster -- I don't think you can say one or the other is truly "more similar" to the central cluster with much confidence.
lmcinnes
on 24 Sep 2018
This makes sense, thanks. I was definitely thinking in the general imprecise case - for example the value of using a lasso tool for exploration, rather than extracting precision or meaning. Thanks again for this tool.
birdsarah
on 26 Sep 2018
Am I correct in understanding that the degree to which Euclidean distances between embedded points can be quantitatively used depends on the number of reduced dimensions?
For example, consider the case where the number of dimensions in the embedding is equal to the number of dimensions in the input space. Here, the embedding can be exact (not approximate), and the utility of UMAP in this case is the transformation from a locally-varying Riemannian metric to a non-varying (Euclidean) metric.
In this case, Euclidean distance is fairly meaningful quantitatively, correct? Of course, the output still depends on several of the selected hyperparameters (e.g. metric, n_neighbors, min_dist).
 aprive
on 14 Dec 2018
aprive
on 14 Dec 2018
Hey,
UMAP works great for me so far. I using slight variations on the same dataset and reducing their dimensionality with UMAP, obtaining very similar looking scatterplots. Now in order to compare them, I am using Procrustes Analysis (basically turning and scaling my UMAP embeddings linearly) and checking the summed pointwise distances. It gives me good qualitative feedback on how similar the embeddings are. Do you think that is a valid approach?
Specifically, I was wondering, what the scale of the scatterplot represents.
Thanks in advance!
 ConstantinWdP
on 4 Jun 2019
ConstantinWdP
on 4 Jun 2019
I think that's a valid approach. There are, ideally, better things one could do, but the complication of such things may not be worth your trouble.
The scale is somewhat arbitrary and simply induced by the optimziation approach. For procrustes alignment purposes you should ideally be scaling everything to be on a reasonable fixed scale, so relative measures should be fine.
lmcinnes
on 4 Jun 2019
Marked as Good Reads so it does not get lost. Reopen if further discussion is required.
 sleighsoft
on 16 Sep 2019
sleighsoft
on 16 Sep 2019
Hi. I would like to reignite this thread to clarify some ideas leading me so misinterpret UMAPs (this is a follow up to the thread https://github.com/satijalab/seurat/issues/2075).
I compared my RNA single cell analysis UMAP plot with a tree cluster plot, using Seurat in both cases. The differences seems apparent between the two.


Looking at these, it's possible to raise some concerns:
(1) - Why is B the closest to A in the clustering tree, while in the UMAP it is suggested that is a very different cluster comparing to any other ones?
(2) - I know for a fact that cluster K is very different from others, as I included a negative control in this study. This is shown in the cluster tree as it represents K as an outlier. So, why was K, on the UMAP, not represent that far apart from every other cluster?
These are just some example questions. Biologically I have to say that the cluster tree makes a bit more sense, however I see a great potential in using UMAP as well.
Thank you in advance!
 PedroRaposo
on 21 Nov 2019
PedroRaposo
on 21 Nov 2019
I think distance between clusters in UMAP does not really encapsulate meaning. It rather tries to separate "clusters" that it does not think belong together while trying to generate a visually pleasing representation. This is also why you have a paramter like min_dist https://umap-learn.readthedocs.io/en/latest/parameters.html#min-dist
Techniques such as t-SNE which also use stochastic gradient descent and some form of layouting suffer from a similar problem see here
sleighsoft
on 22 Nov 2019
Thank you for the answer. Isn't that contradictory from these answers that @lmcinnes gave?
Yes, clusters that are closer together are* more similar than those that are far apart.
and
If you find a group that is well separated from the other points then that
is a general "big picture" feature that yes, you can have some confidence
is calling an outlier group.
Isn't UMAP supposed to have the advantage of preserving a global structure?
PedroRaposo
on 22 Nov 2019
How you preserve global structure vs local structure depends on your choice of n_neighbors. And yes, clusters that are closer together are more similiar, but relative to your choice of min_dist. It might also be that 2 dimensions are not enough to properly separate your data.
E.g. consinder a map of our planet. In 3-d it is a sphere where the US/Canada are close to Russia, but in a 2-D plane they are further apart.
Sorry I cannot help you further. Maybe @lmcinnes has some more thoughts on this.
sleighsoft
on 23 Nov 2019
I can probably take a swing at this one. One of those caveats, that Leland
mentioned earlier, on global structure is that if you have completely
disconnected regions of you manifold (i.e. disconnected components in your
nearest neighbour graph that we are using to approximate said manifold)
then you are dependent on the initialization of UMAP for preserving some of
your global structure (with init='spectral'). As Julian just indicated,
that is the first thing to go when the algorithm is trying to fit the
points down in two dimensions. As Julian also points out your choice of
n_neighbours has huge effect on this. If you make it too small for your
data it disconnects the different components in your graph and forces you
to depend on the global initialization structure.
Looking at your plot I'd have been hesitant to say that B is close to
anything and I'd guess that it was disconnected in the manifold. My guess
is that it got laid down close to A but was completely disconnected and
thus pushed both A and all clusters away from itself during the
optimization. A quick way to check that might be to load up the 0.4dev
version of UMAP and have a look at the graph structure being induced in
your nearest neighbour graph via (
https://umap-learn.readthedocs.io/en/0.4dev/plotting.html):
umap.plot.connectivity
I'd suggest that the same is roughly true for your cluster K. It is
disconnected in the manifold (as it sounds like it should be) it got laid
down far from other clusters and stayed well separated. It was far from
everything so got pushed to the periphery. If you want a bit more insight
into the global structure that is being preserved in your data it might be
worth looking at the two dimensional spectral embedding of your data.
When interpreting the global cluster structure of totally disconnected
components I'd always go back and see if I could validate the relationships
among the clusters after the fact. Use the UMAP plot for insight into your
data and a means of generating questions that you can ask of your data.
Now that was general advice on interpreting UMAP embeddings. For something
more specific, I'm going to have to ask how you built your cluster tree?
Was it the same distance measure as you used in your UMAP embedding (I
presume so)? What cluster agglomeration technique did you use? Your choice
of single linkage, Ward, or complete linkage for example can have a huge
impact on the structures revealed by your dendrogram.
On Sat, Nov 23, 2019 at 5:20 AM Julian Niedermeier notifications@github.com
wrote:
How you preserve global structure vs local structure depends on your
choice of n_neighbors. And yes, clusters that are closer together are
more similiar, but relative to your choice of min_dist. It might also be
that 2 dimensions are not enough to properly separate your data.E.g. consinder a map of our planet. In 3-d it is a sphere where the
US/Canada are close to Russia, but in a 2-D plane they are further apart.Sorry I cannot help you further. Maybe @lmcinnes
https://github.com/lmcinnes has some more thoughts on this.—
You are receiving this because you are subscribed to this thread.
Reply to this email directly, view it on GitHub
https://github.com/lmcinnes/umap/issues/92?email_source=notifications&email_token=AC3IUWUQPNXG4UYUHBUVT5LQVD7WRA5CNFSM4FL7QUH2YY3PNVWWK3TUL52HS4DFVREXG43VMVBW63LNMVXHJKTDN5WW2ZLOORPWSZGOEE7SC7I#issuecomment-557785469,
or unsubscribe
https://github.com/notifications/unsubscribe-auth/AC3IUWVCGM2ALVE4PF2ADPLQVD7WRANCNFSM4FL7QUHQ
.
 jc-healy
on 24 Nov 2019
jc-healy
on 24 Nov 2019
@jc-healy Thank you for the amazing answer. I am definitely looking deeper into UMAP data.
Regarding the dendogram, I just constructed it through Seurat's ClusterTree, using the default parameters, however I'm going to find more info about it.
Thank you, this gave me a base line for what I need to study.
PedroRaposo
on 3 Dec 2019
Related issues
 ensonario
·
7Comments
ensonario
·
7Comments
 iicky
·
5Comments
iicky
·
5Comments
 JoOkuma
·
4Comments
JoOkuma
·
4Comments
 hmswaffles
·
6Comments
hmswaffles
·
6Comments
 andrewluetgers
·
3Comments
andrewluetgers
·
3Comments
Most helpful comment
I can probably take a swing at this one. One of those caveats, that Leland
mentioned earlier, on global structure is that if you have completely
disconnected regions of you manifold (i.e. disconnected components in your
nearest neighbour graph that we are using to approximate said manifold)
then you are dependent on the initialization of UMAP for preserving some of
your global structure (with init='spectral'). As Julian just indicated,
that is the first thing to go when the algorithm is trying to fit the
points down in two dimensions. As Julian also points out your choice of
n_neighbours has huge effect on this. If you make it too small for your
data it disconnects the different components in your graph and forces you
to depend on the global initialization structure.
Looking at your plot I'd have been hesitant to say that B is close to
anything and I'd guess that it was disconnected in the manifold. My guess
is that it got laid down close to A but was completely disconnected and
thus pushed both A and all clusters away from itself during the
optimization. A quick way to check that might be to load up the 0.4dev
version of UMAP and have a look at the graph structure being induced in
your nearest neighbour graph via (
https://umap-learn.readthedocs.io/en/0.4dev/plotting.html):
umap.plot.connectivity
I'd suggest that the same is roughly true for your cluster K. It is
disconnected in the manifold (as it sounds like it should be) it got laid
down far from other clusters and stayed well separated. It was far from
everything so got pushed to the periphery. If you want a bit more insight
into the global structure that is being preserved in your data it might be
worth looking at the two dimensional spectral embedding of your data.
When interpreting the global cluster structure of totally disconnected
components I'd always go back and see if I could validate the relationships
among the clusters after the fact. Use the UMAP plot for insight into your
data and a means of generating questions that you can ask of your data.
Now that was general advice on interpreting UMAP embeddings. For something
more specific, I'm going to have to ask how you built your cluster tree?
Was it the same distance measure as you used in your UMAP embedding (I
presume so)? What cluster agglomeration technique did you use? Your choice
of single linkage, Ward, or complete linkage for example can have a huge
impact on the structures revealed by your dendrogram.
On Sat, Nov 23, 2019 at 5:20 AM Julian Niedermeier notifications@github.com
wrote: