Tskit: f2, f3 and f4 stat definitions -- some ambiguity?
In my lab we are currently doing some checks that when we convert our tree sequences into genotype matrices and run them through ADMIXTOOLS or similar, we get the same values for f* statistics as we do when we calculate them directly on the tree sequence using the your new methods.
I got the following question from one of my colleagues:
Can you confirm whether these statistics are calculated on population allele frequencies, or averages of randomly chosen individuals from each population?
My first instinct was the former, and this definition in @petrelharp and @jeromekelleher 's latest preprint suggests that too:
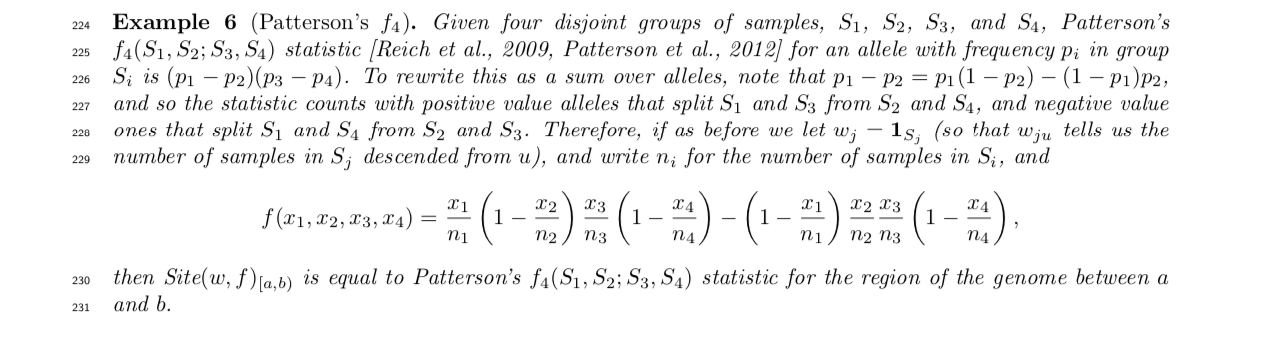
However, in API documentation for f2,f3 and f4 stats, this statement seems to suggest the other definition:
Each is an average across randomly chosen set of four samples (a, b; c, d), one from each sample set:
It would be great if you could help us clarify this. Btw, I've also checked that when I rerun the f* stat calculations on the tree sequence, I get the same output, so if there is some randomness in the calculation it doesn't seem like the user can control it. This would be useful for the user to know, I think.
Also, btw, when you were coding these definitions up, did you also double check your f* site statistics against those produced with scikit-allel or some other package? It may be useful for us to use the same package for our own statistic calculations, if so.
cc @mslick95
 gtsambos
All 31 comments
Hello! Good question; this is a confusing aspect of these stats. There's a few things here, I'll talk through them and hopefully answer your question?
I assume that your colleague meant "sample allele frequencies" by "population allele frequencies", since what is computed definately depends only on the genotypes of the samples.
The definitions given in terms of sample allele frequencies are equivalent to those given in terms of an expectation over random draws. This is analogous to the equivalence for genetic diversity between "average of 2 p (1-p)" and "pick two individuals and a random locus; what's the chance they are different". I find it easier to think about the "average over random choices of individuals" definition (it feels more concrete than a polynomial in allele frequencies), but we compute the statistic using the polynomials of sample allele frequencies.
For f2 and f3 there is the issue of sampling without replacement. The definition of, say, f2(A,B), is the "average density of sites at which two samples from A agree, and differ from two samples from B, which also agree". Those are samples without replacement; and it means that the polynomial of allele frequencies that defines the f2 looks a lot like the one you've got from the paper about f4, but has some "corrections" that account for the "sampling without replacement" bit. (In other words, if the definition was the same, but the average was over samples with replacement, then they'd all use the same polynomial.
Currently, the help for f4 says:
    What is computed depends on ``mode``. Each is an average across
    randomly chosen set of four samples ``(a, b; c, d)``, one from each sample set:
... so to make this more clear we could append, e.g.:
    What is computed depends on ``mode``. Each is an average across
    randomly chosen set of four samples ``(a, b; c, d)``, one from each sample set
    (but note that what is computed is the theoretical average, and does not depend
    on taking random choices):
Other suggestions?
 petrelharp
on 4 Nov 2019
petrelharp
on 4 Nov 2019
Hi @petrelharp, sorry for the very late reply with this -- there's been a lot to think about and respond to, so I've put it off for a while.
I've had a look at your f stat summary functions in C over here and I think there might be some issues with them that also relate to the definitions in your preprint -- I'm going to email you, @jeromekelleher and @molpopgen separately about this as it's a bit much for this thread.
Also, btw, when you were coding these definitions up, did you also double check your f* site statistics against those produced with scikit-allel or some other package?
So I've simulated some tree sequence data, calculated some f statistics with tskit, then converted the data to vcf and passed it to @mslick95 in my lab, who calculated the corresponding versions of these statistics using ADMIXTOOLS from the Reich lab. We get some odd results that aren't just due to factor/normalisation differences. Here are the results from our f3 stat comparison:
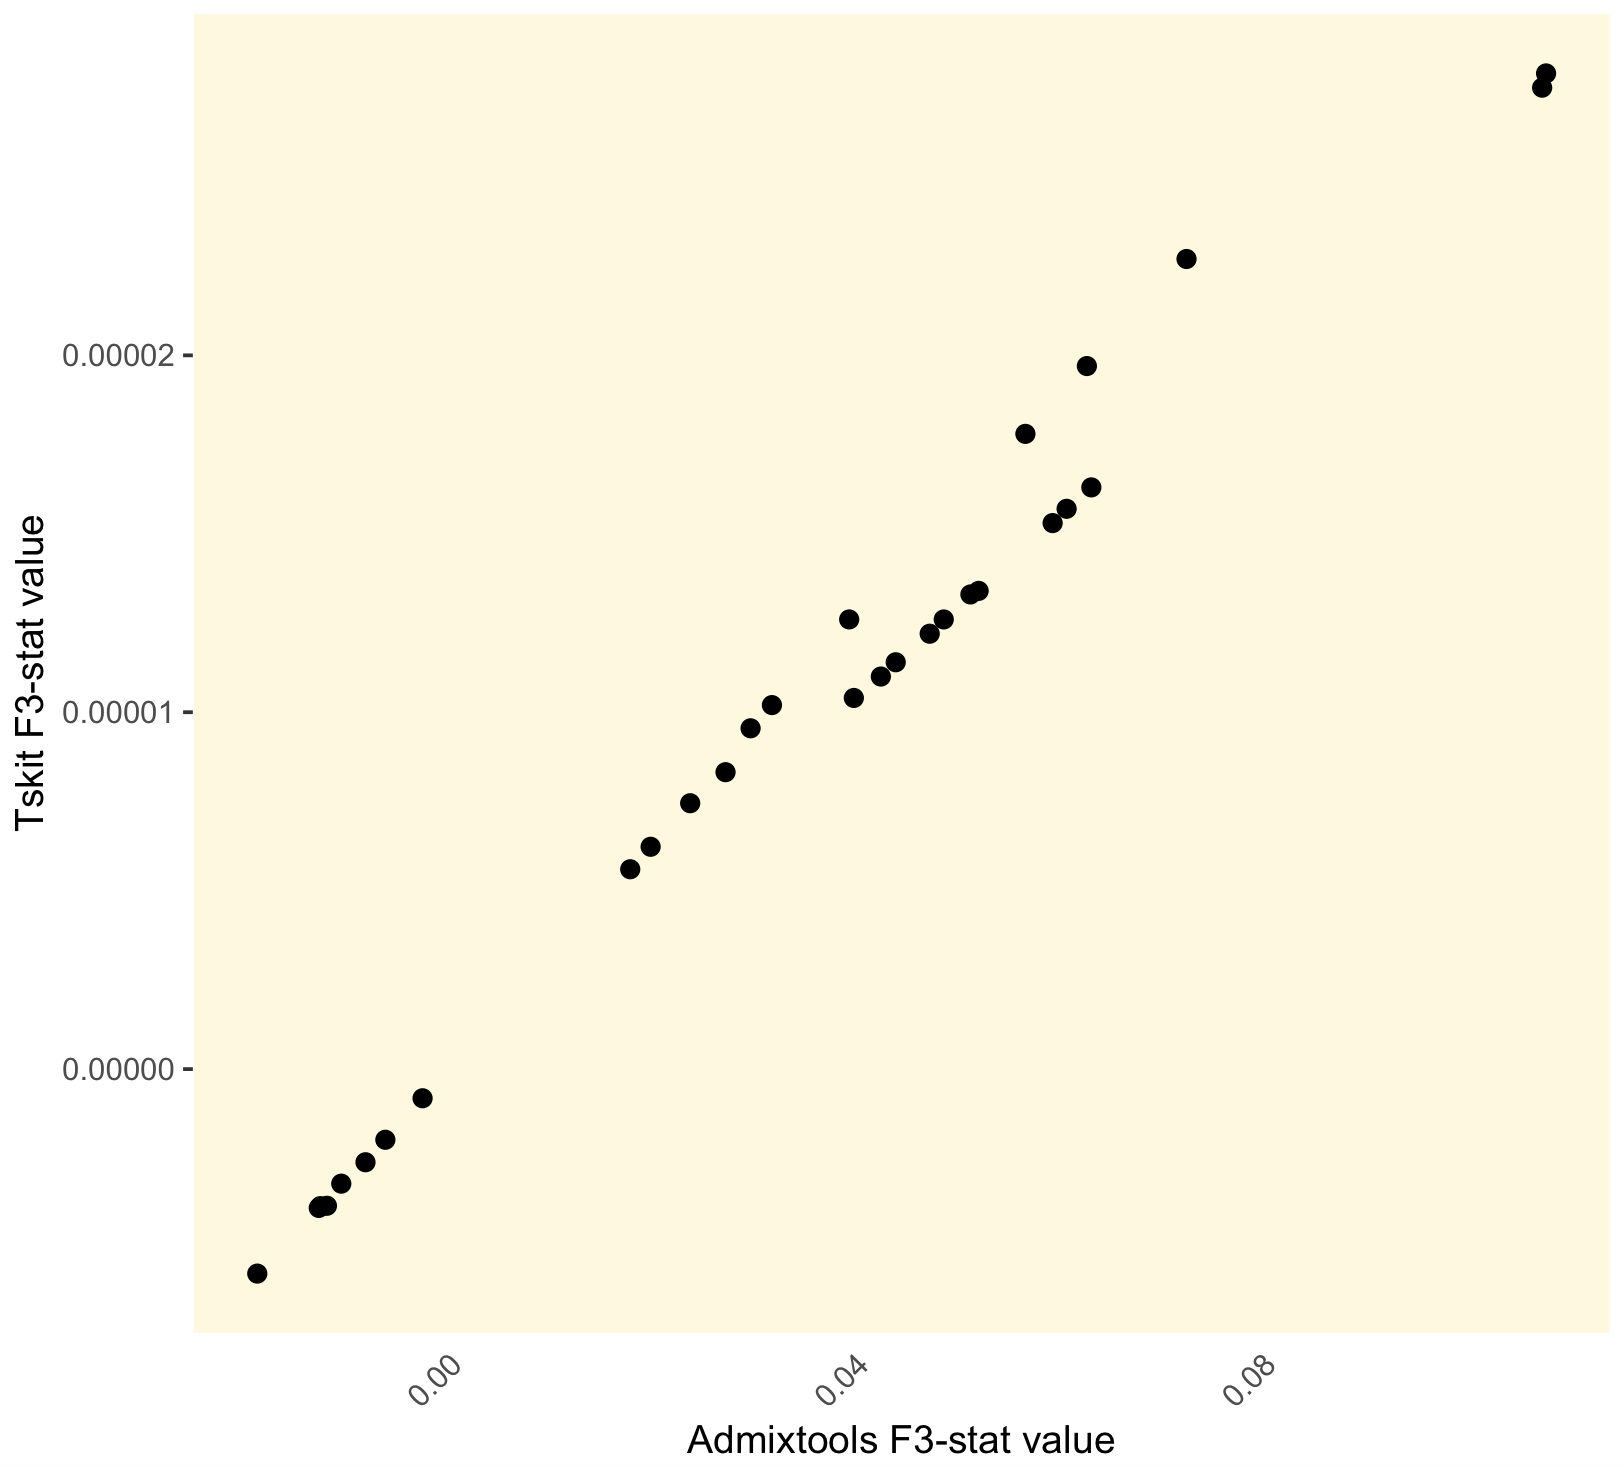
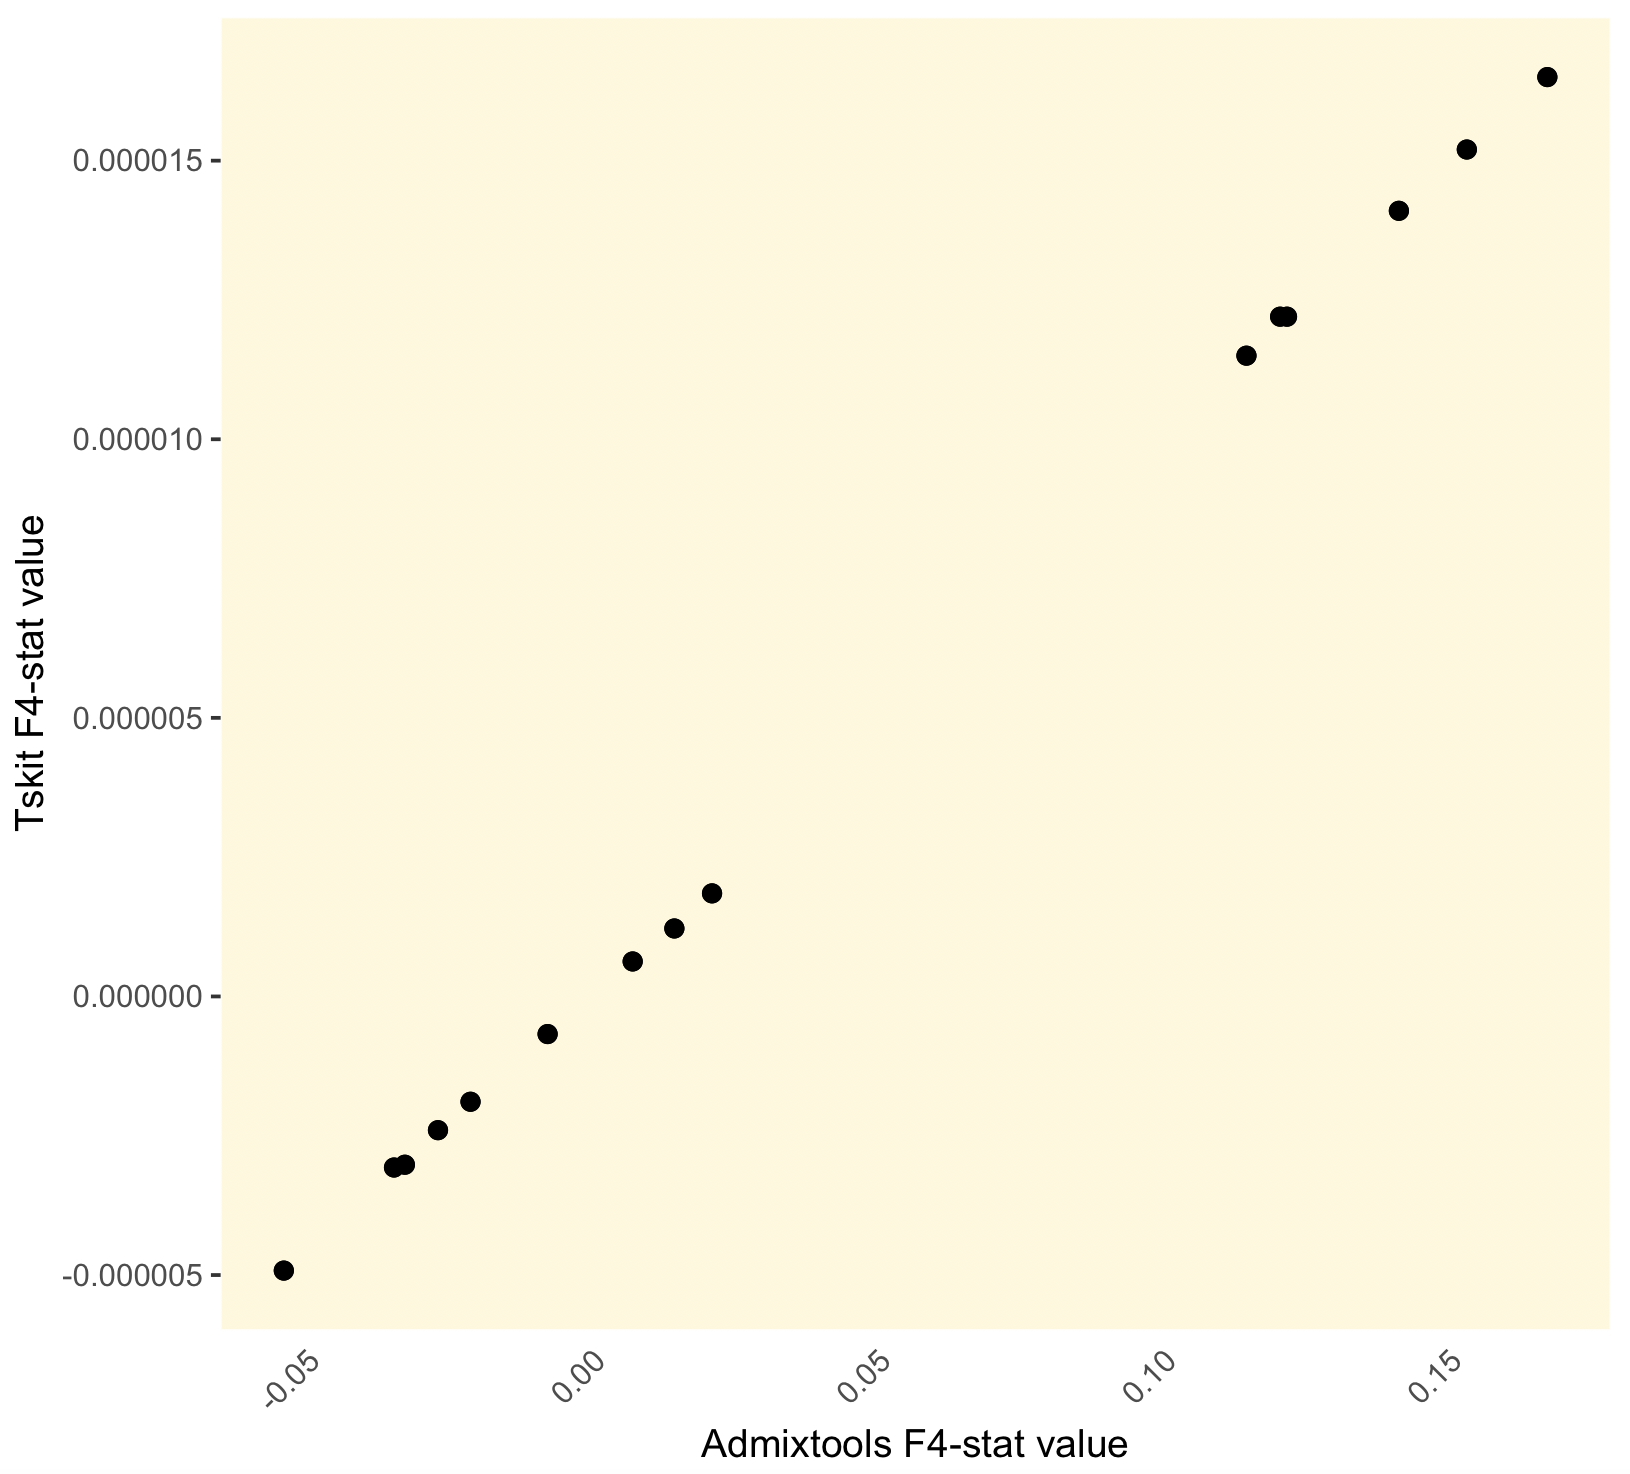
Our f4 stat results are off by a factor of around 10 000, which could be partly but not entirely explained by the span_normalise correction that was applied in tskit (this is a 1Mb region).
Other suggestions?
If possible, something as close to the actual mathematical definition as possible would be best -- at present, you have to dig into the C code to see what you are calculating here (as only f4 is defined in your preprint so far). I think it would be better to explicitly use the word "expectation" to emphasise that this is a theoretical average. Something like "the expectation of (p1 - p2)(p3 - p4), where pi is the frequency of the allele in the *ith population"
gtsambos
on 26 Nov 2019
I've had a look at your f stat summary functions in C over here and I think there might be some issues with them that also relate to the definitions in your preprint -- I'm going to email you, @jeromekelleher and @molpopgen separately about this as it's a bit much for this thread.
btw, not sure I'll have time to write this today, but the sparknotes version is that the version of f4 you've coded here, and defined in your preprint, looks like it's calculating the expectation of p1*(1 - p2)*(p3 - p4), rather than (p1 - p2)*(p3 - p4)
gtsambos
on 26 Nov 2019
For f2 and f3 there is the issue of sampling without replacement. The definition of, say, f2(A,B), is the "average density of sites at which two samples from A agree, and differ from two samples from B, which also agree". Those are samples without replacement; and it means that the polynomial of allele frequencies that defines the f2 looks a lot like the one you've got from the paper about f4, but has some "corrections" that account for the "sampling without replacement" bit.
Perhaps I've just been thinking about this so long that I've started going loopy, but I'm no longer sure about this either. I understand that the theoretical definition of these statistics involves taking 2 (different) individuals from the population, but the samples in our tree sequences will always just be a subset of this population. So, those two individuals could be 'tagged' by the same sample that we have in our tree sequence.
I've had a quick look at the derivations in the Ben Peter paper on f-stats and though I've only skimmed the derivations, I also can't see anywhere where he is doing tricky stuff to account for non-replacement (like the factors of n - x - 1 that you have in here for example).
gtsambos
on 26 Nov 2019
Just one more quick comment before I go home -- that ADMIXTOOLS package is very widely used for calculating f stats based on allelic data, and users are going to expect that the results will align. This is important in applications where, for example, you are using tskit to calculate statistics on your simulated data, and ADMIXTOOLS to calculate statistics for your real data (for which no tree sequence is available). I think it's particularly important that there is some way to configure the tskit calculations so that the output is the same for both softwares.
gtsambos
on 26 Nov 2019
The way I would calculate these is a bit simpler (I think). Say you want to calculate F3: this is the expectation of (p1 - p2)(p1 - p3). You can expand this out and write it in terms of E(p1), E(p2), E{p3) and E(p1^2), which is Var(p1) + E(p1)^2. Since all of the p's have a binomial distribution this isn't too hard to do. Then you sub in p = x/n.
Does that make sense??
gtsambos
on 26 Nov 2019
Thanks for this @gtsambos! The details are over my head here, but I definitely agree that we should either compute the same thing as ADMIXTOOLS or document clearly why what we're doing is different (and ideally give options to compute the same thing).
 jeromekelleher
on 26 Nov 2019
jeromekelleher
on 26 Nov 2019
Yes, thanks for the close look, @gtsambos. Let's see. There's two issues - one is whether we agree with ADMIXTOOLS; and the other is who is correct. For the first thing, would it be easy for you to produce a very small (e.g., one site, six individuals) example that has a difference between tskit and ADMIXTOOLS? If there is a difference having to do with sampling without replacement, it should be largest with small samples.
As for how to compute these statistics: I welcome suggestions for simpler or better ways to calculate them! I did think about them for quite awhile, and don't know of a better way. I think the reason that the definitions don't look quite as you expect is that recall that we calculate everything (by default; unless polarised=False) summed over alleles. In terms of allele frequencies, we'd want a summary function f( ) such that f(p) + f(1-p) gives the right thing. Thus the f4 summary function here, which is computing f(p) = p1 p3 (1-p2) (1-p4) - p1 p4 (1-p2) (1-p3); because then
  f(p) + f(1-p) = (p1 p3 (1-p2) (1-p4) - p1 p4 (1-p2) (1-p3)
                         + (1-p1) (1-p3) p2 p4 - (1-p1) (1-p4) p2 p3)
                     = (p1 (1-p2)  {p3 (1-p4) - p4 (1-p3)}
                         + (1-p1) p2 { (1-p3) p4 - (1-p4) p3 })
                     = (p1 (1-p2)  {p3 - p4}
                         + (1-p1) p2 { p4 - p3 })
                     = (p1 - p2)  (p3 - p4)
as expected.
petrelharp
on 27 Nov 2019
Let's see - here's a definition of F2 incorporating sample size corrections
(note that you have to find the statistic F2, not the parameter, i.e., an estimator of the thing defined in terms of population frequencies):
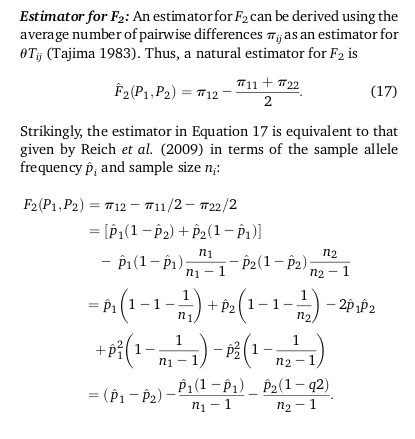
Ben says, just following this bit, that "The last line is the same as equation 10 in the appendix of Reich et al. (2009)."
Looking closer, I am not sure if this is the same as our definition. But, I am sure that our definition provides an unbiased estimate of the population quantity; omitting the "sampling without replacement" corrections would result in finite-size bias.
petrelharp
on 27 Nov 2019
For the first thing, would it be easy for you to produce a very small (e.g., one site, six individuals) example that has a difference between tskit and ADMIXTOOLS?
I won't have time immediately and haven't actually used ADMIXTOOLS myself, but we should be able to try this, yep.
I think the reason that the definitions don't look quite as you expect is that recall that we calculate everything (by default; unless polarised=False) summed over alleles.
Okay, this is something I didn't consider, but I think the reason why I didn't consider is that the API for f2, f3 and f4 doesn't include a polarised argument, so I (perhaps naively) assumed that it wasn't relevant for these particular statistics, and I think this is v likely for other users too, who may not have dug into the mathematical definitions of these statistics. I'd recommend providing this option, and explicitly saying something like "To calculate the canonical version of this statistic, use the polarised=False option." to avoid confusion.
Looking closer, I am not sure if this is the same as our definition. But, I am sure that our definition provides an unbiased estimate of the population quantity; omitting the "sampling without replacement" corrections would result in finite-size bias.
I don't think it is the same -- if you were to to expand out the expressions in that note that I just emailed you, there should be some square terms on the denominators of f2 and f3 for example.
The Reich lab definitions also claim to be unbiased estimators of the population-wide quantities. If it's true that you both have (different) unbiased estimators of those quantities, I'd recommend using their one so that you have something that's directly comparable to ADMIXTOOLS (which seems to be the standard thing used to calculate these things at the moment).
If your estimator turns out to be better than theirs for some other reason (smaller variance, for example), then that gives you a whole new cool thing that you can talk about in your paper!
I guess I'm having the same kinds of thoughts that you were having about my IBD work; it's great to have a way to calculate something better than what can be calculated with existing methods, but it's also good to be able to directly compare what you've done to what others have done. This will also make your statistics much more applicable.
gtsambos
on 27 Nov 2019
Also, some users may understand and define f-statistics as the actual empirical statistic that they calculate from their real data, rather than as an estimator of an underlying theoretical quantity. From this perspective, a different empirical statistic is not technically an f-statistic and perhaps shouldn't be called one, even though it may tag a lot of the same signal and converge to the same value as sample sizes increase.
gtsambos
on 27 Nov 2019
it's great to have a way to calculate something better than what can be calculated with existing methods, but it's also good to be able to directly compare what you've done to what others have done
I agree with this in principle, but I in fact still think that we are computing exactly the same thing as Reich et al. When developing these definitions, I did in fact check the definitions of these statistics, although it was long enough ago I don't remember the details, and could be wrong about some of it.
f2, f3 and f4 doesn't include a polarised argument, so I (perhaps naively) assumed that it wasn't relevant for these particular statistics.
To be clear; by default, statistics are unpolarised. There is, in fact, no polarised option on the f-stats, so it defaults to unpolarised, and so what we compute is the canonical version of the f-statistics.
Rather than spending more words on this, someone needs to double-check what exactly is done by admixtools, if that's the canonical implementation. I hope to do this soon, but would warmly welcome any other input.
petrelharp
on 27 Nov 2019
To be clear; by default, statistics are unpolarised. There is, in fact, no polarised option on the f-stats, so it defaults to unpolarised, and so what we compute is the canonical version of the f-statistics.
Yes; sorry, I think I knew this but was a bit muddled in the comment. So what you're saying is; the statistic that's actually calculated is the one you'd get if you substitute each frequency p with it's complement 1-p in one of the coded up expressions, and added that to the existing expression. In that case, I agree, f4 should be okay. Not necessarily the others tho.
Rather than spending more words on this, someone needs to double-check what exactly is done by admixtools, if that's the canonical implementation. I hope to do this soon, but would warmly welcome any other input.
Good idea -- don't worry, I'm sure we'll get to the bottom of it 🕊
gtsambos
on 27 Nov 2019
Here are the statistics as defined in Reich et al 2009:
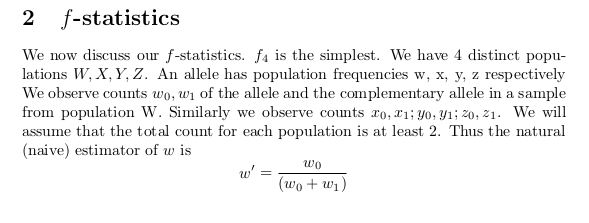
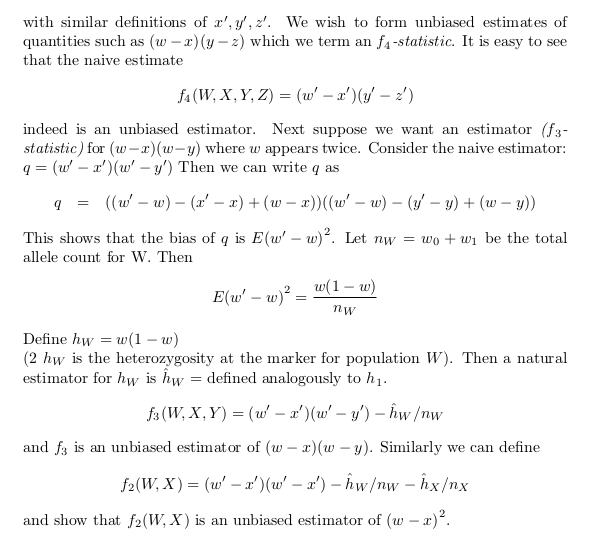
petrelharp
on 1 Dec 2019
Thanks for the ref @petrelharp! I'm going to work on this today too;
gtsambos
on 1 Dec 2019
Ah, one more thing: their estimated heterozygosity is
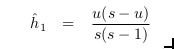
where u is the number of alleles out of a total of s samples.
petrelharp
on 1 Dec 2019
The elegant way to do the math is escaping me at the moment, besides just saying "they're both the unbiased estimators of the same thing, so much be equal"; but here's a code check for f3:
import numpy as np

def reich_f3(x, n):
   h = x[0] * (n[0] - x[0]) / (n[0] * (n[0] - 1))
   return (x[0]/n[0] - x[1]/n[1]) * (x[0]/n[0] - x[2]/n[2]) - h / n[0]

def f3(x, n):
   denom = n[0] * (n[0] - 1) * n[1] * n[2]
   numer = (x[0] * (x[0] - 1) * (n[1] - x[1]) * (n[2] - x[2])
            - x[0] * (n[0] - x[0]) * (n[1] - x[1]) * x[2])
   return numer / denom

def tsk_f3(x, n):
   return f3(x, n) + f3([nn-xx for xx,nn in zip(x, n)], n)

for _ in range(10000):
    n = np.random.randint(1, 12, 3) + np.array([1, 0, 0])
    x = [np.random.randint(0, nn, 1) for nn in n]
    if abs(reich_f3(x, n) - tsk_f3(x, n)) > 1e-8:
        print('oh no!', x, n)
        break
To close this, perhaps more documentation is in order? Do you think my suggestion above (first comment) would do it?
petrelharp
on 1 Dec 2019
Hmm, that seems pretty convincing! By your first suggestion, do you mean this one?
"they're both the unbiased estimators of the same thing, so much be equal"
I'll think about it -- since it's possible to have estimators with the same expected value but diff variance, probably a bit more than this should be said.
I'm having a go with ADMIXTOOLS atm -- will let you know what i get
gtsambos
on 1 Dec 2019
By your first suggestion, do you mean this one?
By "my suggestion above (first comment)", I meant this comment, above. (not sure if this is what you meant by "first suggestion?)
But, that suggestion might not address the real issue here. Is the issue that it's not clear that this computes the same thing as everyone else? It should be at least unambiguous what is computed; if it is not, do you have suggestions?
petrelharp
on 1 Dec 2019
Hullo! Sorry for the late reply; have been very busy. Thanks very much for all of this investigation -- I realise it's been quite a bit of work, and appreciate it.
It should be at least unambiguous what is computed; if it is not, do you have suggestions?
Yes, I think the first comment you made was helpful for resolving a particular query I had at the time, but the change in the docs might need a bit more.
I think it could potentially be quite confusing that the summary functions that you've listed for the statistics here look quite a bit different from the 'canonical' expressions that people might be more used to -- as you've explained, there are good reasons for this, but I think you could do a bit more to reassure users that when used in the f(p) + f(1-p) way that you are calculating them, the expressions turn out to be exactly identical to the ones they know and love already.
Perhaps, underneath each 'summary function', you could write the 2-allele version of the statistical expression that is computed using the summary function? The summary functions are theoretically interesting, but for most users, these are a bit of an under-the-hood technicality -- the important thing for users to know is whether the function computed using these summary functions is the same thing that they are calculating with their existing tools.
Btw, happy to help with this/submit a pull request if it would take some of the burden of this off you!
gtsambos
on 2 Dec 2019
For the first thing, would it be easy for you to produce a very small (e.g., one site, six individuals) example that has a difference between tskit and ADMIXTOOLS?
having major installation problems with ADMIXTOOLS atm but working on getting this going -- will report back when done
gtsambos
on 2 Dec 2019
Just going to post some other things I'm finding here in the meantime -- see this from the ADMIXTOOLS documentation:
By default f_3 output is normalized by estimatated heterozygosity
of the target.
Same with another f3 calculation tool from Pontus Skoglund's group:
--f3 Estimates the f3-statistic (Reich et al. 2009). The default is to use the heterozygosity correction described in Patterson et al. 2012, Genetics. For the simple f3 statistic f3=(p3-p1)(p3-p2) use --f3vanilla.
I haven't dug through the Reich paper to see what this correction is, but I'm assuming tskit calculates the 'vanilla', un-normalized version
gtsambos
on 2 Dec 2019
I haven't dug through the Reich paper to see what this correction is, but I'm assuming tskit calculates the 'vanilla', un-normalized version
Gee, I'm guessing that the "correction" is the correction for finite sampling (to obtain an unbiased estimator) that we were working through above (h-hat in the Reich et al equations above is heterozygosity). So, tskit computes --f3, not --f3vanilla.
petrelharp
on 3 Dec 2019
So, tskit computes --f3, not --f3vanilla.
Oh yeah, actually you're probably right, because that extra 'correction' term is some factor of p(1-p). I was a bit thrown by the word 'normalize' -- my gut interpretation was that this meant a correction by some multiplicative factor
gtsambos
on 3 Dec 2019
I was a bit thrown by the word 'normalize' -- my gut interpretation was that this meant a correction by some multiplicative factor
Yeah, me too.
petrelharp
on 3 Dec 2019
One extra thing to throw out there, and again, this is on the ADMIXTOOLS end of things (cc @mslick95): using it requires you to first convert the file to the 'EIGENSTRAT' format, one of the Reich lab's in-house file formats . This format only records unphased output a la PLINK files. It's a bit late in the day for me to be thinking about this properly but I'm guessing this could have some impact on the way the heterozygosity term is estimated?
gtsambos
on 3 Dec 2019
Just doing a bit of repo gardening here - did we end up with a resolution on this @gtsambos, @petrelharp ?
jeromekelleher
on 24 Mar 2020
I've done some experimenting with eigenstrat and popstats, and have concluded that (a) their documentation is terrible, (b) what is returned by qp3Pop differs by some scaling to our f3( ), and (c) popstats looks more promising, but I can't get it to run. Still - I'm convinced that what we computed agrees with the definitions given in several papers now (most usefully, in Peter 2016), and we document what exactly it is that we compute. I've run out of patience, but if anyone wants to work this out further, then my testing code might be useful (attached; as .txt as github won't allow upload of .py).
test_f3.txt
What do you say, @gtsambos - can we close this?
petrelharp
on 25 Mar 2020
I'm happy to close as well. It's pretty unfortunate that we can't get an external software working to verify these, but this isn't anything we can do about without sinking a lot more time into it -- I've also spent more time than I wanted to on this. It is disappointing that the software for computing these statistics on genotype data isn't obviously reliable. I'm happy to close, but I still think this change to the docs would be useful:
Perhaps, underneath each 'summary function', you could write the 2-allele version of the statistical expression that is computed using the summary function? The summary functions are theoretically interesting, but for most users, these are a bit of an under-the-hood technicality -- the important thing for users to know is whether the function computed using these summary functions is the same thing that they are calculating with their existing tools.
I think this is important because it allows users who may not have waded through all the details of your paper to understand exactly what they are computing.
gtsambos
on 25 Mar 2020
Have a look at the additions to the docs I made over in #397, @gtsambos and see if you think it improves things.
I think this is important because it allows users who may not have waded through all the details of your paper to understand exactly what they are computing.
I agree, but I hope that the existing docs explain clearly exactly what they are computing?
(As) an average across randomly chosen set of four samples (a, b; c, d), one from each sample set: The average density of sites at which a and c agree but differs from b and d, minus the average density of sites at which a and d agree but differs from b and c, per unit of chromosome length.
petrelharp
on 25 Mar 2020
Related issues
 hyanwong
·
7Comments
hyanwong
·
7Comments
 mufernando
·
6Comments
jeromekelleher
·
9Comments
hyanwong
·
5Comments
mufernando
·
6Comments
jeromekelleher
·
9Comments
hyanwong
·
5Comments
 bhaller
·
5Comments
bhaller
·
5Comments