Tskit: Tools for ancestry/inheritance calculation
Here's some closely related use cases that we're seeing (e.g. #612). I'd like to collect them in one place so we can settle on a minimal number of useful methods and an API. So far:
(ancestry painting) Given a list of nonoverlapping sets of nodes, the
ancestors, and a collection of samples, return somehow an assignment for each sample of which set of nodes it inherits from on each part of the genome (if any).(ancestry proportions) Instead of the whole ancestry painting, return summaries of it in windows: what proportion of the samples's genomes inherit from each set of ancestors, in each window.
(number of descendants) Given a list of samples and a list of nonoverlapping sets "ancestral" nodes, return for each set of ancestors what proportion of the samples' genomes that inherit from that set of nodes. (This should also be done in windows.)
The last two sound very similar, but one is indexed by ancestors; the other by descendants.
 petrelharp
All 22 comments
Totally.
For future reference, see also the functions node_span and mean_sample_ancestry here
 jeromekelleher
on 28 Sep 2018
jeromekelleher
on 28 Sep 2018
Hi @petrelharp and @jeromekelleher , I’ve been thinking about (1) myself too, and have come up with a solution that will suit my purposes. The basic idea is to make a table that lists all sample:ancestral node relationships in my TreeSequence. These are pretty similar to EdgeTables, except that they contain information about branches of the tree rather than edges.
A descriptive notebook about this is here. Feel free to have a look and let me know what you think!
(2) and (3) have not been as high on my radar, but I think it should be pretty easy to aggregate this kind of information from the more detailed output that I’m producing.
I’m going to keep chugging on with this by myself as it’s something I’ll need for my own analyses in the near future, but I’d be happy to submit a pull request if you find any of it useful!
Btw, I'm copying my supervisor @dvukcevic into this so he can see what I’m up to. (I’ll be away for a few days on holiday, again, so I won’t respond very quickly)
 gtsambos
on 11 Oct 2018
gtsambos
on 11 Oct 2018
A descriptive notebook about this is here. Feel free to have a look and let me know what you think!
This notebook is really cool! I don't quite get it on my first quick reading through, but I'll think about it again early next week and see if I can get my head around it.
Also, I've tidied up the mean_sample_ancestry function quite a bit and I think it's pretty robust now. Once it's implemented here in msprime in C it'll be very fast. Is this similar to what you're doing here?
jeromekelleher
on 11 Oct 2018
This notebook is really cool! I don't quite get it on my first quick reading through, but I'll think about it again early next week and see if I can get my head around it.
Thanks! Yeah it was a bit of a rush job as I'm' heading off soon - perhaps this diagram will help show what I'm doing a bit more clearly
Also, I've tidied up the mean_sample_ancestry function quite a bit and I think it's pretty robust now. Once it's implemented here in msprime in C it'll be very fast. Is this similar to what you're doing here?
I'll need a bit more time to have a look and get to you. One quick thing though - my code isn't computing the mean ancestry at each tree, but the ancestry of each individual leaf node on each tree. So it's a more de-aggregated version of the mean sample ancestry. You can calculate this mean by counting how many leaf nodes have a particular ancestry on each tree, but I'm guessing you did something a bit tricksier than that in your code...
gtsambos
on 11 Oct 2018
Thanks! Yeah it was a bit of a rush job as I'm' heading off soon - perhaps this diagram will help show what I'm doing a bit more clearly
I think it's more to do with the lack of coffee and time on my part! The diagram is great though, thanks.
I'll need a bit more time to have a look and get to you. One quick thing though - my code isn't computing the mean ancestry at each tree, but the ancestry of each individual leaf node on each tree. So it's a more de-aggregated version of the mean sample ancestry. You can calculate this mean by counting how many leaf nodes have a particular ancestry on each tree, but I'm guessing you did something a bit tricksier than that in your code...
You're right, this is different. It's sort of turning it upside down: mean_sample_ancestry computes things about the ancestors relative to the leaves, whereas you want things about the leaves relative to the ancestors. Very interesting, I'll definitely have a think about it.
jeromekelleher
on 11 Oct 2018
Thanks for the notebook, @gtsambos - you've got some interesting ideas there. Currently though, at least this part seems wrong (so I'm probably missing something):
for edge in tab.edges:
    if not (edge.parent in ancestral_nodes) & (edge.child in sample_nodes):
        # Define all edges with the internal node as a child
        for edge2 in tab.edges:
            if edge2.child == edge.parent:
                branch_table.add_row(
                    left   = edge2.left,
                    right  = edge2.right,
                    parent = edge2.parent,
                    child  = edge.child
                )
I'm not sure what the resulting table will tell you -- it seems necessary to check that edge and edge2 overlap, and to take into account what region they overlap on? if A inherits from B on [0,1] and B inherits from C on [3,5], won't this end up with an edge saying that A inherits from C on [3,5]?
petrelharp
on 11 Oct 2018
EDIT 8/11/18: I've since updated the notebook to account for the issues raised in this comment, but am keeping this comment here for historical purposes.
it seems necessary to check that edge and edge2 overlap, and to take into account what region they overlap on? if A inherits from B on [0,1] and B inherits from C on [3,5], won't this end up with an edge saying that A inherits from C on [3,5]?
Hmm, thanks for pointing this out @petrelharp -- that's definitely what I planned for in my mock up pseudo code but I can't see any such check here. My code seems to have produced the correct branch table anyway, and i need to think a bit more about why... Perhaps the scenario you describe doesn't arise in my particular example due to the way the nodes are ordered.
I won't have time to update my code till I get back from my holiday, but I'll think about it in the meantime. This was more just so you have an idea of how I'm thinking about your issue (1) - it's definitely not a polished product or anything!
gtsambos
on 12 Oct 2018
Note, that might be useful in reducing code redundancy in the future: all of these operations have to do with moving stuff around in the tree sequence: case (1) has that you give the ancestors some colors and propagate the colors down; case (3) has that you distribute some mass among the samples and propagate that mass up. We're doing this efficiently by maintaining the state in each marginal tree and updating it as we move along, and aggregating/outputting it somehow. This is how the general statistics work also. All this could be abstracted into:
a) boundary conditions
b) propagation direction (down or up) and rules for propagating through nodes
c) output rules
so, case (1) above has
a) assign unique integer labels to each ancestral population
b) copy labels down
c) output paintings for selected samples
and case (3) has
a) give state 1.0 to each sample
b) each node has state equal to the sum of its descendants
c) output the average value of the (sum of the states across the set of ancestors) divided by number of samples
and all the SiteStats and BranchLengthStats use the same internal state as case (3), just possibly with a vector instead of a single value, and using different output functions.
petrelharp
on 23 Oct 2018
Agreed, this is a good clarification.
jeromekelleher
on 24 Oct 2018
Hiya, a quick update: I have been able to get a pipeline for (1) up and running that I think will serve well enough for my own purposes (for now).
The basic idea is the same as the one I introduced in my comment above, with a number of improvements: I've addressed the error in the original workbook that @petrelharp noticed in this comment, the algorithm is a bit different (I now "push up" a single node at a time, rather than in "layers" as in the first notebook) and there are a few internal modifications - most notably, I convert all the various tables into pandas dataframes first to make them easier to manipulate.
The basic output looks like this: a regular friendly EdgeTable, but where the parent field lists the ancestral population label rather than the parent node id.
id  left        right       parent  child
0   0.00000000  2.00000000  0   0
1   2.00000000  3.00000000  1   0
2   0.00000000  1.00000000  0   1
3   1.00000000  3.00000000  1   1
4   0.00000000  3.00000000  0   2
5   2.00000000  3.00000000  0   3
6   0.00000000  2.00000000  1   3
7   2.00000000  3.00000000  0   4
8   0.00000000  2.00000000  1   4
9   0.00000000  3.00000000  1   5
With this output, I've been able to make plots like this one that show local ancestry for each node/individual at each site in the simulated treeSeq (with colours representing ancestral populations in this instance)
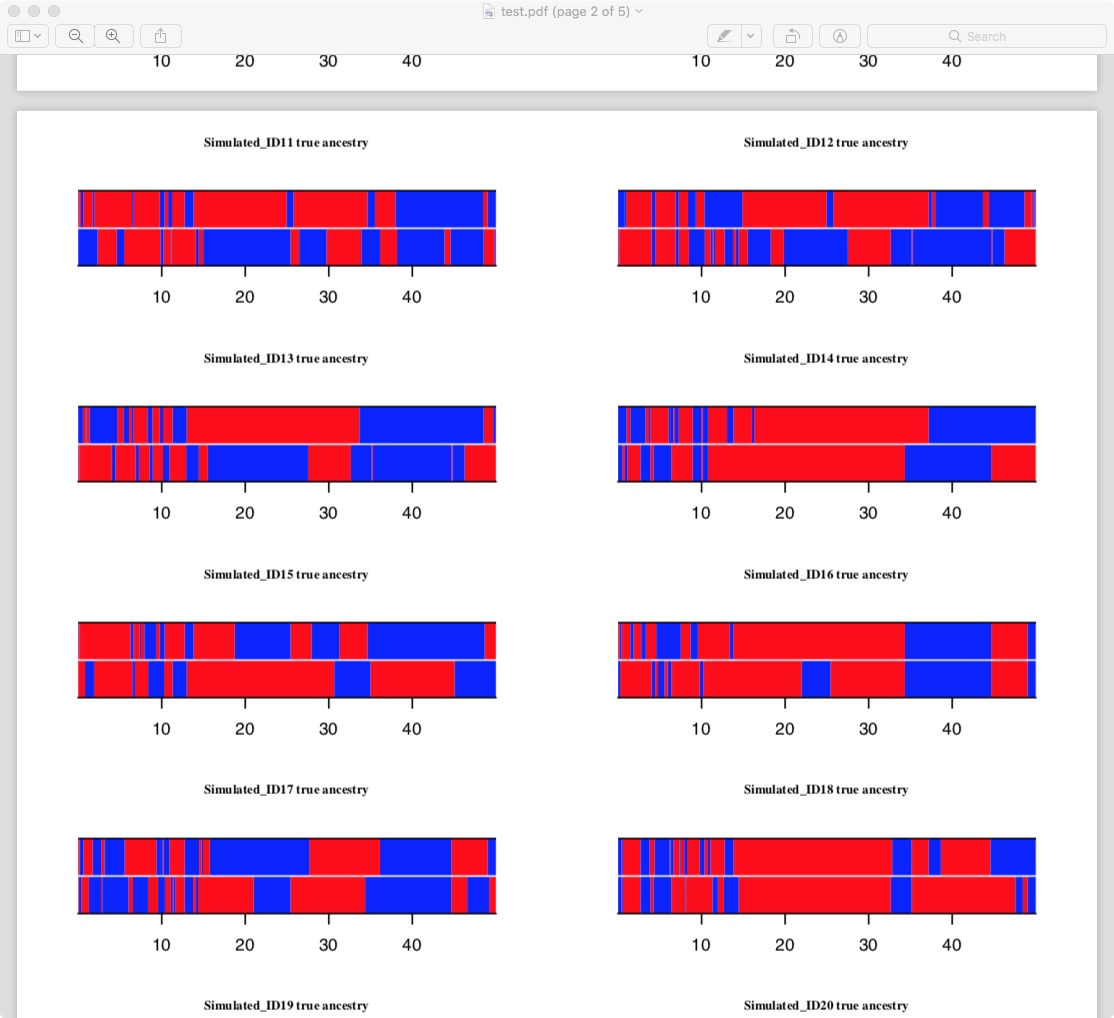
There are still a few improvements I need to make before this is shareable. A few major ones I can think of are:
It's currently working with admixed treeSeqs generated in SLiM, rather than msprime. There are a few lil extra things I'll need to specify and check before it works with msprime-generated
.treesfiles. This is also the major cause of inefficiency in my pipeline at the moment - sometskitfunctions likesimplify()don't do all I want them to do with treeSeqs that have been generated under SLiM (the subject of a current email convo with @petrelharp that I'll answer soon, I'm sorry!), and I'm using some hacky workarounds for now.It makes some very simplifying assumptions about the admixture, including single-pulse admixture, only two populations...
Speed-wise, it's fast enough for me, though much slower than what should be possible given that all the information is in the treeSeqs already. The pics above are generated for a sample of 50 people (100 sample nodes) - I specified a chromosome length of 50 000 000 bp in SLiM and realistic values for all demographic parameters other than effective population size. It took about 5 min to run my pipeline on my desktop.
I'm going to elaborate on my hopes and dreams for the simplify() function somewhere public (maybe over here?) when I get time, because I think this would speed things up substantially.
I'll share some more expository notebooks about this once I've cleaned them up a bit...
Also just copying in my supervisor @dvukcevic so he sees this.
gtsambos
on 4 Dec 2018
Gee, those look nice!
The basic output looks like this: a regular friendly EdgeTable, but where the parent field lists the ancestral population label rather than the parent node id.
Hm, that's an interesting idea. Although I feel this should be called something else than an EdgeTable, and the parent column something else also.
petrelharp
on 5 Dec 2018
Gee, those look nice!
Thanks! I'll show how I did it when I clean up my scripts, hopefully over the next few days. It will be quite quick now that I understand why this was happening.
Although I feel this should be called something else than an EdgeTable,
I have been describing them as "branch tables" to emphasise the fact that they are listing relationships between sample nodes and root/ancestral nodes, rather than between child and parent nodes. I just wanted to emphasise that they take the same format as EdgeTables and can be manipulated with many of the same tools.
and the parent column something else also.
I think ideally, the parent field should be population, and it would be good to have an extra column called ancestor that lists the ancestor from the ancestral population that the node inherits from. I just avoided that here because I didn't need it, and it was useful to be able to use some of the functions made for edgeTables.
gtsambos
on 5 Dec 2018
Here's another thing we'd like to compute:
(4) Given a pair of nodes a and b, compute for every node u what proportion of the genomes of a and b first coalesces at u.
This would be a collection of numbers that sum to 1. This is like computing, for each node u, the proportion of the genome on which both a and b inherit from u, but doing a "tree difference" at each tree along the way.
petrelharp
on 21 Dec 2018
I've been mucking around with ancestry-related tools in the process of making figures for a review over here. I've been not worrying about whether anything is the right way to do anything, just treating it as a sandbox. Here's some notes on what I observed so far:
One thing I found useful was something that would return all (parent, child) node relationships satisfying certain conditions, as for instance in this method. Other conditions include:
- child in some set
- parent in some set
- genetic inheritance on some interval
This is easy and quick to do using numpy (following @gtsambos's lead using tables to do it quickly here). If this seems more generally useful, what's the right way to return this? As a list or array of (parent, child) tuples? As a {parent: children} dict? As a matrix? (see below)
The edge table is structured very much like a sparse matrix (with
parentandchildstanding in foriandj). For instance, given aleftand aright, you can make a matrix that is1for every(i,j)such that there is an edge fromitojthat intersects(left, right]. It's easy to compute the matrix (here). This allows for some very fast computations of genealogical relatedness, as for instance, here. (If the matrix isM, then(M * M)[i,j]is nonzero iff there's a path of length two up through some marginal tree in[left, right)from i to j, for instance.)The downside of this is that it's genealogical relatedness, not genetic relatedness, unless
left == right. (Here's something fun, but maybe not actually useful: form the matrix $M$ whose $(i,j)$th entry is the indicator function of all stretches of chromosome that $j$ inherited from $i$. Many things we're talking about doing in terms of ancestry propagation can be described in terms of matrix powers of $M$, where multiplication of functions is done pointwise.)
There's also some tools particular to the case where everyone, ever is recorded (a "full pedigree"). I talked about that in pyslim. And some tools for dealing with space.
And, there's a bunch more things that I'd like to do that I can't yet (because doing the naive way, iterating over trees in python, is waaay to slow). So, I'm looking forward to getting this stuff working!
petrelharp
on 10 Jan 2019
All sounds very cool to me. Re the "full pedigree" stuff, I think this is also relevant to the work @JereKoskela is doing on storing the full (little) ARG from msprime simulations over here
jeromekelleher
on 10 Jan 2019
I think this is also relevant to the work @JereKoskela is doing on storing the full (little) ARG from msprime simulations over here
Oh, really? How so?
petrelharp
on 10 Jan 2019
Oh, really? How so?
It's a similar thing, right? The little ARG tracks all the individuals ancestral to the sample that a lineage passes through, including those that coalescences occur in. The full pedigree is similar, I guess, but it's more like the big ARG, in that also includes individuals that are not ancestral to the sample.
jeromekelleher
on 10 Jan 2019
Something nonobvious I've discovered in working in that sandbox. It is sometimes natural to work with boolean arrays. But, we should not end up sometimes using boolean arrays and sometimes using arrays of indices, and translating boolean arrays to indices with np.where( ). It's hard to keep track of what is what, and I just spent a while tracking down a bug because I applied np.where( ) to an array of indices, which produced no errors at all.
petrelharp
on 13 Jan 2019
@petrelharp can this be closed or should we keep it open?
jeromekelleher
on 29 Sep 2020
Good question. What do you think, @gtsambos?
petrelharp
on 29 Sep 2020
I reckon we can close it given various bits of progress over the last few years. Just looking at the issues in the OP: (1) has been addressed by link_ancestors (though some additional 'wrapper' that makes its uses more obvious might be good in the future too.) (2) sounds like a node statistic that would be fairly easy to code up if wanted (and if you haven't done so already, @petrelharp).
(3) hasn't been done to my knowledge, but now I'm reading over it again, I think some details would need to be ironed out before it was -- for example, what would you do if the ancestral node only has extant ancestry in some of the window? I suspect that part of the reason why we dropped this is that there was no immediate use case for it, compared with these other things.
In general, I think we've done a lot of work making various tools that are useful for analyses of ancestry and inheritance, and any further work would be better to discuss in a more specific issue.
gtsambos
on 30 Sep 2020
Thanks @gtsambos, I'll close this.
 benjeffery
on 30 Sep 2020
benjeffery
on 30 Sep 2020
Related issues
jeromekelleher
·
9Comments
jeromekelleher
·
7Comments
 hyanwong
·
3Comments
hyanwong
·
3Comments
 daniel-goldstein
·
8Comments
petrelharp
·
6Comments
daniel-goldstein
·
8Comments
petrelharp
·
6Comments