Ts-node: Can support WebStorm breakpoint ?
Can I debug in WebStorm running as ts-node?
 k8w
k8w
All 24 comments
Probably not. There's no API for dynamic source maps and isn't really a ts-node issue but a node.js issue. If it's possible, someone can point me to, until then see https://github.com/TypeStrong/ts-node/issues/46.
 blakeembrey
on 25 Aug 2016
blakeembrey
on 25 Aug 2016
NodeJS can debug in Webstorm, and WebStorm support to specify a node Runner
(Run / Edit Configurations / Node.js / Node interpreter)
I tried to set it as ts-node
Seems WebStorm run a debug command as:
D:\Program Files (x86)\JetBrains\WebStorm 2016.2.1\bin\runnerw.exe" C:\Users\King\AppData\Roaming\npm\ts-node --debug-brk=59672 --expose-debug-as=v8debug E:\test\test.ts
If NodeJS , it should be:
XXX\runnerw.exe" XXX/node.exe --debug-brk=59672 --expose-debug-as=v8debug XXX.js
and finally got a error:
CreateProcess failed with error 193 (no message available)
So don't know if it's a problem about params --debug-brk=59672 --expose-debug-as=v8debug
k8w
on 25 Aug 2016
Yes, I know. This, as I mentioned, is related to source maps. Even if you can debug (which you can) there's no point because it doesn't know where the debugger is located in relation to the TypeScript file.
blakeembrey
on 25 Aug 2016
By the way, you can add any of the extra flags to https://github.com/TypeStrong/ts-node/blob/master/src/bin.ts. It looks like --export-debug-as is missing.
blakeembrey
on 25 Aug 2016
In case it is useful to somebody...
Debugging in WebStorm using ts-node works well on a Mac.
Unfortunately, it does not work well on Windows because of the following bug which was fixed yesterday.
https://youtrack.jetbrains.com/issue/WEB-21753
Hopefully, a new release of WebStorm will soon be available with this fix.
 ncochard
on 21 Oct 2016
ncochard
on 21 Oct 2016
@ncochard Can you please explain how do you debug in webstorm by use breakpoints, I have mac and latest webstorm and my breakpoints just skipped, but it works if I put debugger statement
 cevek
on 21 Oct 2016
cevek
on 21 Oct 2016
@cevek I've prepared a sample project at the following URL.
https://github.com/ncochard/sample-ts-project.git
If I have not made any mistake, you should be able to just clone that project (on your Mac), place a breakpoint in the unit tests and start debugging.
ncochard
on 22 Oct 2016
@ncochard Thank you! That works for me!
cevek
on 23 Oct 2016
For anyone who is still having issues (for me I didn't want to use mocha just debug typescript files). If you add --require ts-node/register to Additional Parameters for node it should work. (see image)

 ghost
on 16 Mar 2017
ghost
on 16 Mar 2017
@thed0ctor Thank you so much!! I've been struggling with this, and just adding this magical --require ts-node/register made it work 👍
EDIT: Argh, it worked because I forgot a debugger; statement, but using WebStorm breakpoints still do not work :/
I see that in your example project your perform a static .ts compilation, but I would prefer to use ts-node all the way.
 sinedied
on 3 May 2017
sinedied
on 3 May 2017
@sinedied it's actually supposed to be in the "node parameters" box. I ran into issues when I added arguments to my app
ghost
on 3 May 2017
Yes, I did that but I can't make webstorm breakpoints to work using just ts-node and not the tsc compiler. I'm on OSX by the way.
sinedied
on 4 May 2017
@sinedied I'm using IntelliJ IDEA which shouldn't make a difference. Do you have a simple hello world project that recreates the issue? And I mean bare minimum simple project
ghost
on 4 May 2017
@thed0ctor when making a simple project to demonstrate the issue, I found the solution: I was using the "mapRoot": "./" option is tsconfig.json, removing it made debugging works! :tada:
The problem is that automatic imports are not so nice now, but hell yeah I can debug properly!
sinedied
on 4 May 2017
@sinedied can you share your solution?
 josephfinlayson
on 10 Jul 2017
josephfinlayson
on 10 Jul 2017
Here is my tsconfig.json:
{
  "compilerOptions": {
    "lib": ["es6"],
    "module": "commonjs",
    "moduleResolution": "node",
    "sourceMap": true,
    "target": "es6",
    "noImplicitAny": false,
    "suppressImplicitAnyIndexErrors": true,
    "typeRoots": [ "node_modules/@types" ]
  }
}
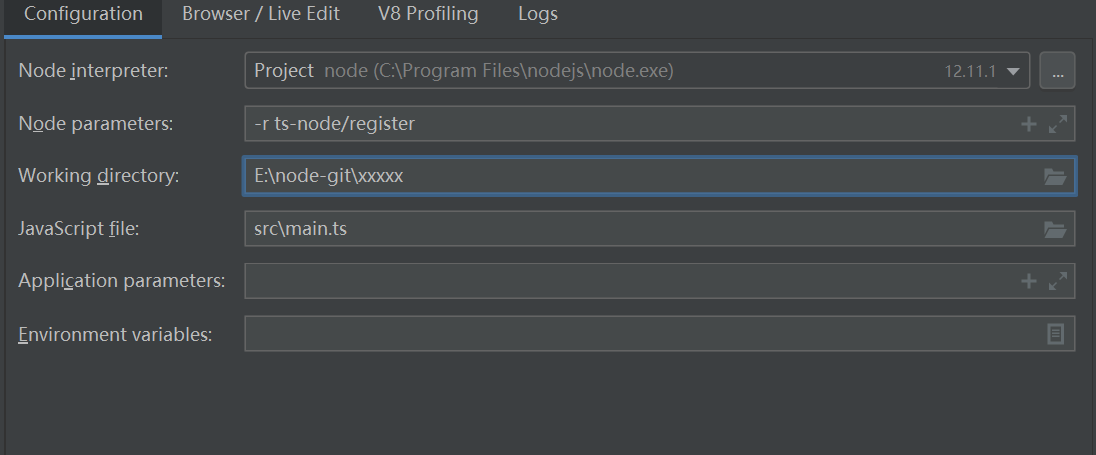
As for the WebStorm task, here it is:

Then I just start in debug mode and breakpoints works 😃
sinedied
on 12 Jul 2017
A big thank you for your @sinedied response that works great.
By cons, how to adapt for npm? In my project I use process.env variable positioned by npm which I do not have via the debugger since it is node and not npm.
 La-source
on 25 Aug 2018
La-source
on 25 Aug 2018
@La-source You can set environment variables in webstom tasks too. Instead of a NodeJS task, you can create a NPM task, and use the same node parameters in your NPM script as shown on the screenshot above.
sinedied
on 25 Aug 2018
@sinedied Thanks. I have solved my trouble according to your comment. Very helpful.
 jasonLiu001
on 21 Nov 2018
jasonLiu001
on 21 Nov 2018
just configure _ts-node_ interpreter
- Install _ts-node_:
npm i ts-node --save - Add configuration
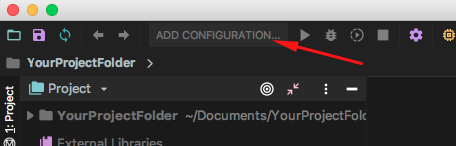
- Choose Node.js Configuration template

- Choose Working directory and JavaScript file(your Typescript entry point)

- Add _ts-node_ interpreter: click
+and"Add Local..."

- Find installed _ts-node_ interpreter (our first step)
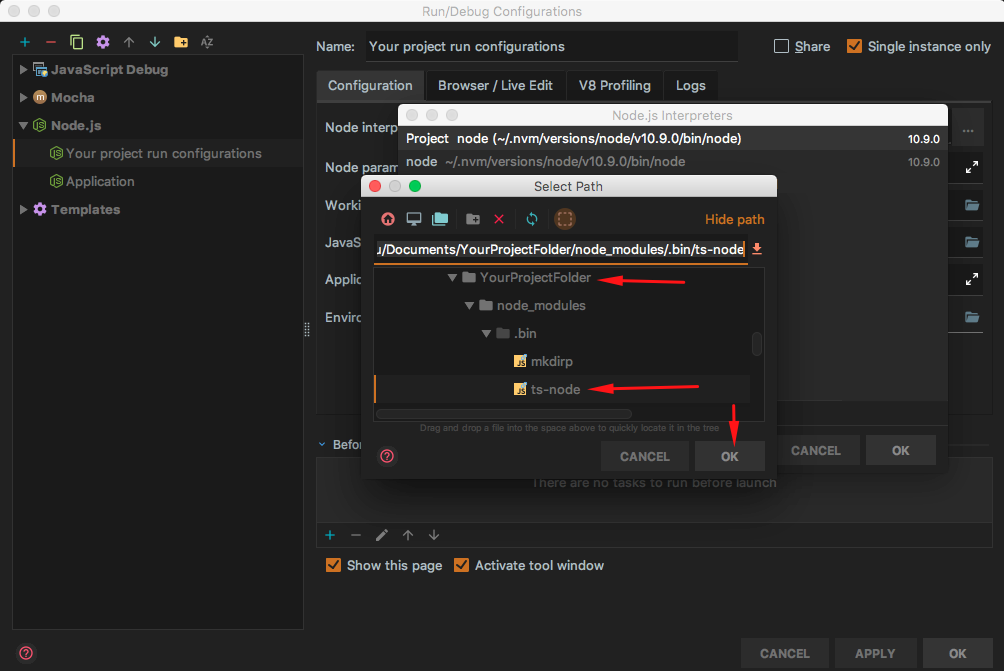
- Choose interpreter

- Final configs

Ready
You can run and debug your code
 Evilart86
on 8 Dec 2018
Evilart86
on 8 Dec 2018
I made it work by add a script to package.json as follows:
node $NODE_DEBUG_OPTION --require ts-node/register src/index.ts
So I can click "debug" button to start the debug session:
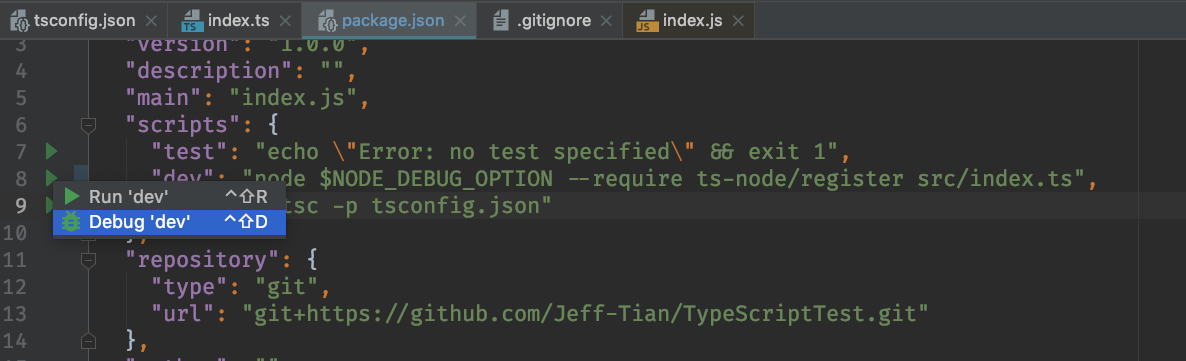

 Jeff-Tian
on 25 Mar 2019
Jeff-Tian
on 25 Mar 2019
Anyone managed to get it to work with ts-node-dev?
https://github.com/whitecolor/ts-node-dev/issues/75
Jeff, your solution works great for ts-node
 quantuminformation
on 8 Jun 2019
quantuminformation
on 8 Jun 2019
webstorm 2019
ts-node @ 7.x
typescript @ 3.7.x
npm typescript
i use the config can debug typescript file .
 LastKing
on 15 Jan 2020
LastKing
on 15 Jan 2020
I made it work by add a
scripttopackage.jsonas follows:node $NODE_DEBUG_OPTION --require ts-node/register src/index.tsSo I can click "debug" button to start the debug session:
It's great.
The solution is also approriate for Babel-node debug
 xusai2014
on 1 Apr 2020
xusai2014
on 1 Apr 2020
Related issues
 nehalist
·
3Comments
nehalist
·
3Comments
 sanex3339
·
4Comments
sanex3339
·
4Comments
 KiaraGrouwstra
·
3Comments
KiaraGrouwstra
·
3Comments
 cibergarri
·
3Comments
cibergarri
·
3Comments
 OliverJAsh
·
3Comments
OliverJAsh
·
3Comments
Most helpful comment
Here is my
tsconfig.json:As for the WebStorm task, here it is:

Then I just start in debug mode and breakpoints works 😃