Truffleruby: "Reverse Complement" benchmark slower than MRI
The reverse complement example of the Debian Toygame project seems to run ~ 5-10 times slower on truffleruby 0.29 than on MRI1.8.7.
To reproduce this issue, clone [email protected]:Ichaelus/scripts_slower_in_truffle.git and run revcomp.rb with both interpreters.
Michael
 Ichaelus
All 21 comments
@nirvdrum Could you investigate? Or @aardvark179 ?
The benchmark is at https://github.com/Ichaelus/scripts_slower_in_truffle/blob/master/revcomp.rb
This benchmark does a lot of IO (reading a 10MB file each iteration!)
and String manipulation.
The central method seems:
def revcomp_segment(seq, output_file)
  seq.reverse!.tr!(CODES, COMPLEMENTS)
  stringlen=seq.length-1
  0.step(stringlen,60) {|x|
    output_file.print seq[x,60] , "\n"
  }
end
 eregon
on 30 Nov 2017
eregon
on 30 Nov 2017

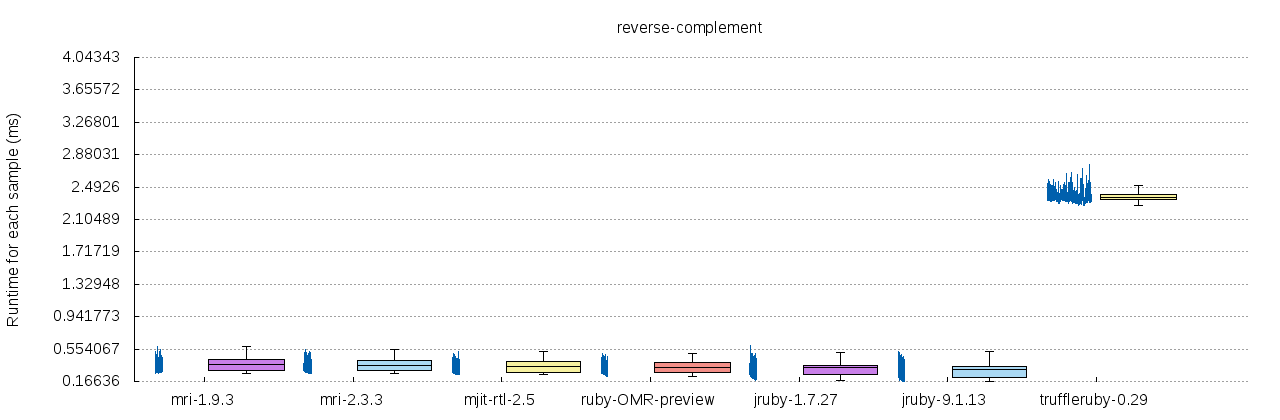
Appendix: A more precise comparison of the example stated above with 1,500 Iterations.
Ichaelus
on 30 Nov 2017
That's a nice graph! Shows everything all in one! (The blue line is a time series isn't it? Is the x-axis of each little time series graph iteration or elapsed wall-clock time?)
 chrisseaton
on 30 Nov 2017
chrisseaton
on 30 Nov 2017
I'll take a look shortly. Reading I/O is a bit of a demon case for ropes. But now we have a good benchmark to work with.
 nirvdrum
on 1 Dec 2017
nirvdrum
on 1 Dec 2017
I've spotted a few sub-optimal things we're doing. Excessive array copies and hitting a boundary unnecessarily. I'll have a PR ready for that stuff tomorrow.
nirvdrum
on 1 Dec 2017
I think I've fixed the most egregious issue. Using the default settings from https://github.com/Ichaelus/scripts_slower_in_truffle the benchmark dropped from 298s -> 100s for me. MRI 2.3.5 takes 91s and JRuby 9.1.14.0 takes 67s, so we're still slower but we're considerably closer now.
nirvdrum
on 1 Dec 2017
Thanks @chrisseaton :-)
Yes you're right, it's a time series with equally distributed width per sample (iteration). I found it hard interpreting boxplots when performance is slowly decreasing over time!
@nirvdrum Thats great! I'll deliver similar benchmarks, should it happen for me to find similar issues.
All the best
Ichaelus
on 1 Dec 2017
Would it be possible to draw the time series with the x axis being total elapsed wall-clock time? Otherwise you have the y axis value conflated with the x axis value. Then it would also be possible to read off the time series in one look basically how long it takes to warm up.
But the time series is already useful because it looks clear to me the program isn't optimising at all - there is no phase change there.
chrisseaton
on 1 Dec 2017
I didn't think about that yet, but it clearly would be interesting. I should be able to plot this variant until Monday
Ichaelus
on 1 Dec 2017
Just here to say: @Ichaelus nice plot! Would like to see @chrisseaton's idea as well. Not sure how well it works though, because you got a constant sized space on the x-axis, right? But perhaps scaling everything based on max wall-clock time of all benchmarks would make things very obvious.
 smarr
on 1 Dec 2017
smarr
on 1 Dec 2017
you got a constant sized space on the x-axis, right
Right, so it becomes an x-y scatter plot with a line through it, I think (probably shouldn't have a line as it's discrete not continuous, but practicalities).
chrisseaton
on 1 Dec 2017
To clarify if I got you right:
- the x-offset of the blue line (sample results) should change from
iteration / #iterationstoaccumulated clock time until this iteration / total clock time for all iterations - the y value should remain the time used for each sample.
Wouldn't this lead to increased conflation since both x- and y- distances represent sample time differences?
Ichaelus
on 1 Dec 2017
This is the updated plot, where each sample is horizontally positioned based on the currently accumulated execution time relative to the most time-consuming interpreter.
Since the relative time consumption is already shown on the y-Axis, I'll change the plot once again for every interpreter to be time-relative only to itself (to reach the maximum x-width).
Ichaelus
on 1 Dec 2017
Sorry I wasn't clear - what I mean that when I see iteration as the x-axes, the only way for me to work out when the iterations happen is to mentally conflate the two axes - to sort of lie down the lines end-to-end.
This is because what I'm interested in is when did performance change in wall-clock time. If you don't care about that then you wouldn't want to change the graph as I want. If you care about which iteration performance changed then you want the graph as you have it - but why would anyone care about the iteration rather than the time it takes to change?
chrisseaton
on 1 Dec 2017
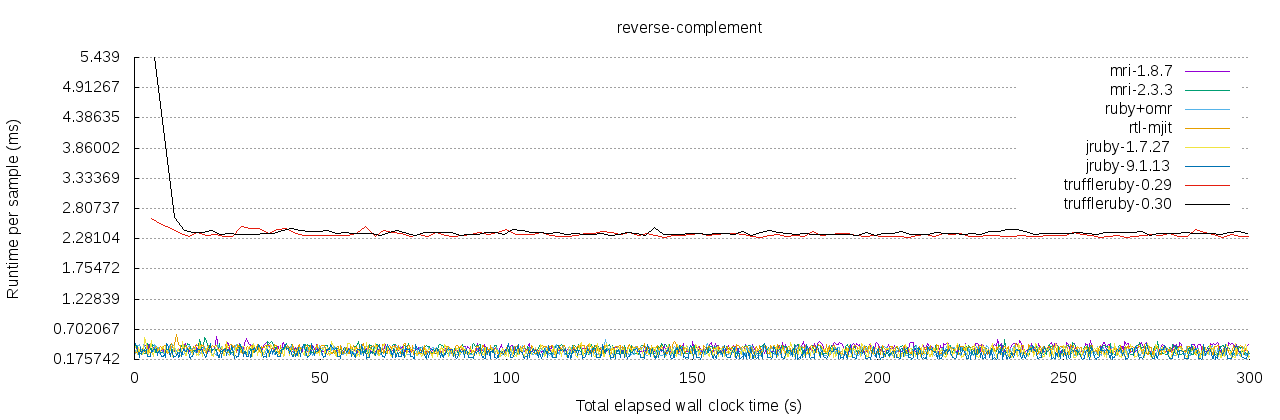
It took me some time since a few other things crossed my schedule, but here is an updated plot of the performance over time (5 minutes).
TruffleRuby 0.30 does not seem to include the improvement of @nirvdrum, is there some kind of changelog for TR? I just found the one of Truffle
The performance of other interpreters is limited to a smaller range, which is better inspect-able once TR reaches a similar runtime.
Best,
Michael
Ichaelus
on 11 Dec 2017
@Ichaelus GraalVM 0.30 is from November 27, and @nirvdrum's fix is from December 1, so it is not included in that release.
We have a GraalVM release about once a month, but there is no fixed date yet for the next release.
If you want you can build TruffleRuby and Graal yourself to try with the latest TruffleRuby:
See Building TruffleRuby and Building Graal.
eregon
on 11 Dec 2017
Thanks @eregon, I wasn't able to spot the exact release date of the latest GraalVM.
I'll wait for new years eve - version then! ;-)
Michael
Ichaelus
on 11 Dec 2017
@Ichaelus FYI, GraalVM 0.31 was released and includes the aforementioned fixes. I think there's still more we can do with TruffleRuby on this benchmark. But at least the numbers you see now should be on par with the other Ruby implementations.
nirvdrum
on 7 Feb 2018
This are great news, thanks for sharing them with me!
Ichaelus
on 14 Feb 2018
No problem. If you re-run the benchmarks, I'd love to see what your results look like now.
nirvdrum
on 15 Feb 2018
FYI, the changes in #1129 should help a fair bit as well.
nirvdrum
on 21 Feb 2018
Related issues
 deepj
·
31Comments
deepj
·
31Comments
 jaydanielian
·
17Comments
deepj
·
16Comments
jaydanielian
·
17Comments
deepj
·
16Comments
 nateberkopec
·
16Comments
chrisseaton
·
23Comments
nateberkopec
·
16Comments
chrisseaton
·
23Comments
Most helpful comment
Appendix: A more precise comparison of the example stated above with 1,500 Iterations.