Tribler: Understanding the impact of latency on Libtorrent thoughput
Problem: Tor-like tunnels introduce significant latency.
Measure how 25ms to 1000ms of latency affects the Libtorrent throughput. Aim to understand how LEDBAT parameters can be set to maximize throughput. Create an experimental environment using containers. Use netem to create latency between two containers. Start seeder at one container, download across the connecting bridge with added latency.
Initial results: performance is severly efected by latency of _just 50 ms_.
 synctext
All 179 comments
Current operational measurement scripts: https://github.com/vandenheuvel/libtorrent-latency-benchmark
synctext
on 15 Nov 2016

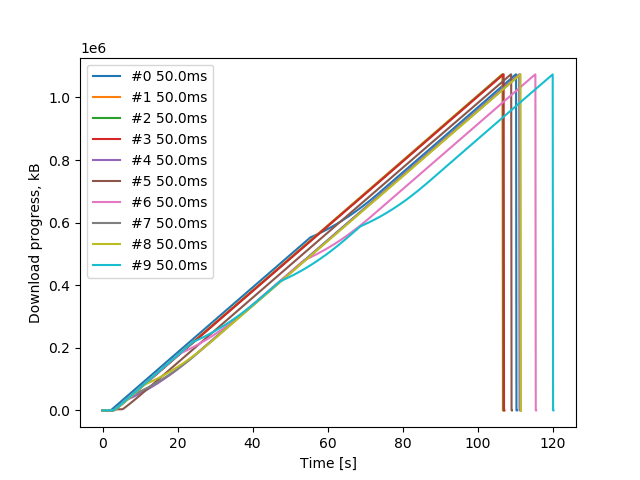
Measurements of the libtorrent download speed under different latencies with 6 seeders.
 MaxVanDeursen
on 15 Nov 2016
MaxVanDeursen
on 15 Nov 2016
This is relevant for achieving _onion routing with defence against traffic confirmation attacks_.
 vandenheuvel
on 15 Nov 2016
vandenheuvel
on 15 Nov 2016
ToDo for next meet, from Libtorrent API docs + tuning:
- Understand performance tuning and experiment with various settings
- Compile from source
session_settings high_performance_seed();outstanding_request_limit_reachedsend_buffer_watermark_too_low- Directly add a test for latency sensitivity in Libtorrent existing software emulation suite?
synctext
on 15 Nov 2016
Investigate max_out_request_queue, and here.
vandenheuvel
on 15 Nov 2016
Background http://blog.libtorrent.org/2015/07/slow-start/ and http://blog.libtorrent.org/2011/11/requesting-pieces/
Easy fix: high_performance_seed returns settings optimized for a seed box, serving many peers and that doesn't do any downloading. It has a 128 MB disk cache and has a limit of 400 files in its file pool. It support fast upload rates by allowing large send buffers.
Additional boost: asynchronous disk I/O
Detailed solution : I’m unable to get more than 20Mbps with a single peer on a 140ms RTT link (simulated delay with no packet loss)..
Original post
things you could adjust according to Arvid Norberg lead engineer of the libtorrent project.

“Did you increase the socket buffer sizes on both ends?”

int recv_socket_buffer_size;
int send_socket_buffer_size;
“There’s also buffer sizes at the bittorrent level:”

int send_buffer_low_watermark;
int send_buffer_watermark;
int send_buffer_watermark_factor;
“And there are buffers at the disk layer:”

int max_queued_disk_bytes;
int max_queued_disk_bytes_low_watermark;
New test using LXC's. Ten seeding LXC's, one downloading LXC. Single measurement. While high latencies seem to start slower, high latencies seem to do substantially better once transfer speed has stabilized. Latencies up to 150 ms perform, at maximum speed, similar to the base test without any latency. Measurement without any latency is very similar to earlier test using VMs.

vandenheuvel
on 24 Nov 2016
A single seeding LXC. Single measurement. Higher latencies impact throughput heavily. 
vandenheuvel
on 1 Dec 2016
ToDo, try to obtain more resilience against latency in Libtorrent with single seeder, single leecher. Plus read current research on traffic correlation attacks. The basics are covered here. Quote: _'recent stuff is downright scary, like Steven Murdoch's PET 2007 paper about achieving high confidence in a correlation attack despite seeing only 1 in 2000 packets on each side'_.
synctext
on 1 Dec 2016
Strange observation that it takes 60 to 100 seconds for speed to pick up.
is the seeder side the bottleneck, due to anti-freeriding stuff?
Please repeat multiple times and create boxplots.
1 iteration to find the magic bottleneck...
synctext
on 15 Dec 2016
Good news: It appears that the magic bottleneck is identified. Plot of single seeder, single leecher, 200ms latency. No reordering.

Throughput is mostly 15MB/s. Now with doubling the default and max parameters of net.ipv4.tcp_rmem and net.ipv4.tcp_wmem (measured in bytes):

We notice that throughput doubles also, to roughly 30MB/s. The bad news, however, is that further increasing these parameters has little effect: most of throughput speeds never pass the 35MB/s.
Also, the inconsistency in these measurements is still unexplained.
vandenheuvel
on 15 Dec 2016
good! next bottleneck...
synctext
on 15 Dec 2016
The magic parameter setting are discovered now, resulting in 35MByte/s Libtorrent throughput.
Next steps are to advance this throughput in Tribler and Tribler+tor-like circuits.

Please document your LXC containers.
ToDo: Tribler 1 seeder, 1 leecher; see influence of blocking SQLite writes on performance...
@qstokkink understands the details of tunnel community...
synctext
on 10 Jan 2017
You will probably want a repeatable experiment using the Gumby framework. You are in luck, I created a fix for the tunnel tests just a few weeks ago: https://github.com/qstokkink/gumby/tree/fix_hiddenseeding . You can use that branch to create your own experiment, extending the hiddenservices_client.py HiddenServicesClient with your own experiment and your own scenario file (1 seeder, 1 leecher -> see this example for inspiration).
Once you have the experiment running (which is a good first step before you start modifying things - you will probably run into missing packages/libraries etc.), you can edit the TunnelCommunity class in the Tribler project.
If you want to add delay to:
- Intermittent relaying nodes, add delay here
- Exit nodes, add delay here
- The sending node, add delay here
You can combine relaying nodes and the sending node into one by adding delay here (which does __not__ include the exit node)
 qstokkink
on 10 Jan 2017
qstokkink
on 10 Jan 2017
1 Tribler seed + 1 Tribler leecher with normal Bittorrent with 200ms - 750ms latency is limited by congestion control. Read the details here. To push Tribler towards 35MB/s with added Tor-like relays we probably at some point this year need to see the internal state of the congestion control loop.
ToDo for 2017: measure congestion window (cwnd) statistics during hidden seeding.
synctext
on 13 Jan 2017
We managed to do some new tests. We ran Tribler with the only the http API and libtorrent enabled. We found that the performance of libtorrent within Tribler is significantly worse than plain libtorrent. Below is a summary of results so far. Note that these values for a single seeder single leecher test.
| | libtorrent | Tribler |
| ---|:---:|:---:|
no latency | ~160 MB/s | 30 - 100 MB/s |
200 ms | ~15 MB/s | ~2.5 MB/s |
200 ms + magic | ~35 MB/s | ~2.5 MB/s |
Note that "magic" is the increasing of net.ipv4.tcp_rmem and net.ipv4.tcp_wmem parameters. It appears that Tribler suffers from a different bottleneck. Note that when testing without latency, speed varies heavily between ~30 MB/s and ~100 MB/s. During the all tests, cpu load was ~25% on 3 cores.


@synctext @devos50 @qstokkink does anyone have any ideas what might cause this?
vandenheuvel
on 25 Jan 2017
@vandenheuvel Assuming all libtorrent versions are the same etc.: the only way Tribler interfaces with a libtorrent download is by retrieving its stats every second (handle.stats()) and by handling alerts.
After writing that I found this in the libtorrent manual:
Note
these calls are potentially expensive and won't scale well with lots of torrents. If you're concerned
about performance, consider using post_torrent_updates() instead.
Even though this _shouldn't_ be that bad, you could try and write a loop which gets the torrent handle status every second on your naked experiment and see how that affects things
qstokkink
on 26 Jan 2017
@vandenheuvel in addition, we are also processing all libtorrent alerts every second but I don't think this leads to much overhead actually. Could you try to disable the alert processing (by commenting out this line: https://github.com/Tribler/tribler/blob/devel/Tribler/Core/Libtorrent/LibtorrentMgr.py#L72)?
 devos50
on 26 Jan 2017
devos50
on 26 Jan 2017
Very impressive work guys:
| | libtorrent | Tribler |
| ---|:---:|:---:|
no latency | ~160 MB/s | 30 - 100 MB/s |
200 ms | ~15 MB/s | ~2.5 MB/s |
200 ms + magic | ~35 MB/s | ~2.5 MB/s |
Tribler shamefully collapses. Clearly something to dive into! Did the tip of fully disabling the stats+perhaps 5 second stats sampling lead to any results? btw, can you also expand this Tribler pain table with 10, 25, and 75ms latency data points?
synctext
on 1 Feb 2017
Our test results show a download speed of ~2.5 MB/s at 200 ms with our plain script as well, when we introduce the EPoll reactor into the code. This is similar to the results found in the previous tests with Tribler. However, tests with our plain script and Select reactor shows the original results that we have retrieved before introducing the reactor or even higher: a top speed of 30 MB/s.
The next thing on our list is testing Tribler through twisted with the Select reactor.
MaxVanDeursen
on 13 Feb 2017
Interesting. Could you also try the normal Poll reactor (it is supposed to be faster than Select for large socket counts)?
qstokkink
on 13 Feb 2017
Strange enough, results are quite different between our script and Tribler. Summary:
| | EPollReactor | SelectReactor | PollReactor |
-- |:-------------------:|:-------------------:|:-----------------:|
script | 2.5 MB/s | 32 MB/s | 16 MB/s |
Tribler | 2.5 MB/s | 2.5 MB/s | 2.5 MB/s |
It may take a little while for the download to come up to speed (~ 60 seconds), but after that the throughput is quite steady.
Our next step will be profiling.
vandenheuvel
on 13 Feb 2017
32MByte / sec. So.. Python3 and 200ms latency results. This facinating mistery deepens.
Please make a profile print with human readable threadname printouts
synctext
on 14 Feb 2017
We just ran our script under both python2.7 and python3.5, this made no difference for the SelectReactor.
vandenheuvel
on 14 Feb 2017
Due to an update for lxc our test results have changed drastically. The newest test results, using a latency of 200 ms except otherwise mentioned are:
| |No Reactor without delay | No Reactor |
|-|:-:|:-:|
|Script|~400 MB/s|~32 MB/s|
All the below results are created by a modified script as well (200 ms):
| |EPollReactor|SelectReactor|PollReactor|
|-|:-:|:-:|:-:|
|Inactive|~32 MB/s|~16 MB/s|~16 MB/s|
|Semi-Active|~32 MB/s|~16 MB/s | ~16 MB/s|
Notes:
- The
EPollReactorandPollReactoronly reach their speed after a certain period of time.
MaxVanDeursen
on 15 Feb 2017
hmmm. so the lower non-script table is all Tribler?
synctext
on 15 Feb 2017
In the above post, all results are our own script. We retested everything non-Tribler. We're not sure what this change of results (especially the No Reactor without delay peek performance and EPollReactor results) tells us about the quality of current testing method... These changes are enormous.
vandenheuvel
on 16 Feb 2017
| | EPollReactor | SelectReactor | PollReactor |
|:-|:-:|:-:|:-:|
| Tribler 0 ms | ~100 MB/s | ~130 MB/s | ~80 MB/s |
| Tribler 200 ms | 2.5 MB/s | 2.5 MB/s | 2.5 MB/s |
PollReactor without latency was varying wildly, the other measurements were steady. Sadly these results agree with previous results, before the LXC update. We will now try to bring our script and Tribler closer together by using the reactor thread to start libtorrent in our script.
vandenheuvel
on 18 Feb 2017
impressive exploration.
Good steps to the final goal: Tribler becomes latency tolerant, add big buffer, and remix anon tunnel packets.
synctext
on 18 Feb 2017
_please read_
Two Cents for Strong Anonymity: The Anonymous Post-office Protocol "AnonPoP offers strong anonymity against strong, globally eavesdropping adversaries, that may also control multiple AnonPoP’s servers,even allbut-one servers in a mix-cascade."
synctext
on 28 Feb 2017
Todays conclusion: Tribler drops factor 40 in performance when latency is added between single seeder, single downloader (tested with 4GByte file and 200ms latency). Factor 25 drop with pure Libtorrent plus Twisted (no Tribler) when latency is added there.
Tribler magically can start libtorrent from Twisted, however this fails to be reproducible.
Feedback from Twisted developer and contact with Arvid: http://twistedmatrix.com/trac/ticket/9044 http://stackoverflow.com/questions/42351473/using-libtorrent-session-with-twisted-stuck-on-checking-resume-data
ToDo: refactor the core.libtorrent package.
Next possible step: performance regression suite (#1287, but _not_ now please)
Factor 25-40 stuff is essential
synctext
on 2 Mar 2017
@captain-coder
remarked that touching Python at all from non-Twisted thread will cause trouble. Possibly the thing you see.
synctext
on 2 Mar 2017
@synctext @Captain-Coder What exactly do you mean by that?
vandenheuvel
on 2 Mar 2017
@synctext butchered what I said to him.
He described the problem: as starting an OS thread in process, having that thread talk to libtorrent, and hosting python in the same process to do "stuff". Where I remarked that as soon as the python bindings for libtorrent are loaded into this process (which happens pretty quickly if you import/use/touch Tribler in the hosted python instance) it might induce a situation where python structures are modified, through callbacks/pointers from libtorrent, initiated from the native OS thread. This violates the properties that the python GIL is trying to impose and has a good chance of tripping up the python interpreter (or even worse, silently corrupting it).
But it's also possible synctext described the problem wrong.
 Captain-Coder
on 3 Mar 2017
Captain-Coder
on 3 Mar 2017
@vandenheuvel @MaxVanDeursen I just fixed the problem in your twisted branch. Now the leecher/seeder is no longer stuck in CHECKING_RESUME_DATA. The fix is:
    def printSpeed(h):
        for alert in ses.pop_alerts():
            status = h.status()
            print 'seeder', status.state, status.progress, alert
You can set the alerts using session.set_alert_mask. I guess you should be using alerts until the problem is fixed in libtorrent/twisted.
 egbertbouman
on 3 Mar 2017
egbertbouman
on 3 Mar 2017
@egbertbouman Wow... Thanks a lot for that! How did you come to this solution? And do you happen to know why this works?
MaxVanDeursen
on 3 Mar 2017
@MaxVanDeursen You're welcome! Since libtorrent worked in Tribler, I just looked for the differences between the Tribler implementation and yours. I have no idea why this works.
egbertbouman
on 6 Mar 2017
Thanks to @egbertbouman we have some new results.
| | EPollReactor | SelectReactor | PollReactor |
|:-|:-:|:-:|:-:|
| Script, starting session with Twisted 0 ms | ~400 MB/s | ~400 MB/s | ~400 MB/s |
| Script, starting session with Twisted 200 ms | 32 MB/s | 16 MB/s | 16 MB/s |
We conclude that it doesn't matter which thread starts the session. We will start rewriting the Core.Libtorrent package now: this way we can learn more about how Tribler interacts with libtorrent and hopefully discover why Tribler is so slow.
vandenheuvel
on 6 Mar 2017
We did some profiling and found that under both the EPollReactor and the SelectReactor, close to 100% of the time was spent blocking in the poll of the reactors. This seemed normal as Tribler was basically idle during these tests (except for downloading using Libtorrent at ~2.5 MB/s).
vandenheuvel
on 6 Mar 2017
Yesterday, I spent some time testing Tribler vs libtorrent. I used Ubuntu 16.10 in virtualbox. For libtorrent only I got:

Then, I changed the code in the master branch to work with Tribler and got this:

Finally. I removed the flags keyword parameter from ltsession = lt.session(lt.fingerprint(*fingerprint), flags=1), and like magic:

The difference seems to be that Tribler is not loading some of the default libtorrent features (like UPnP, NAT-PMP, LSD). Very strange...
egbertbouman
on 8 Mar 2017
@egbertbouman Thanks for these hopeful results! Unfortunately, we have not been able to reproduce your results on our own system. However, we have noticed that using this flag in our basic script, the throughput of the program is negatively impacted to 2.5MB/s as well. We will look further into why the removal of this flag does not result in a change of throughput for us, although you have shown that this can be done.
MaxVanDeursen
on 8 Mar 2017
so uTP is enabled, but lt.fingerprint(*fingerprint), flags=1 what does that do?
synctext
on 8 Mar 2017
@synctext From the Libtorrent Manual:
If the fingerprint in the first overload is omited, the client will get a default fingerprint stating the version of libtorrent. The fingerprint is a short string that will be used in the peer-id to identify the client and the client's version ... The flags paramater can be used to start default features (upnp & nat-pmp) and default plugins (ut_metadata, ut_pex and smart_ban). The default is to start those things. If you do not want them to start, pass 0 as the flags parameter.
MaxVanDeursen
on 8 Mar 2017
After the results of last week we decided to do exhaustive tests on all combinations of our script and Tribler, as well with and without flags.
Seeder has different script than downloader in table below. Diagonal is equal code. All have 200ms latency.
| Leecher \ Seeder | Script NoFlag | Tribler NoFlag| Tribler Flag| Script Flag |
| - | - | - | - | - |
| Script NoFlag | H | L | H | L |
| Tribler NoFlag | L | L | L | L |
| Tribler Flag | L | L | L | L |
| Script Flag | L | L | L | L |
L(ow): convergence of download speed at the rate of ~2.5MB/s
H(igh): convergence of download speed at the rate way above 2.5MB/s (i.e. >10MB/s)
From these results there is nothing in plain sight that we can conclude as far as the usage of this flag goes.
MaxVanDeursen
on 13 Mar 2017

Please consider at some point to open up the magic box and dive into these detailed networking statistics. Something is off...
synctext
on 14 Mar 2017
Key problem: discover why Tribler has 2.5 MByte/sec performance with 200ms seeder-leecher latency, and clean Twisted-wrapped Libtorrent has 16MByte/sec.
The methodology is to strip the Python wrapping code and use a methodology of stumbling upon success. Need to be realistic and systematically do a brute-force exploration why it doesn't work. Finding the magic fix directly is not realistic at this point. Stripped Libtorrent manager now 40 lines of code, still 2.5 MByte/sec. Dispersy is off in Tribler.
Is it the database that blocks the whole Twisted thread for 25ms regularly?
synctext
on 22 Mar 2017
possible experiment to decide if the bottleneck is within the code or parameter settings or both:
- Tribler stripped Libtorrent manager, which can only resume download
- Libtorrent manager in clean Python, fast
- Pauzed torrent, parameters created by Tribler, slow
- Pauzed torrent, parameters created by Libtorrent clean code, fast
Mix and match both ways to see where the fault lies...
synctext
on 26 Apr 2017
I just read through (most) of this thread. Here are some observations:
the libtorrent python bindings never call back into python from within libtorrent. Early versions attempted to do this, by supporting python extensions. This turned to cause subtle memory corruption or GIL deadlocks. So, libtorrent is not supposed to interact with python other than through the direct API calls. (so, if you find anything like that, please report a bug!)
libtorrent has built-in instrumentation added specifically to troubleshoot performance issues. In versions before 1.1 it's a build switch (
TORRENT_STATS), in 1.1 and later the stats are reported as an alert (which is disabled by default). If these alerts are printed to a log, it can be analyzed bytools/parse_session_stats.pyin the libtorrent repo (that script exists pre 1.1 too, but loads the files produced by libtorrent. The gotcha is that the stats files are written to CWD, which needs to be writable by the process). The script requiresgnuplotand will render a number of graphs and hook them up to an html page. Looking at them may reveal something.The meaning of the flags passed to the
sessionconstructor are defined here. By default both flags are set (add_default_pluginsandstart_default_features). By passing in 1, you just add the plugins, without starting DHT, UPnP, NAT-PMP and local peer discovery.
I also have some questions:
Are you testing with TCP or uTP? The uTP implementation in libtorrent could be made to perform better on linux by using
sendmmsg()andrecvmmsg(), but currently it requires a system call per packet sent or received.which version of libtorrent are you using? If you're on 1.1.x, one way to have more control over how the session is set up is to use the constructor that takes a
settings_pack. This lets you setup the configuration before starting the session.Is the main issue you're looking at the performance difference between your twisted wrapper and Tribler? Or are you looking at understanding the bottlenecks making the 200ms case have so much lower throughput than the 0 ms case? If the latter, would it be useful to you if I would whip up a one-to-one test transfer simulation with various latencies?
 arvidn
on 3 May 2017
arvidn
on 3 May 2017
@arvidn Thanks a lot for these points! You can have a look at our code here.
We're using the latest version in the Ubuntu repositories. Note that we're only trying to explain the difference in performance between Tribler and our script. Thus, calls like sendmmsg() and recvmmsg() don't seem that relevant as we're not doing these calls (explicitly) in our fast script.
Using settings_pack's might be helpful, but right now we're trying to replicate Tribler's settings in our script to achieve the same performance. @MaxVanDeursen maybe we should just refactor Tribler's code to use settings_pack's as a first libtorrent refactor step and hope that performance improves?
Yes, we're looking to explain this difference under the condition of 200 ms, as the difference becomes larger (from 4x to 8x using default settings) with respect to the 0 ms case. This latency (and above) is relevant for tunnel community performance, as we suspect this is the current bottleneck.
For our script (at 200 ms), we already know what the bottleneck is: buffer sizes (see above). Right now, we believe it is most probable that this has to do with settings passed to libtorrent either in creating the libtorrent session or adding a torrent.
vandenheuvel
on 3 May 2017
Report can be found at overleaf.
vandenheuvel
on 22 May 2017
do you have any (verbose) libtorrent logs from those test runs where the download did not start for a long time, or did not reach the max throughput for a long time? I would be interested in looking at them in that case.
also, if you're not using a sufficiently recent version of libtorrent, you may be experiencing this.
arvidn
on 22 May 2017
@arvidn Sadly, we do not have any libtorrent logs whatsoever of this occurrence. However, if you would like to reproduce the error, you could look into our libtorrent latency benchmark before the pop_alert fix was implemented in order to get the logs.
afaik we used the last libtorrent version
MaxVanDeursen
on 24 May 2017
Golden experiment:
- Select 1 torrent for this experiment
- Create Pauzed torrent, parameters created by Tribler, slow
- Create Pauzed torrent, parameters created by Libtorrent clean code, fast
- Now take a pauzed Tribler torrent, and resume it within the potentially fast Libtorrent clean codebase.
- Magic happens: is it a setting problem or not?
- Other way around, will Tribler slow down pauzed fast torrents?
synctext
on 8 Jun 2017
Assign me!
 ichorid
on 17 Jan 2018
ichorid
on 17 Jan 2018
@ichorid Good luck! If you have any questions, please reach out to either @MaxVanDeursen or me.
vandenheuvel
on 17 Jan 2018
Mental note..one month spend on making unit tests faster would most likely be well spend..potential next optimization task.
synctext
on 24 Jan 2018
@synctext I assume you refer to our 'heavy' tests to test the correct working of anonymous downloading/hidden seeding (since most of our other unit tests are very fast)? I don't see any simple optimisations for these tests since the tunnel community relies heavily on Dispersy and the testing framework of Dispersy is a pain to work with and very slow. Instead, I would wait for IPV8 to be integrated in Tribler and use the IPV8 functionality to test the tunnel community. And create a stable integration test of anonymous downloading/hidden seeding. IIRC, @qstokkink already has a few tests for the tunnel community in IPV8 that run within milliseconds but don't pin me on that.
devos50
on 24 Jan 2018
Thank you for that vital info. post-ipv8 then..So we can work towards 60Second full unit tests runtime...
synctext
on 24 Jan 2018
Correct: all of the tunnel unit tests (including the full end-2-end hidden seeding test) are completed within 2 seconds.
qstokkink
on 24 Jan 2018
This is not only a problem of performance, but bad code quality. The download settings and their defaults are not defined in a single place. The statement is that this bug could have been found in a day, with good code. Instead, we have technical depth.
Start of rewrite by Bram: no longer contains this silly LaunchManyCores things
Vadim status:
- gladly takes the job of making beautiful code from 12 year old code which wraps Libtorrent
- latest stage not in github yet
- patches done to original container.sh etc matters
- we have already a faster way to run these XLC container tests now.
- XLC container template, one for leechers and seeders
- feature to avoid long time to setup LXC, use snapshot; instead of setup everything from the sources (buggy, but fixed)
- 200ms latency with clean Libtorrent reproduced
synctext
on 30 Jan 2018
Unstable download speeds with libtorrent:
When you run LXC-based latency tests for a single latency repeatedly, i.e. by setting
latencies = [0 for x in range(numIntervals)]
or by completely commenting out latency setting lines (tc ...), you don't get repeatable results. The first test run is always much faster than the subsequent ones, but sometimes you could randomly get high results in one of those too.

This means several things:
- Our previous measurements were wrong, as they were affected by this.
- There is a bug/unstable behaviour in either one or several of:
2.1 Ubuntu 17.10 networking;
2.2 LXC 2.1.0;
2.3 python3-libtorrent 1.0.7-1build1 (libtorrent-rasterbar8);
2.4 Our setup/handling of libtorrent session; - There could be potential to greatly speed up downloads in tribler and other libtorrent-based clients.
As this could have serious consequences, I invite any interested parties to recheck my results, just in case ;-)
(Experiment conditions: host Ubuntu 17.10; LXC containers Ubuntu 16.04 (default))
ichorid
on 2 Feb 2018
The same plot (libtorrent) for 200ms:

ichorid
on 2 Feb 2018
Does this behavior persist with the latest version of LibTorrent (1.1.7 I believe)?
qstokkink
on 2 Feb 2018
do these tests pin down whether TCP or uTP is used? One aspect I can imagine might affect this, is if the startup of the swarm is somewhat random, the first connection attempt (over uTP, which is preferred) fails sometimes and sometimes suceeds. With a failed uTP connection attempt, libtorrent will try TCP. Hence, unless the test explicitly disables one or the other, the protocol that ends up being used is probably somewhat random.
If I would be interested in exploring whether this variance is primarily caused by libtorrent, how hard would it be for me to reproduce these tests? is there a guide somewhere?
it's possible libtorrent-1.0.x is too old, but at least 1.1 and later has session stats counters that can be reported via an alert, enabled by the alert mask. Logging this for the peers could give a hint of what libtorrent is experiencing.
are these tests one-to-one transfers, or is it a single swarm of 10 peers? (if it's one-to-one, the logging should be manageable).
arvidn
on 2 Feb 2018
Thnx Arvid for this again insightful comment. Its really a moral boost for the team that you're helping us out.
V: Please link your XLC scripts here for reproduction.
synctext
on 2 Feb 2018
@arvidn, the tests use default configuration of libtorrent, and the version is that available in the Ubuntu LXC container. Thanks to @vandenheuvel and guys it is very easy to reproduce the experiment. You could use Ubuntu VM, or try to run it in your environment. The whole test should be run as root. In Ubuntu you could do just something like:
sudo su
apt-get install lxc ctorrent python3-numpy python3-matplotlib
cd /tmp
git clone https://github.com/vandenheuvel/libtorrent-latency-benchmark
cd libtorrent-latency-benchmark
./main.sh
open ./result.png
And if it works, you could change the latency setting in leecher.py to
latencies = [0 for x in range(numIntervals)] (the plot legend would still show 50ms steps, don't take that into account).
My next step would be to test the thing with the newest libtorrent version. To do that, I would first need to complete a small refactoring of these tests.
As I am not very familiar with libtorrent, could you please provide a "UDP-KISS" set of settings, that would turn off all adaptive features of libtorrent, like congestion control, auto-switching between UDP and TCP, etc.?
ichorid
on 2 Feb 2018
I haven't gotten around to setting up an ubuntu VM to run this in. But I have some comments anyway:
If
netem(thetccommand) works on the loopback device, your setup could be simplified to not require any containers. You could just set the latency onlo0and make each instance bind to IPs 127.0.0.1 - 127.x.x.x, however many nodes you're running. The main benefit would be to shave off overhead and moving parts, to make sure you're not just measuring the performance (or variance) of the virtualization layer. If this approach fails, you could still make them all bind to 127.0.0.1, and make sure to enable theallow_multiple_connections_per_ipsetting.In the loop that collects data during a transfer, you log
download_ratefromtorrent_status. You would get better accuracy by measuring thetotal_download[1] instead. The download rate is fuzzy, it's basically the average download rate from the last few seconds. If you take a rate sample every second, they won't necessarily sum to the total downloaded bytes. Instead capture the downloaded bytes together with a timestamp.To disable uTP, set
enable_outgoing_utpandenable_incoming_utp[2] to false.To disable DHT, Local peer discovery, UPnP, NAT-PMP, peer exchange, ut_metadata (magnet links) and smart_ban, you can set the flags argument to the session constructor to 0:
session(flags=0)(at least I think that works in python).some settings that are relevant for a high bandwidth-delay-product test are the
send_buffer_*[3] settings.If you suspect the cost of disk reads/writes start to dominate the test (which I would expect to be the case, as long as everything else works as it should). You may want to disable disk I/O. You can do that by setting
disable_hash_checks[4] to true, and... hm. there's no way to set theadd_torrent_params::storagetodisabled_storage_constructorfrom python.. Anyway, with disk I/O disabled, you don't really need the underlying data for the torrent either, you can just pretend to have it by setting one torrent toseed_mode(inadd_torrent_params)
arvidn
on 4 Feb 2018
No need for containers even.. All sounds like solid suggestions to work on.
@egbertbouman Can you also help out if needed today.
synctext
on 5 Feb 2018
@arvidn, thanks for suggesstions! Will now try to play with the settings and report back as soon as something interesting turns up.
ichorid
on 5 Feb 2018
Starting libtorrent session with
session(flaqs = 0)
enable_incoming_tcp = 0
enable_outgoing_tcp = 0
at 0ms latency produces relatively stable results that max out at 80 Mb/s:

When running without flags = 0, like
session()
enable_incoming_tcp = 0
enable_outgoing_tcp = 0
the first download is 2 times faster than the remaining ones, maxing out at 150 Mb/s, and there is a pattern of "fast" downloads with slowly capping top speeds:

For 100ms with flags=0 this effect produces semi-stable 5Mb/s:

But without flags=0 it nets a first download with immediate 30 Mb/s, and then for all remaining downloads it first drops to semi-stable 5 Mb/s, and after around 60 seconds of this magically ramps up 30 Mb/s:

(The settings were set equal on both leecher and seeder.)
Even with flags=0 enabled, after the first download, the sessions sometimes become "stuck" at random for a brief moment. Apparently, this is the effect that produces "waves" in the plot.
To me, it seems like something related to congestion control, or memory management. Previous experiments with Tribler-based downloads showed a similiar pattern, but without ramping up to full speed. I suspect that when Tribler meets latency, some congestion-handling feature in libtorrent just doesn't fire up.
@arvidn, what kind of feature in libtorrent could cause such performance spike/waves? (I am using python3-libtorrent 1.0.7-1build1 (libtorrent-rasterbar8) from Ubuntu 17.10)
ichorid
on 5 Feb 2018
the stall in the last run looks like they got stuck checking files or something. and if the first connection attempt fails, there may be a delay before trying again.
I would like to stress again that download_rate is a lie. The shapes of your graphs suggests that that's what your plotting. I would highly recommend measuring the time and total_download instead. instead of sleeping for one second and then assume it's been a second, check the time again and print it to your csv file for the plot. when you run benchmarks where the computer is very busy, your delays are increasingly likely to be longer than you ask for.
The best way of knowing for sure is to enable and log the session_stats counters (there's a tool parse_session_stats.py to generate plots from it too)
arvidn
on 5 Feb 2018
Here are the plots of download progress produced with the method suggested by @arvidn (total_download with timestamps). The charts are for the same experiments as in the previous series:
0 ms session(flaqs = 0)

0 ms session()

100 ms session(flags = 0)

100 ms session()

The slope of the lines corresponds to download speed. We can still see the basic problem pattern from the previous plots. In addition, the small freezes become apparent.
Please mind the automatic scaling done by the pyplot (i.e. the horizontal and vertical scale are different for each plot).
ichorid
on 6 Feb 2018
Facinating. To efficiently zoom into a solution for Tribler issues, please do experiments with 200ms latency and latest binary released.deb package of Libtorrent. Having 80MByte/sec would be awesome. We have 2.5 MByte/sec merely.
synctext
on 6 Feb 2018
Clean Twisted-wrapped Libtorrent has 16 MByte/sec. You are very likely seeing another performance bottleneck then Tribler.
synctext
on 6 Feb 2018
@arvidn, now I'm working on adding proper Tribler-based tests to this experiment. If Tribler-based results at 200ms would match the libtorrent with flags=0, that would mean some magic extension in libtorrent that allows it to show good performance under big latencies does not fire up within Tribler. This fact would let me narrow it down to a single flag or combination of them in libtorrent-based test alone, to trace it in Tribler later.
In addition, that would mean something in core libtorrent and/or python bindings produces an unexpected and unnecessary long delay before the lib could again reach the top performance.
(I'm going to do the tests with latest stable libtorrent built from source (1.6))
ichorid
on 8 Feb 2018
great, 1.1.6 is good. A more direct approach to understanding a throughput bottleneck would be to post session stats counters regularly and log them to a file. That's basically what they're for.
experimenting with various flags is also a good idea, especially to discover unexpected side-effects. But I would primarily imagine you're seeing second or third order effects of the flags.
For example, tracker announces may be held off until UPnP or NAT-PMP has succeeded, in order to get an accurate external port to announce, if neither of those work, there may be some unnecessary delays on startup. I don't think this specific issue affect you, since you don't rely on a tracker, but there may be other effects of that nature you're seeing the effects of.
arvidn
on 8 Feb 2018
@arvidn, basically, how does python bindings for libtorrent work? What does and what does not kept between libtorrent sessions? And how could I be sure that the underlying objects are really deleted, sockets closed, etc.?
For example, when I create a libtorrent session object in Python:
import libtorrent as lt
def mkses():
    ses = lt.session()
    sleep (5)
    print ses
for i in range(3):
    mkses()
what state these three session objects would share/inherit from predecessors?
ichorid
on 8 Feb 2018
each session object you construct is independent. There's no invisible state they share (other than the usual, filesystem, network interfaces etc.)
They will all open listen sockets independently, two will fail to bind because the third got the port first, they may bump the port and try again and so on (that's configurable and enabled by default).
about when they are destructed, I believe that's up to the python GC. Aren't objects reference counted in python though? so you should get consistent and reliable destruction. otherwise you may be able to use del.
did I understand you question?
arvidn
on 9 Feb 2018
I also found the strange pauses in throughput today when analyzing the tunnel integration tests with @devos50. These are the outputs of three seperate runs sending a 2.06 MB file, plotting all the libtorrent data going through the tunnels:


In the last run there was no throughput pause at all. Hope this helps @ichorid 👍
qstokkink
on 11 Feb 2018
@arvidn, yes, your answer was exactly about the things I was interested in. Thank you 👍 .
Now, the preliminary results from testing Tribler-based download. The leecher used a single session of Tribler, and the seeder was libtorrent-based.
Distro: Ubuntu 17.10 (lxc)
libtorrent: 1.1.6 (stable source tarball from official site)
tribler: 7.0 (stable source tarball from official site)
Tribler config lines:
config = SessionStartupConfig()
config.set_state_dir(os.path.join(os.getcwd(), '.tribler'))
config.set_torrent_checking(False)
config.set_multicast_local_peer_discovery(False)
config.set_megacache(False)
config.set_dispersy(False)
config.set_mainline_dht(False)
config.set_torrent_store(False)
config.set_enable_torrent_search(False)
config.set_enable_channel_search(False)
config.set_torrent_collecting(False)
config.set_libtorrent(True)
config.set_dht_torrent_collecting(False)
config.set_videoserver_enabled(False)
config.set_enable_metadata(False)
config.set_http_api_enabled(False)
config.set_tunnel_community_enabled(False)
config.set_creditmining_enable(False)
config.set_enable_multichain(False)
seeder config (libtorrent-based, flags=0):
ses = lt.session(flags=0)
ses.enable_incoming_tcp=0
ses.enable_outgoing_tcp=0
0 ms

100 ms

We see roughly the same performance as from the pure libtorrent with flags=0. Therefore, we could assume the flags to be the main suspect. Another important thing to note is that Tribler session sometimes introduces an additional delay of 60 seconds. This looks similar to the pattern of libtorrent getting up to speed after 60 seconds that we've seen in previous tests for 100ms with default flags. This gives us a hint that some subsystem in libtorrent just does not start properly in Tribler and is sub-optimally initialized in pure libtorrent-based tests.
Next, I will check the "seeder vs leecher" problem. After that I will commit the tests framework to Github and continue the investigation by scoring the effects of individual flags.
ichorid
on 12 Feb 2018
@ichorid LibtorrentDownloadImpl will wait with downloading a torrent until the session has found more then 25 DHT nodes (see https://github.com/Tribler/tribler/blob/devel/Tribler/Core/Libtorrent/LibtorrentDownloadImpl.py#L260 and https://github.com/Tribler/tribler/blob/devel/Tribler/Core/Libtorrent/LibtorrentMgr.py#L567). This was introduced as a fix for a previous libtorrent version, but perhaps it's not needed anymore. Anyway, this could be the cause of additional delays when dealing with larger latencies.
egbertbouman
on 12 Feb 2018
When downloading with Tribler at 100ms, changing flags=0 at seeder side does not change the results of the experiment. The delay is still there, speed is still at flags=0 libtorrent baseline.
ichorid
on 13 Feb 2018
Comparison of logs from delayed iterations of tests with undelayed ones showed that delayed ones always produce the following lines:
DEBUG:LibtorrentMgr:LibtorrentMgr: could not find torrent 25283068c8e1470dd82db03994e9b4e7f59087c3
DEBUG:LibtorrentMgr:LibtorrentMgr: could not find torrent 25283068c8e1470dd82db03994e9b4e7f59087c3
Adding sleep (10) between iterations to avoid race condition in libtorrent on session.remove_download(..) resulted in logs without ... could not find torrent ... and plots void of random 60s delay:

Apparently, there is a race condition in tribler and/or libtorrent on session.remove_download(). Further checks with pure libtorrent will follow soon.
ichorid
on 13 Feb 2018
remove_torrent() is an async. Call. It’s not obvious though how add_torrent() could jump ahead of it
arvidn
on 13 Feb 2018
Oh, maybe it’s the other peer trying to connect before it’s been added. Sync. With add_torrent_alert.
arvidn
on 13 Feb 2018
Forked libtorrent-latency-benchmark and added Tribler support, ability to switch between Tribler/libtorrent modes, remove_torrent workaround, compiling libtorrent from source, etc.
libtorrent-latency-benchmark:tribler
ichorid
on 14 Feb 2018
@arvidn, indeed, the libtorrent version actually matters for this problem.
The following plot is for libtorrent 1.0.7 as found in Ubuntu 17.10:

And this one is for libtorrent 1.1.6 compiled from source (the same Ubuntu 17.10):

(The flags option was left to default, the session was restarted for each iteration, and sleep(10) was put between iterations, just in case.)
This means that the latest libtorrent does not get up to high-speed mode except for the first run.
ichorid
on 14 Feb 2018
Setting flags=0 on either side of connection results in "slow mode" download.
Now I'm going to investigate the flags effects on vanilla libtorrent benchmark.
ichorid
on 14 Feb 2018
It's LSD extension. If it is enabled, libtorrent gets to high speeds on high-latency connections.
I have no idea how it could relate to latencies, but 1 minute interval before it kicks in is consistent with LSD specifications.
I'll do more realistic experiments to confirm this.
ichorid
on 14 Feb 2018
OK, I think I got it. The problem is with uTP protocol. When LSD announces, libtorrent switches to TCP (@arvidn, is it really like it should be?) instead of uTP, and becomes much faster. This is because TCP does not care about latencies. And synthetic latencies introduced by netem does not play well with uTP congestion algorithms. Basically, uTP underutilizes the link.
So, in short: in synthetic test environment uTP=slow, TCP=fast.
And TCP-based transport kicks in as a result of LSD announcement (bug?).
enable_incoming/outcoming_udp/tcp flags do not seem to have any effect on this behaviour.
Whether TCP would provide better speeds in real life high-latency environment remains to be investigated.
ichorid
on 14 Feb 2018
@arvidn, how can I control uTP vs TCP usage for individual connections and/or sessions? Is it possible to force the usage of either protocol?
ichorid
on 14 Feb 2018
@ichorid nice find! Could you do something with these settings? https://github.com/Tribler/tribler/blob/next/Tribler/Core/Libtorrent/LibtorrentMgr.py#L139
devos50
on 14 Feb 2018
@arvidn, I suspect this strange behaviour we observe in our tests is the result of three distinct bugs in libtorrent (and/or Python bindings):
- uTP has much worse performance than TCP on high-latency, high-bandwidth links.
- If leecher gets LSD announcement from seeder, it would start the download using TCP. And even if it already is downloading this torrent via uTP, it would switch to TCP.
enable_incoming/outcoming_udp/tcpflags doesn't work.
I would try to re-check the results, to be sure.
ichorid
on 15 Feb 2018
If netem (the tc command) works on the loopback device, your setup could be simplified to not require any containers. You could just set the latency on lo0 and make each instance bind to IPs 127.0.0.1 - 127.x.x.x, however many nodes you're running.
Please replace the containers with loopback idea and boost the send_buffer settings. Try a Tribler-to-Tribler test to see if there is low-hanging fruit to boost our 4 MByte/sec sad performance. Try minimal example where uTP fails to perform OK currently.
With 50MByte/sec and 100ms one-way latency we always have 10 MByte of un-acknowledged data in-flight. Buffers need to be huge. Look at various buffer settings send_socket_buffer_size. Any tips from Sweden?
synctext
on 15 Feb 2018
My bad, I was not setting the settings the right way ((
I'll redo the enable_incoming/outcoming_udp/tcp in a pinch.
ichorid
on 15 Feb 2018
So yeah, enable_incoming/outcoming_udp/tcp flags work. I was wrong on that one. Please, accept my apologies, @arvidn.
ichorid
on 15 Feb 2018
I reproduced the uTP vs TCP performance problem using libtorrent's examples/client_test.
| | TCP | uTP |
|--------|----------|----------|
| 0 ms | 310 Mb/s | 104 Mb/s |
| 100 ms | 30 Mb/s | 5.2 Mb/s |
The tests were run on loopback device, 100ms round-trip latency was added with netem:
tc qdisc add dev lo root netem delay 50ms
To force TCP/uTP on both ends I used -J|-y options.
# in the first terminal
./client_test -b 127.0.0.1 ./test.torrent [-J|-y]

# in the second terminal
./client_test -r 127.0.0.1:6881 [-J|-y]
I have a suspicion that the first result is CPU bound. UDP is significantly less efficient than TCP at high rates, since (traditionally [1]) every single packet needs a system call to be sent and a system call to be received. Since a packet is ~1400 bytes, that ends up being a lot of syscalls, as you can imagine. This can be mitigated somewhat by detecting that the MTU over loopback is actually 64 kiB and send large packets. I had some code to do that for a while, but as I recall, it was a bit flaky. I removed it thinking transferring over loopback isn't an important use case anyway.
I think the second result, with 100ms delay, is much more interesting from the point of view of looking at the effect of real-world transfers over high latency networks. I suspect that in that case, the rate is limited by the send- and receive- buffers configured for libtorrent. There's a setting called send_buffer_watermark which defaults to 500 kiB. Try setting that higher, to 1 or 2 MiB.
You may also want to increase send_socket_buffer_size and recv_socket_buffer_size. They cas the congestion window and advertised receive window in uTP (iirc). They probably need to be at least 1 MiB too.
[1] there is sendmmsg() and recvmmsg() on linux nowadays, and I've been meaning to add support for that to the uTP implementation, but I haven't gotten to it yet (patches are welcome! :) )
arvidn
on 19 Feb 2018
Increasing send_buffer_watermark, send_socket_buffer_size, and recv_socket_buffer_size to 2MiB does not seem to have any effect (or I am doing it wrong). However I added set_utp_stream_logging(1) to client_test.cpp, and #define TORRENT_UTP_LOG_ENABLE to utp_stream.cpp/hpp.
Next I ran the loopback benchmark again, with 100ms round-trip latency. For both seeder and leecher, I parsed the resulting utp.log with parse_utp_log.py, as @arvidn suggested earlier. I hope the produced plots could shed some light on this mystery:
Seeder:


ichorid
on 19 Feb 2018
Leecher:


ichorid
on 19 Feb 2018
TCP makes 30Mb/s over loopback with 100ms latency. That means that on average at any moment there is around 3 Mbytes of data in flight. However, as far as I can understand the plots, uTP thinks the advertised window size to be around 1Mbyte, and it conservatively targets for 400Kbytes window size.
ichorid
on 19 Feb 2018
those are beautiful graphs. I'm used to always seeing some really strange behaviour whenever I look at these. But you can see the slow-start ramp up, hitting the 500 kiB ceiling until the kernel buffer
(presumably) fills up and we get a packet loss, cut the cwnd in half and enter the additive-increase-multiplicative-decrease regime.
The advertised receive window does seem set to 1 MiB and doesn't seem to be a bottleneck, as cwnd never exceeds 500 kiB. This seems to be a problem, if the send buffer size (and not just the receive buffer size) is in fact set to 1 or 2 MiB, it should be allowed to exceed it.
The one-way delay measurements are very low and don't seem to affect the congestion control at all.
The vast majority of packets sent have a reasonable (MTU-like) size.
I'll dig into the code a bit
arvidn
on 19 Feb 2018
@ichorid did you get a graph with send_buffer_size in it as well?
arvidn
on 19 Feb 2018
@arvidn, just've done it. *_buffer_size, etc set to 4 Mbytes.
Seeder:
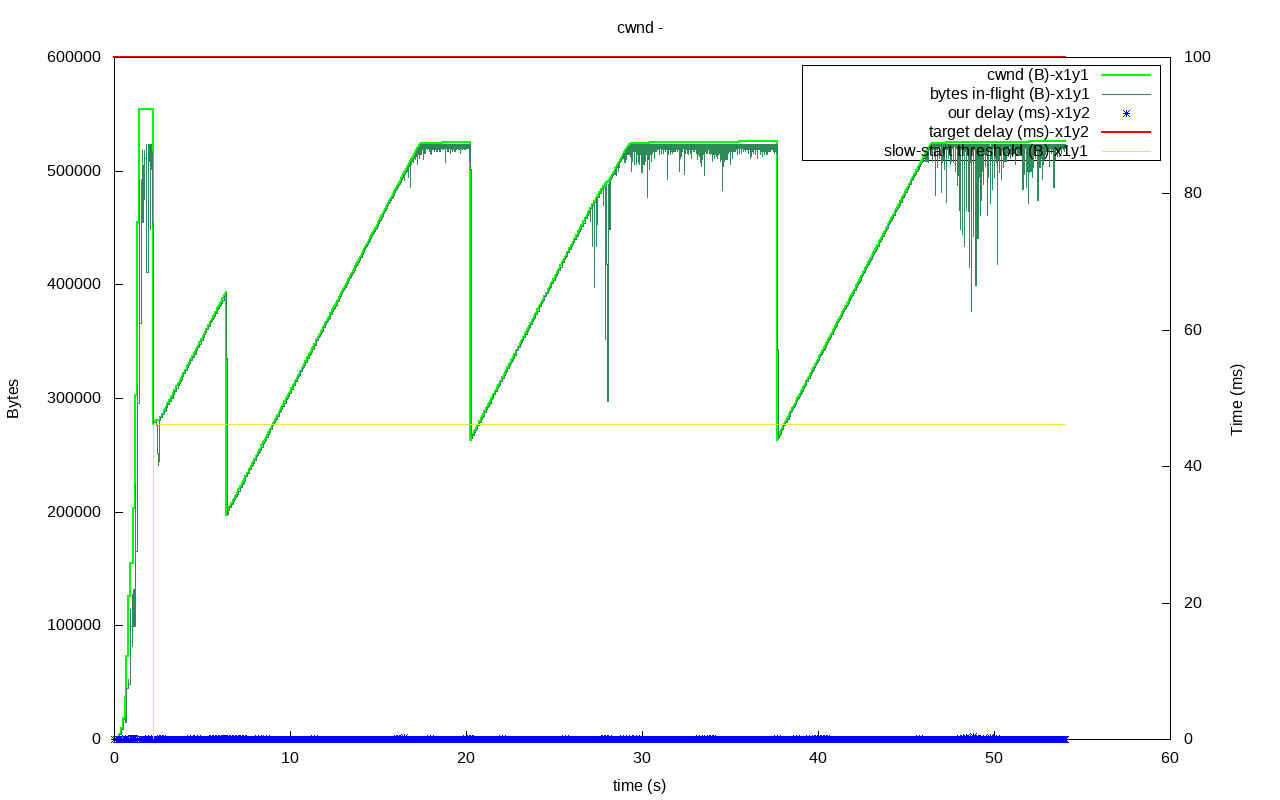
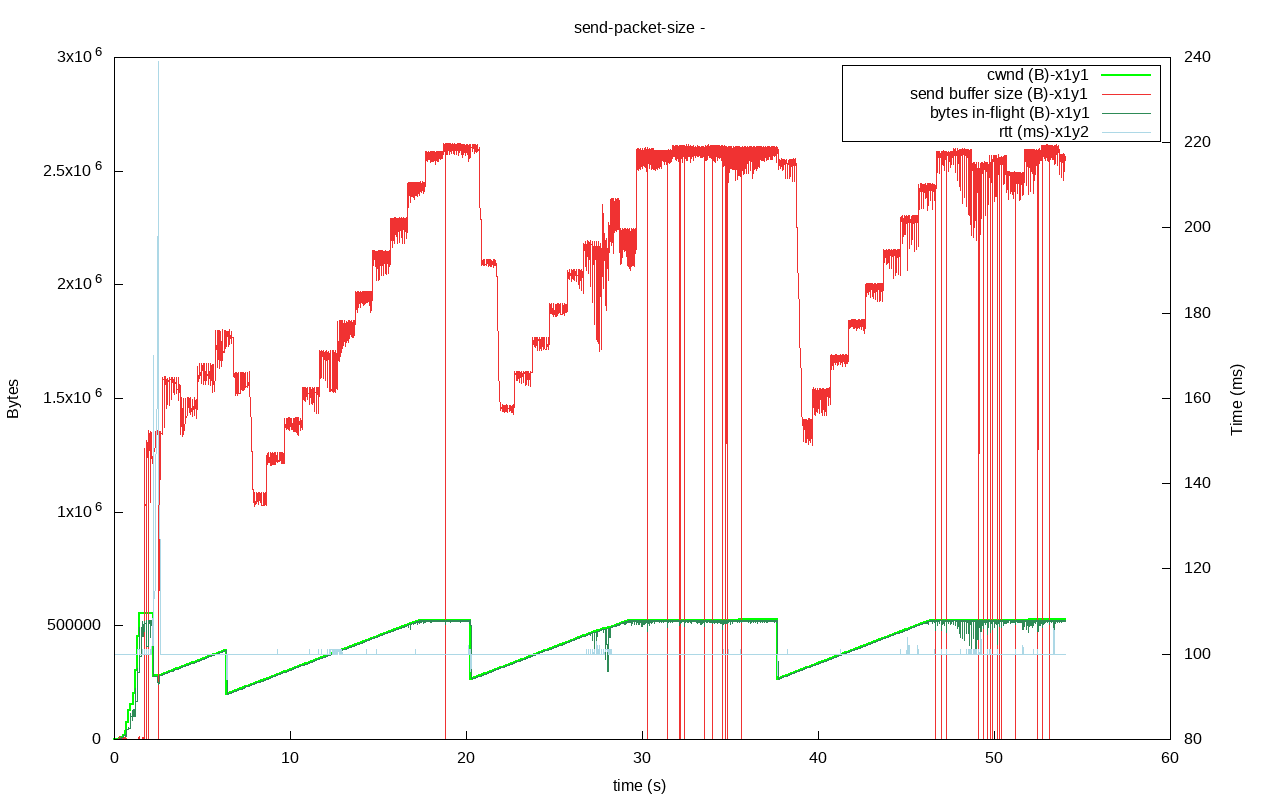
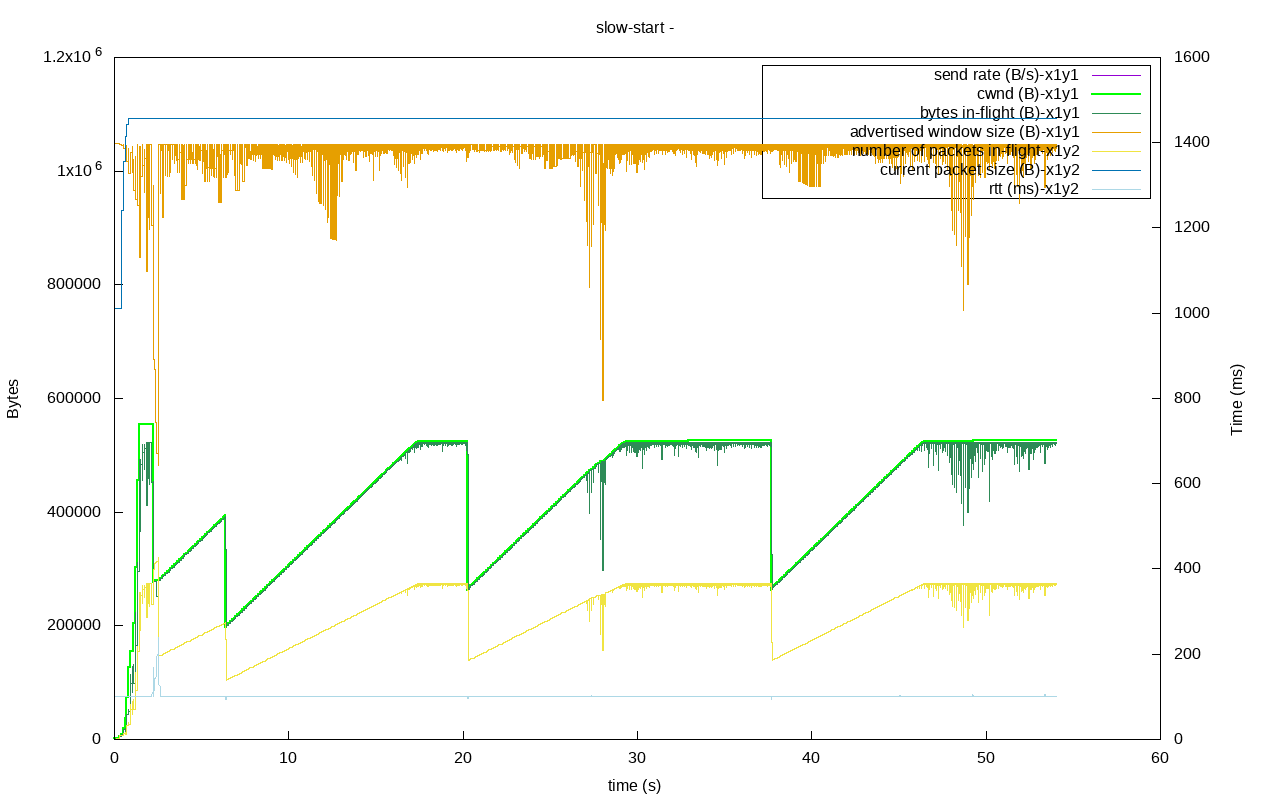
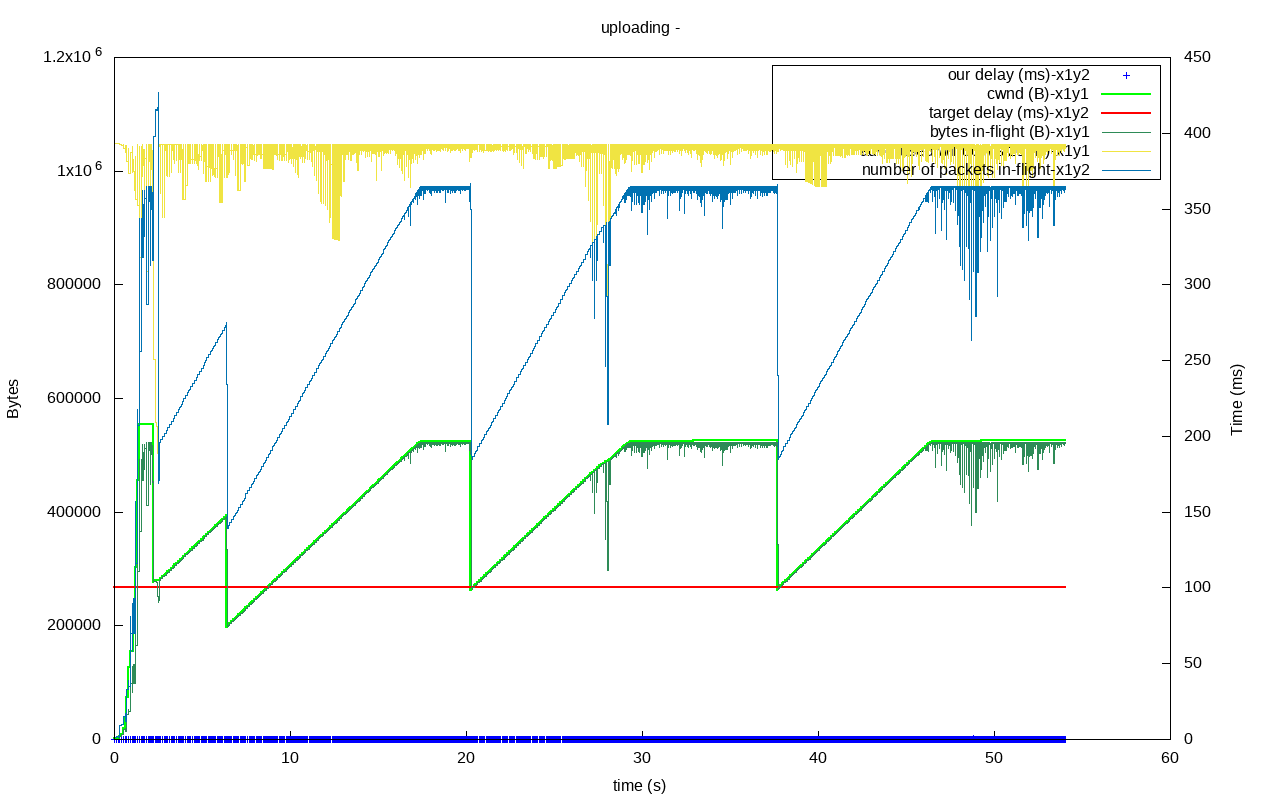
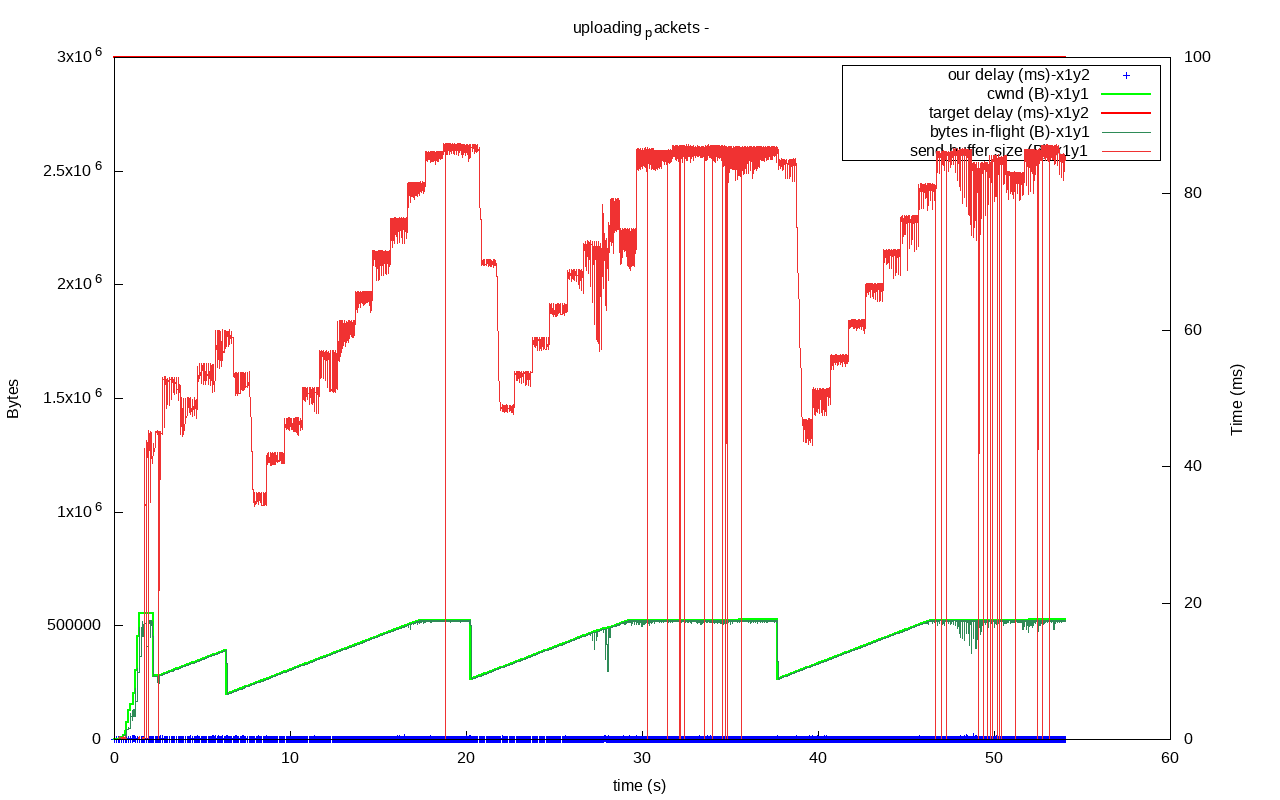
ichorid
on 19 Feb 2018
Leecher:
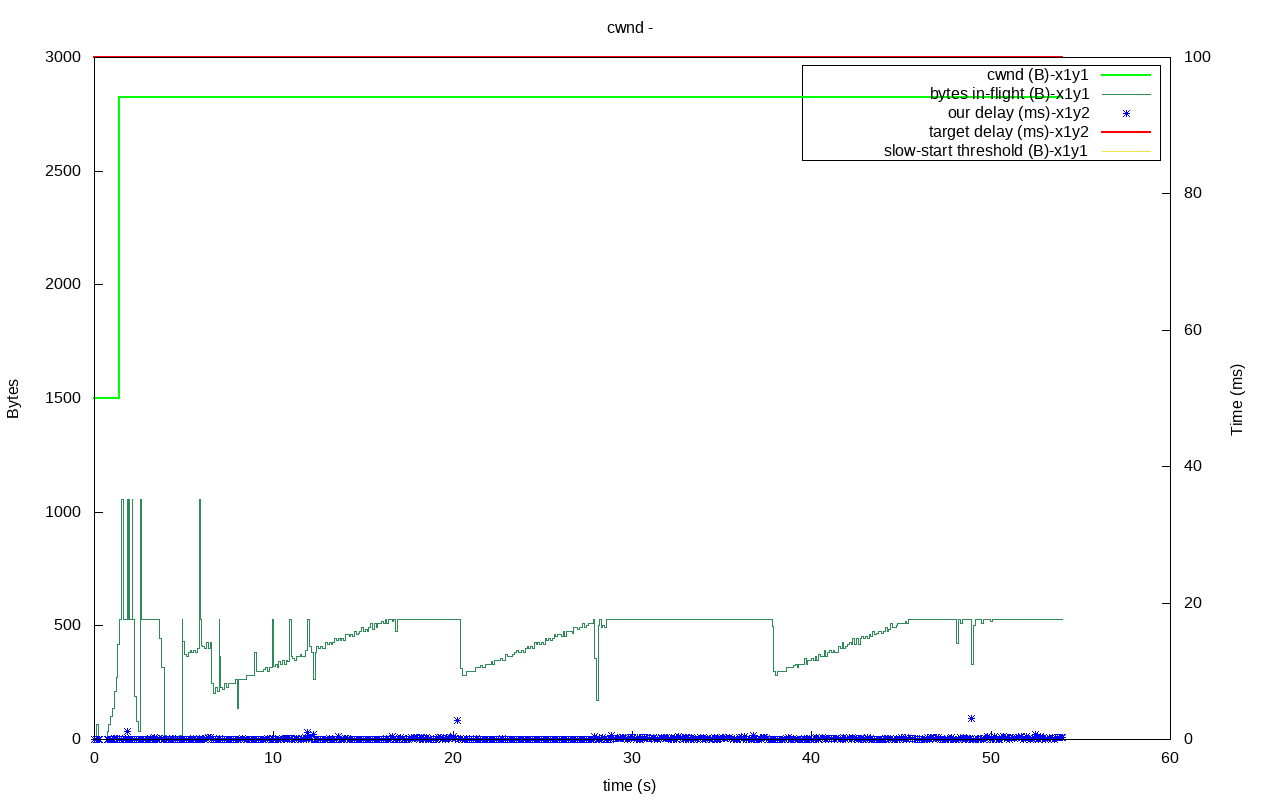
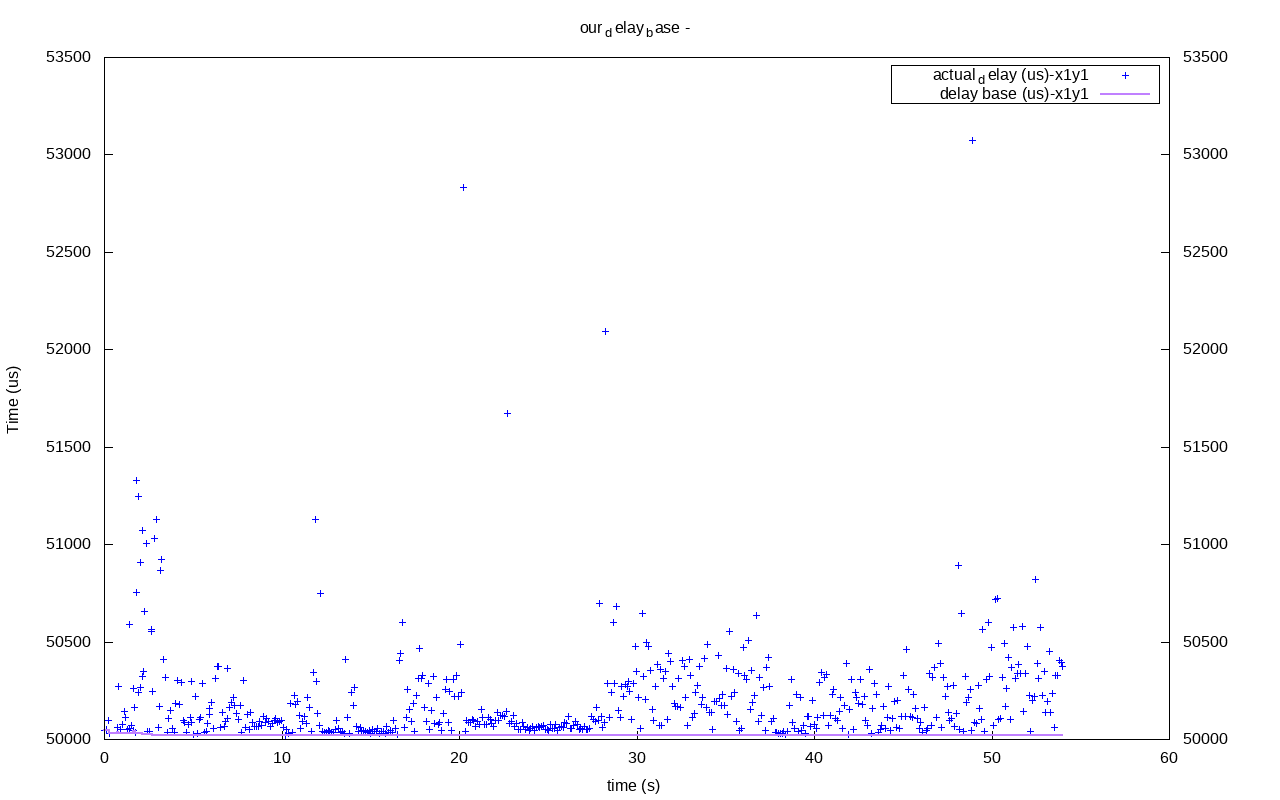

ichorid
on 19 Feb 2018
It looks like sendmsg() is failing, causing those flat-lines. My theory is that netem has an upper limit on its internal buffer, and at sufficiently high rates, with enough delay, the limit is hit and sendmsg() starts to fail. uTP will handle send failures and retry later.
My theory is that netem has a lower limit for UDP than for TCP, or alternatively that its internal storage for UDP packets is larger than for a TCP stream.
My suspicion is supported by this:
https://lists.linuxfoundation.org/pipermail/netem/2007-March/001091.html
as well as this:
https://lists.linux-foundation.org/pipermail/netem/2011-April/001503.html
So, I would suggest you try raising that limit.
arvidn
on 20 Feb 2018
Hmm, now I can't reproduce my last result of TCP 30Mb/s. I guess it could be because I didn't turned off eth0 interface, and didn't disabled all additional features of libtorrent through command line options of client_test when I tested it for the first time...
Anyway, here are the results of 50ms (100ms RTT) tests:
| netem "limit" | TCP Mb/s | uTP Mb/s |
|----------------|----------|----------|
| 1 | 0,65 | ☠☠☠ |
| 10 | 4,5 | 0-0,133 |
| 100 | 4,5 | 0,9-1,4 |
| 250 | 4,5 | 2,0-3,4 |
| 500 | 4.5 | 3,0-5,2 |
| 1000 (default) | 4.5 | 5,2 |
| 10000 | 4,5 | 5,2 |
| 100000 | 4,5 | 5,2 |
#Latency:
tc qdisc add dev lo root netem delay 50ms limit 1000
#Seeder:
/mnt/libtorrent-rasterbar-1.1.6/examples/client_test -7000 ./test.torrent [-y|-J] -X -H -N
#Leecher:
/mnt/libtorrent-rasterbar-1.1.6/examples/client_test -r 127.0.0.1:7000 -b 127.0.0.1  -p 6881 ./test.torrent   [-y|-J] -X -H -N
(buffer sizes in client_test adjusted to 4 Mbytes, uTP logging turned off)
I will redo the TCP/uTP tests for different latencies (one-way and two-way) on both loopback and lxc-containers testing setups.
ichorid
on 20 Feb 2018
Here are bandwidth measurement (MB/s) test results for client_test torrent download/upload between two LXC containers.
"s" - means latency was added only to connections outgoing from seeder;
"l" - for connections outgoing from leecher;
"s+l" - for both.
| latency | TCP (s) | TCP (l) | TCP (s+l) | uTP (s) | uTP (l) | uTP (s+l) |
|------:|:-------:|:-------:|:-------:|:-------:|:-------:|:-------:|
| 50ms | 9,0 | 9,0 | 4,6 | 6-10,4 | 10,4 | 5,2 |
| 100ms | 4,6 | 4,6 | 2,6-8,4 | 5,2 | 5,2 | 2,1-3,0 |
| 200ms | 2,1-6,3 | 1,8-2,7 | 1,0-6,3 | 2,1-3,1 | 2,6 | 1,0-2,1 |
| 400ms | 1,0-6,3 | 1,0-6,3 | 0-6,3 | 1,0-1,4 | 1,0-2,0 | 0-0,05 |
ichorid
on 20 Feb 2018
My theory is that netem has an upper limit on its internal buffer
Nice table of results. Took me 10+ minutes to understand. You explored the buffering in netem! The _limit_ parameter you explored is exactly the size of the buffer. Did you manage to link that parameter to a possible sendmsg() failure?
Complex netem limit parameter discussion
synctext
on 20 Feb 2018
@ichorid great. I would expect both TCP and uTP to behave the same regardless of whether the delay is inbound or out-bound. From a specific end-points point of view, you can't tell the difference.
This assumption is not supported by your results though, since 50ms delay on both uploader and downloader should have the same effect as 100ms at either downloader or uploader. I wonder though if the CPU and memory pressure overhead of running containers and netem could be causing more jitter here.
Is the CPU pegged in all these runs btw? If it isn't, we know that it's not maximising throughput and is waiting on I/O. If CPU isn't pegged, it could be that the disk is the bottleneck. You can disable disk I/O and hash-checking (since you'll just transfer garbage, you have to disable hash checking too) in client_test by passing in -0 -z.
Anyway, unless I'm missing something, the main take-away is still that at 400ms delay, uTO throughput has dropped significantly. I don't think there's an inherent reason for that, and it should be able to do better (at least given send and receive buffers configured higher).
Do you have those nice uTP graphs for this setup, with 400ms delay?
Also, to be extra sure there's no connections being made over any other interfaces, you can pass in an IP filter file to client_test with -x <filename>. It's an emule-style IP filter where each row is a rule of "first-IP-last-IP,<0|1>" where the last 0 or 1 filters the range or not.
arvidn
on 20 Feb 2018
@arvidn, I reproduced the experiment (with added -0 -z) on a much more powerful machine (48 cores double-Xeon), so the base throughput should be much higher.
Here are the plots from seeder side (400ms latency on both sides):
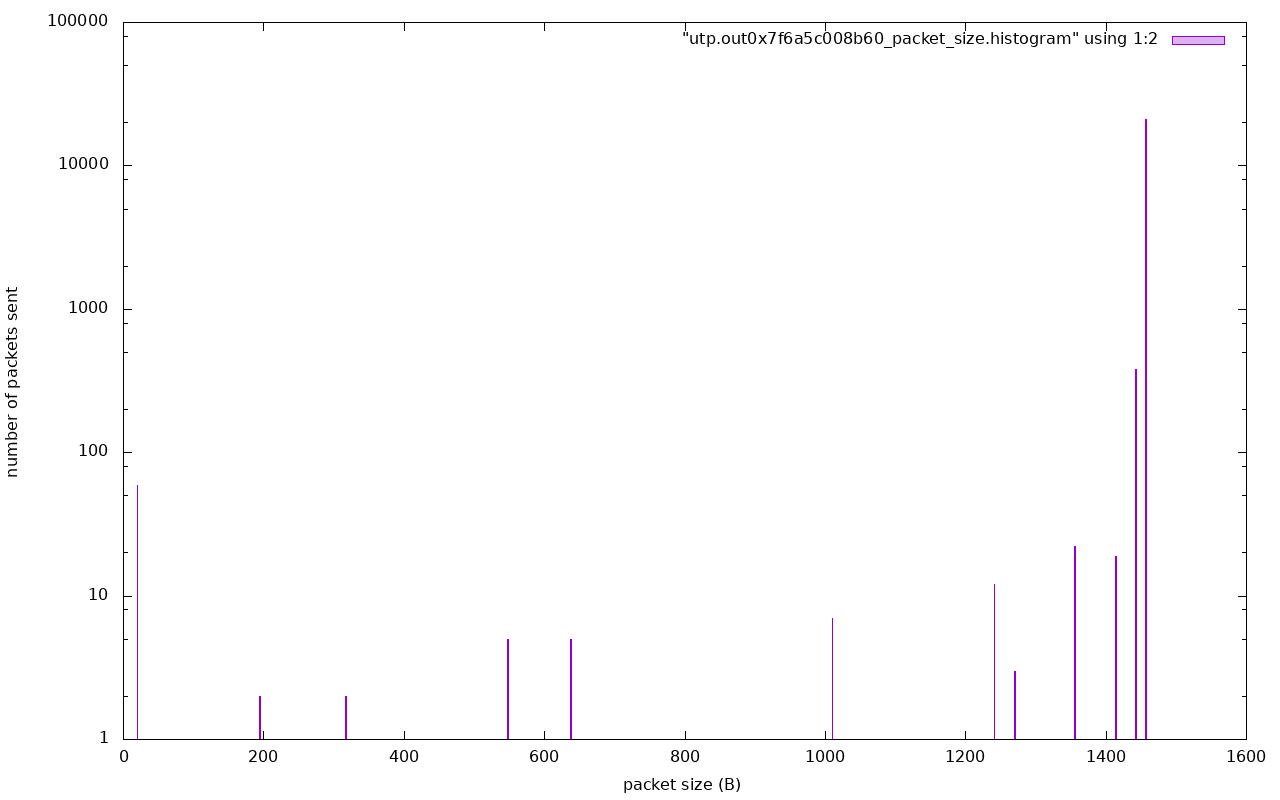
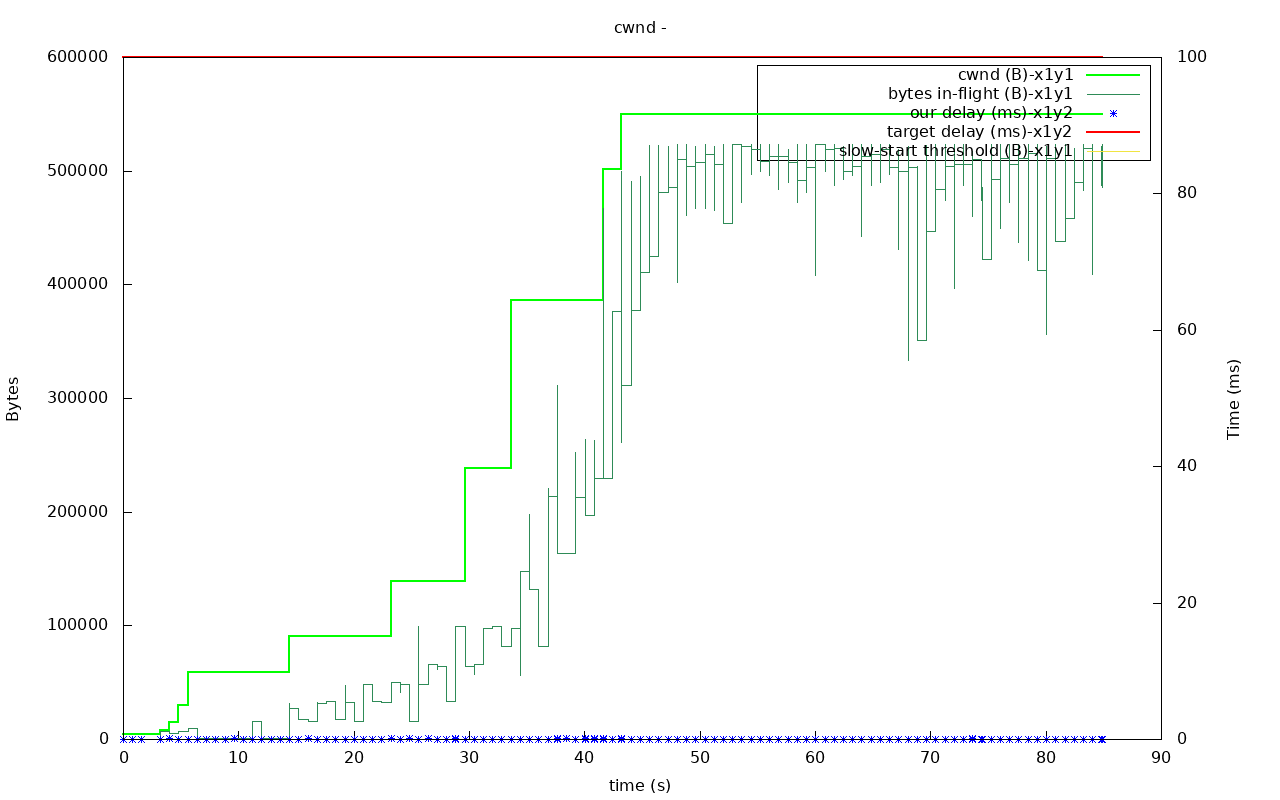
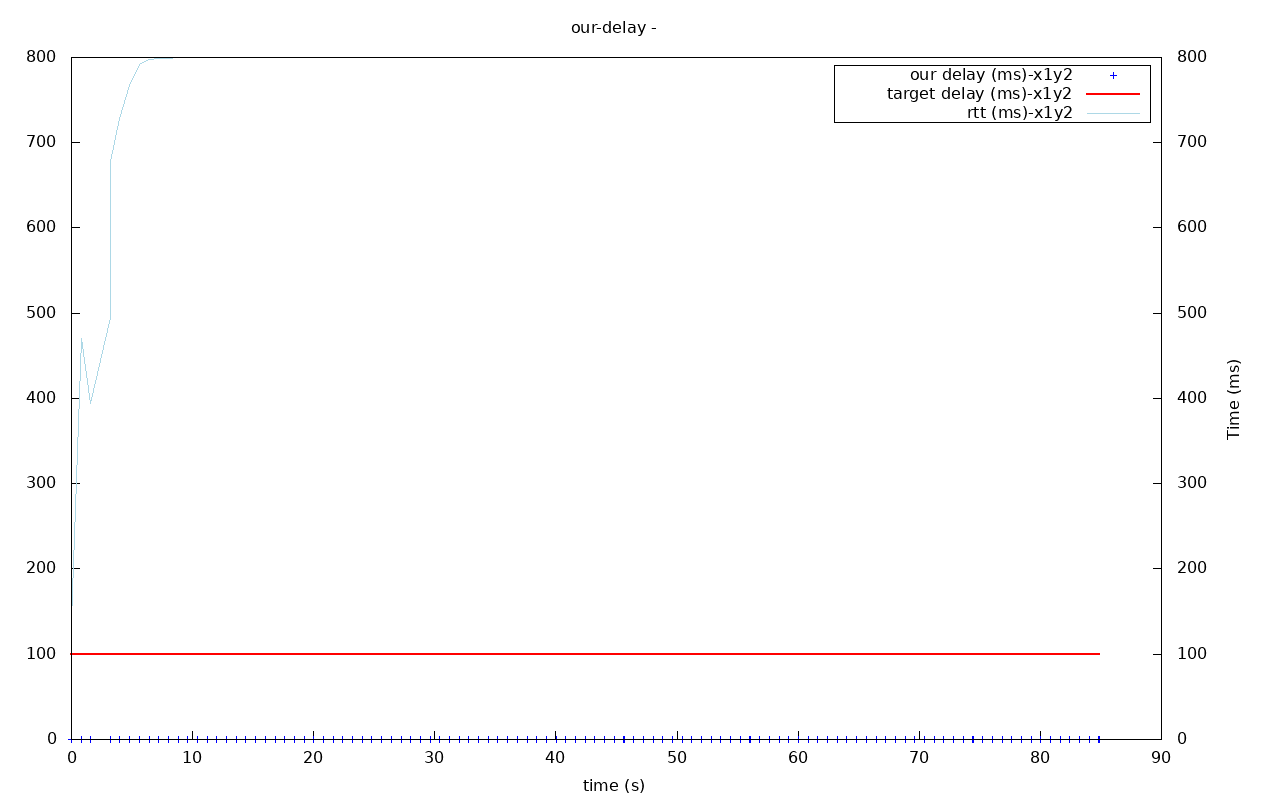
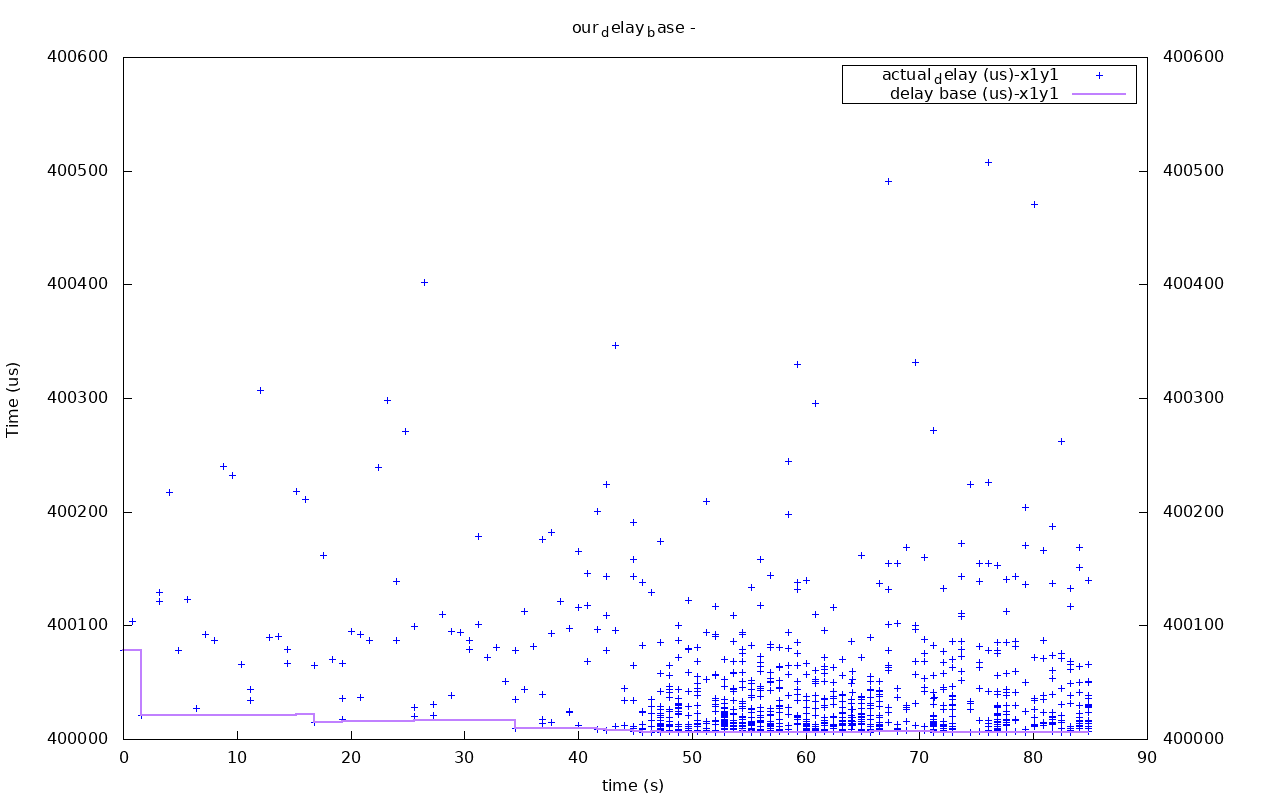
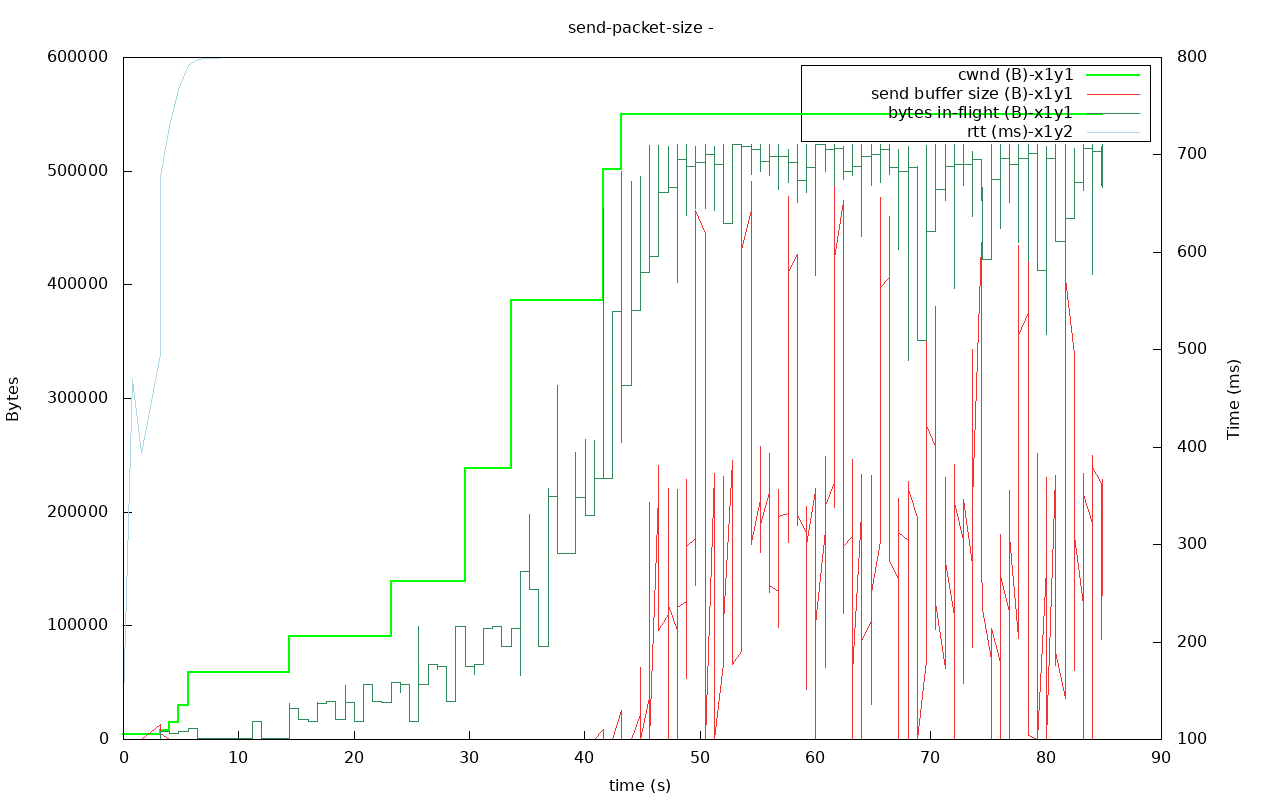
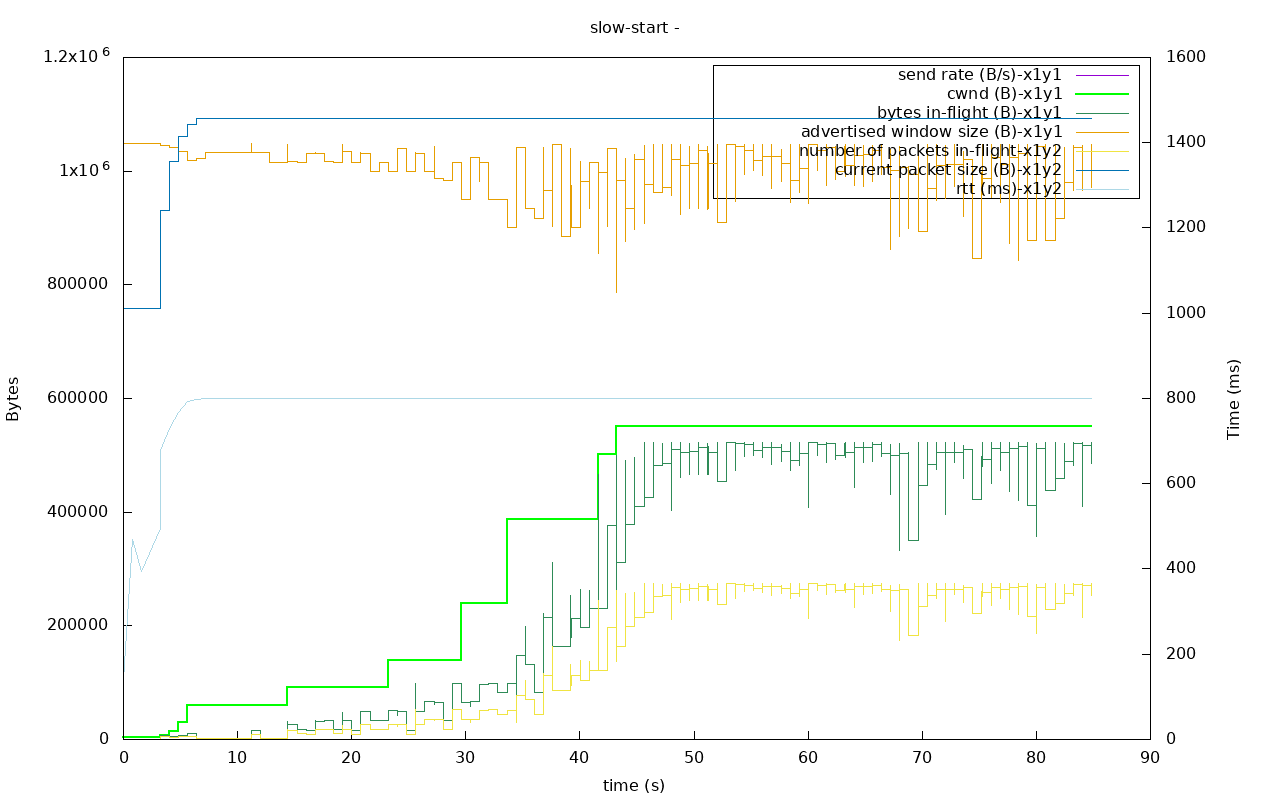
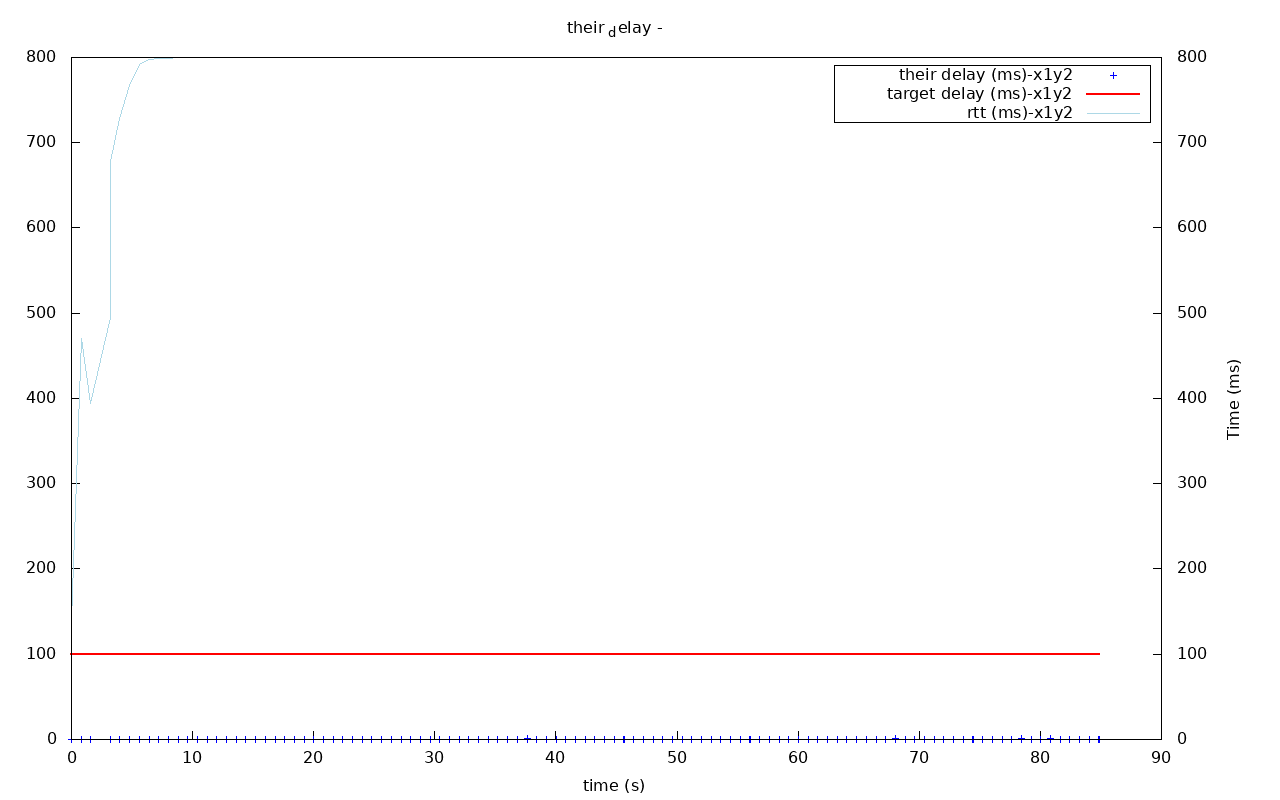
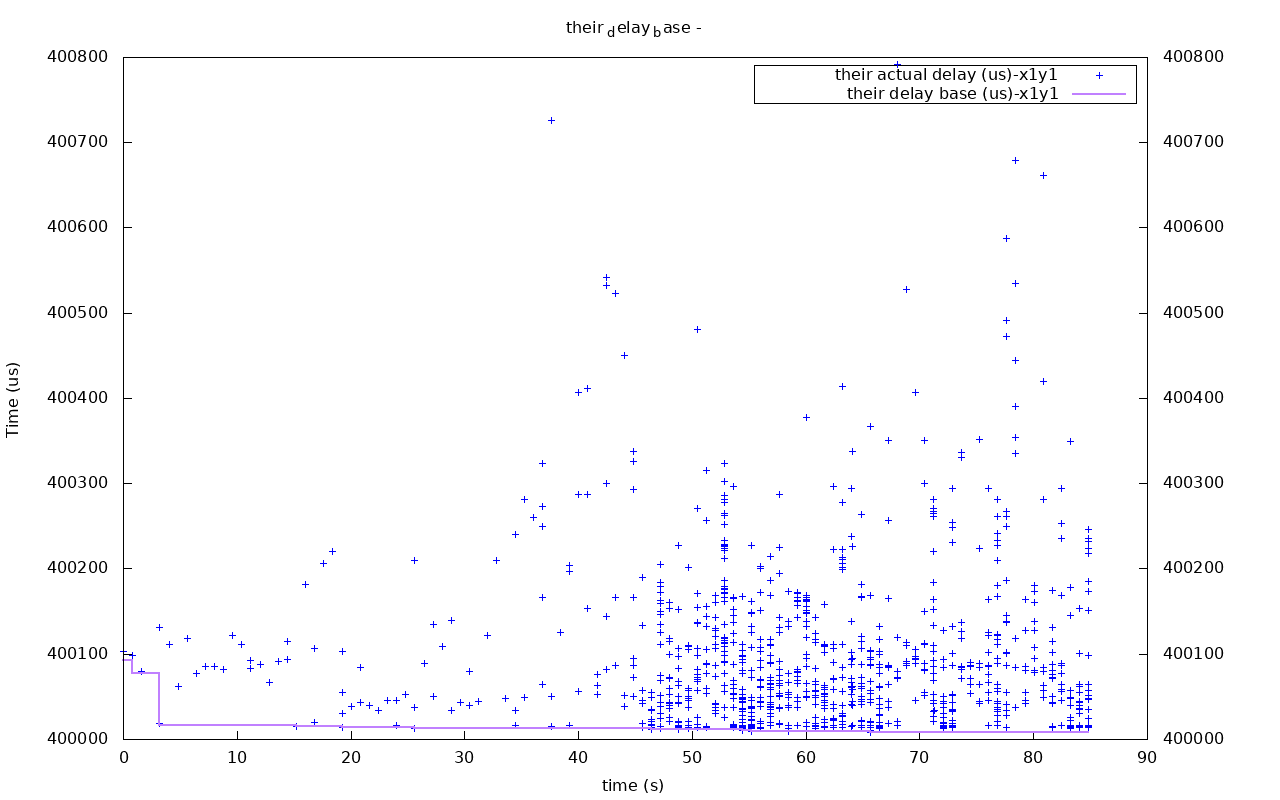
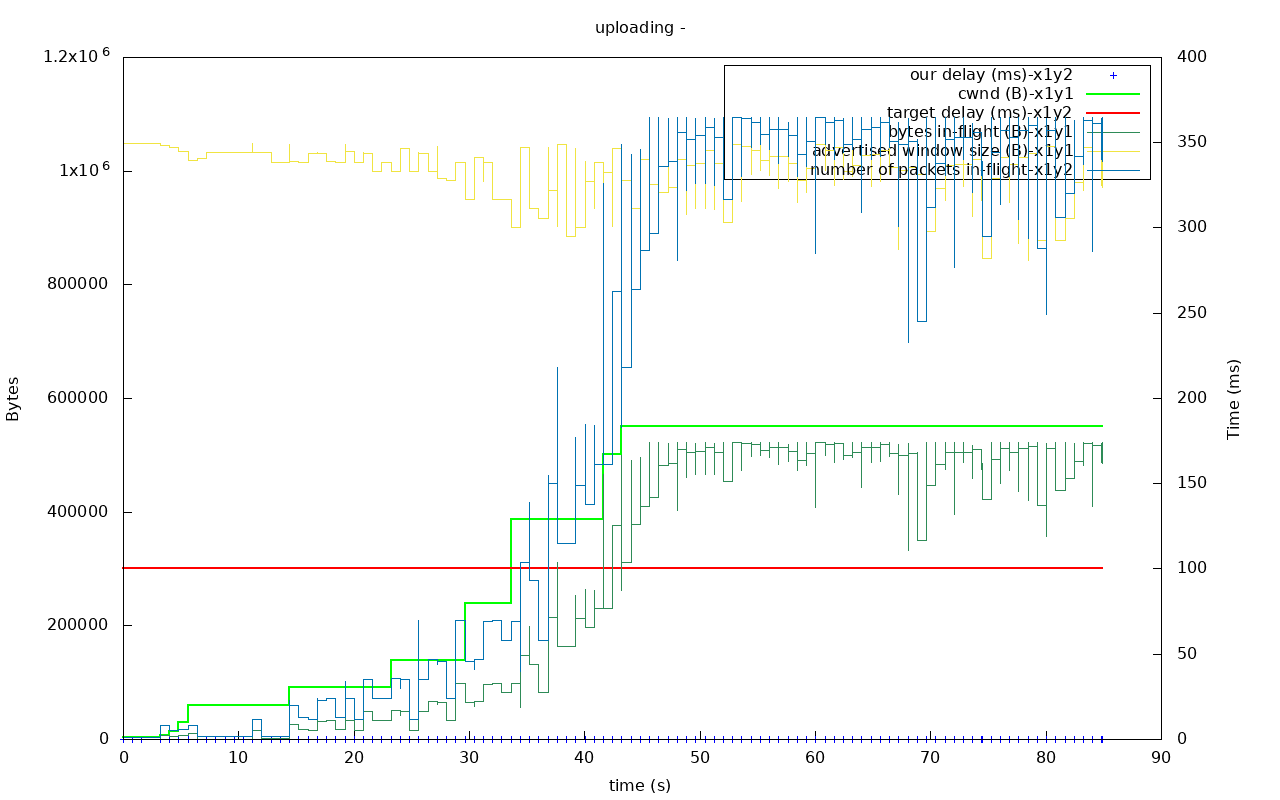
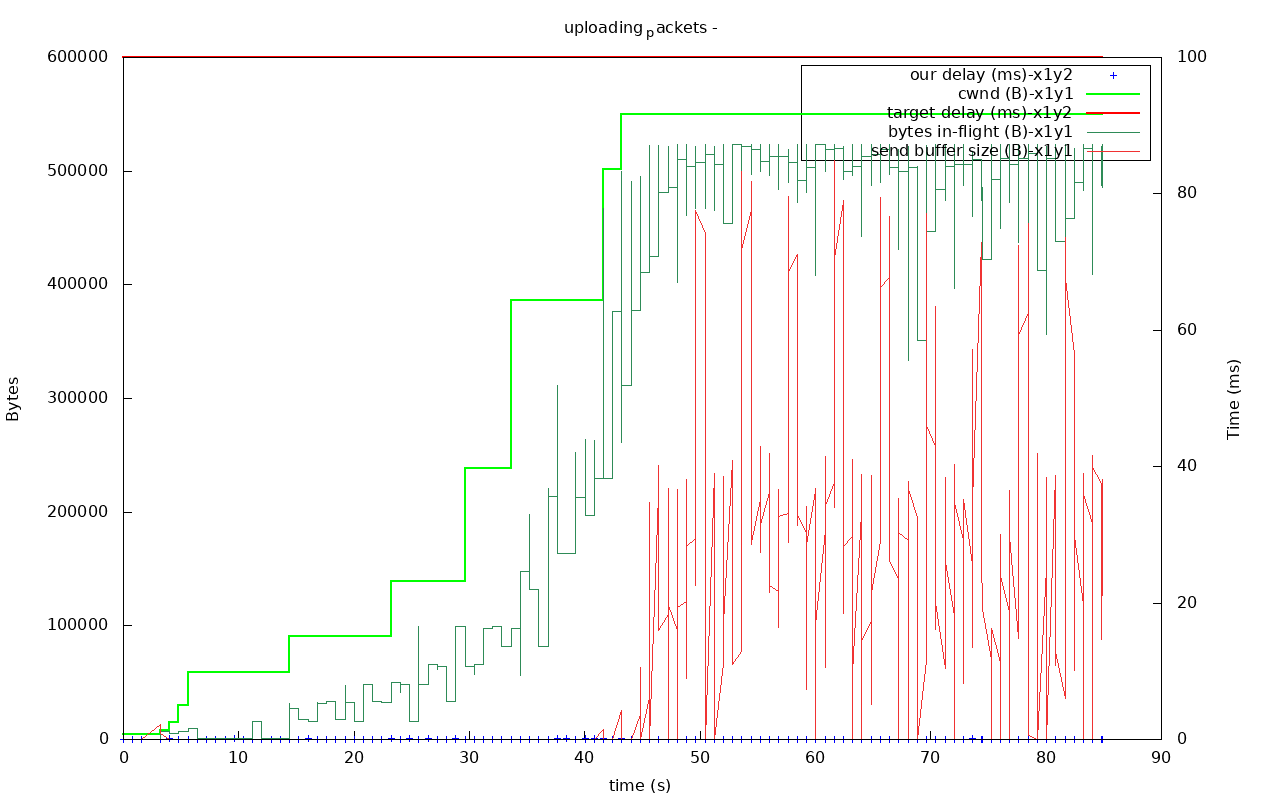
ichorid
on 20 Feb 2018
The download speed oscillated between 0-1Mb/s. It was much faster than on my old PC.
ichorid
on 20 Feb 2018
ok, my next theory is that this is bottlenecked by the next control loop up (i.e. the bittorrent requests).
By default a peer is only allowed to have 500 outstanding requests at a time, and similarly, the client will only keep 500 outstanding requests to a peer. With a high bandwidth-delay product, these need to be bumped. The actual number of outstanding request is adjusted dynamically based on download rate, so these are just the upper ceilings. i.e. you can set them really high without causing too much problems (except during high transfer rates over high-latency connections).
increase max_allowed_in_request_queue and max_out_request_queue to, at least, 5000 or so maybe?
There's also this, which may be relevant: request_queue_time, this determines the number of outstanding requests we will actually keep to a peer, based on the current download rate, we want to keep this many seconds worth of payload requested. It defaults to 3, which under normal circumstances is enough (and may still be in your case too, since you disabled the disk). Under normal circumstances though, the round-trip time to the disk must be considered here too.
Sorry about all the knobs here. I would be very happy if someone would propose a way to automatically set some of these.
arvidn
on 20 Feb 2018
I would be very happy if someone would propose a way to automatically set some of these.
@synctext we could probably turn this into a Bachelor thesis project.
qstokkink
on 21 Feb 2018
@arvidn, no problem with knob-turning! It helps me to get familiar with libtorrent ))
I ran the tests on 400ms two-sided latency (rtt 800ms) with
max_allowed_in_request_queue 5000
max_out_request_queue 5000
request_queue_time 5
No changes in perceived download speed. Here are the graphs:
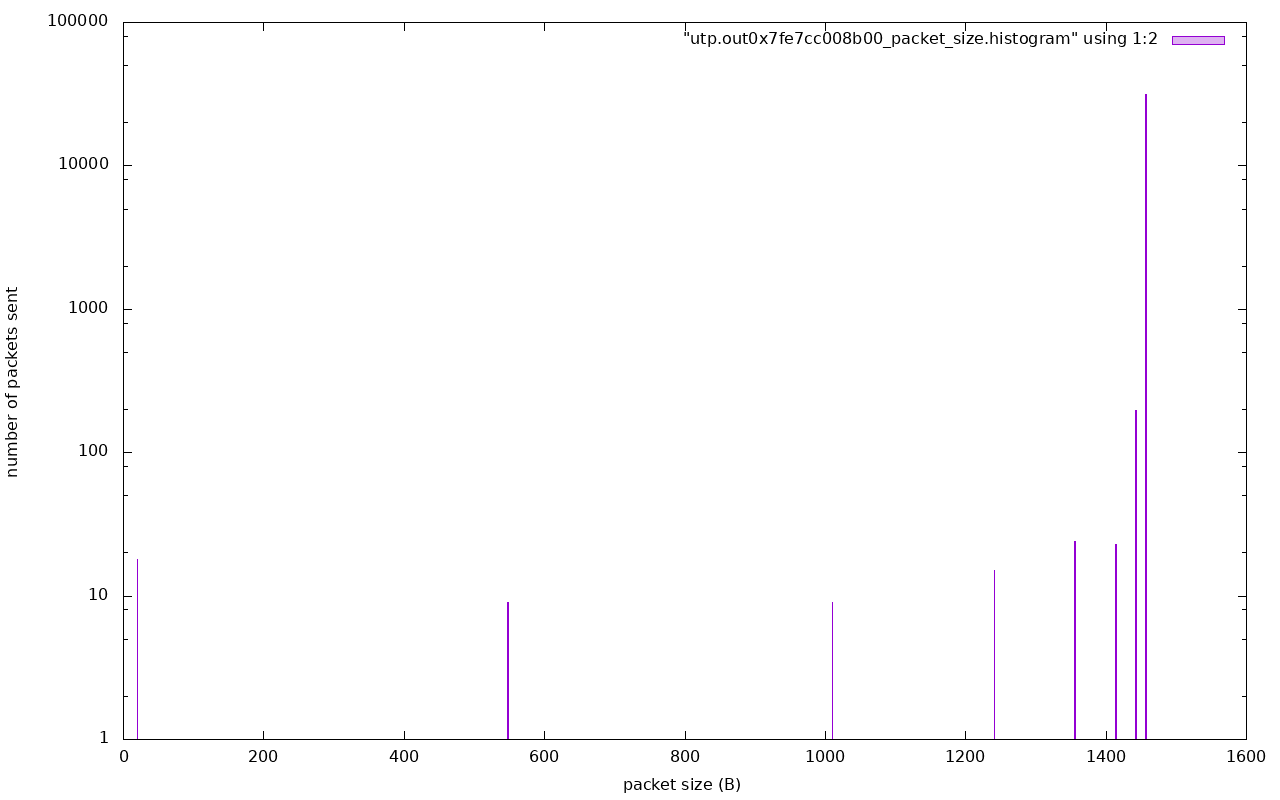
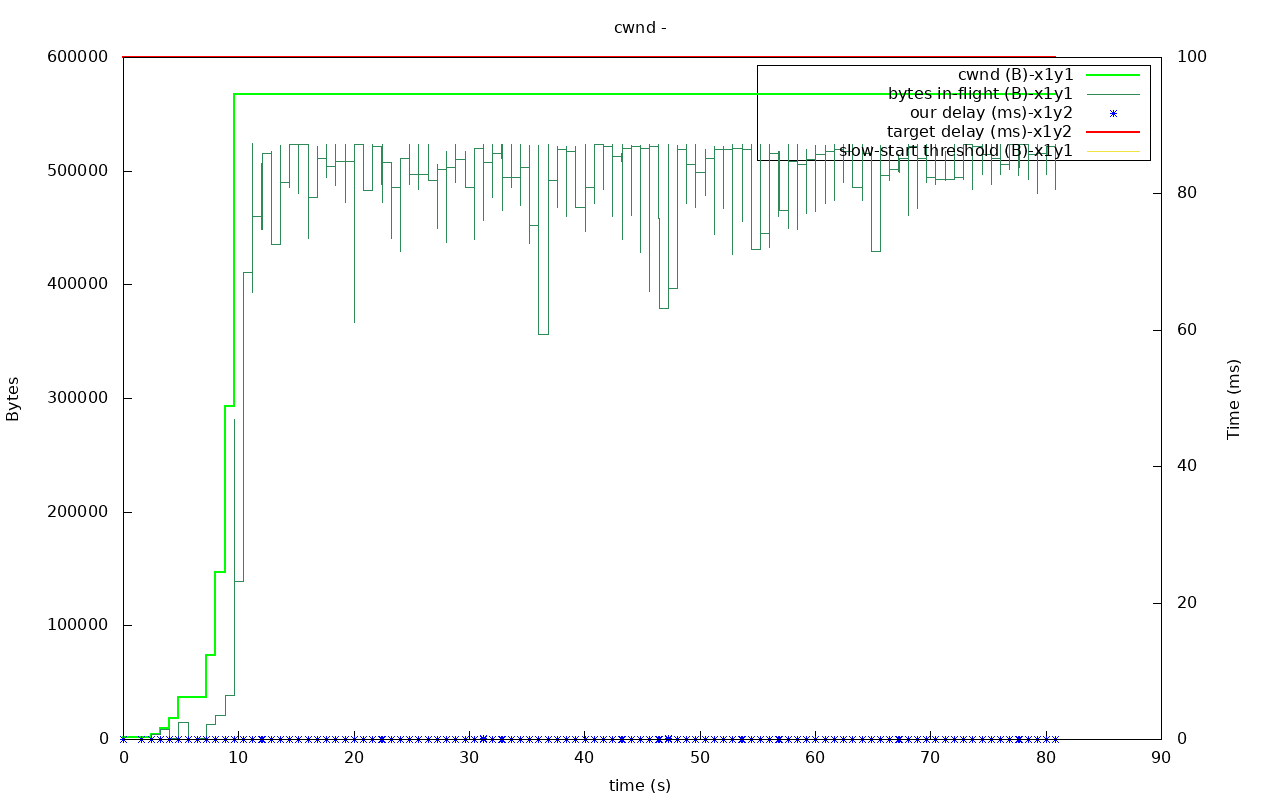
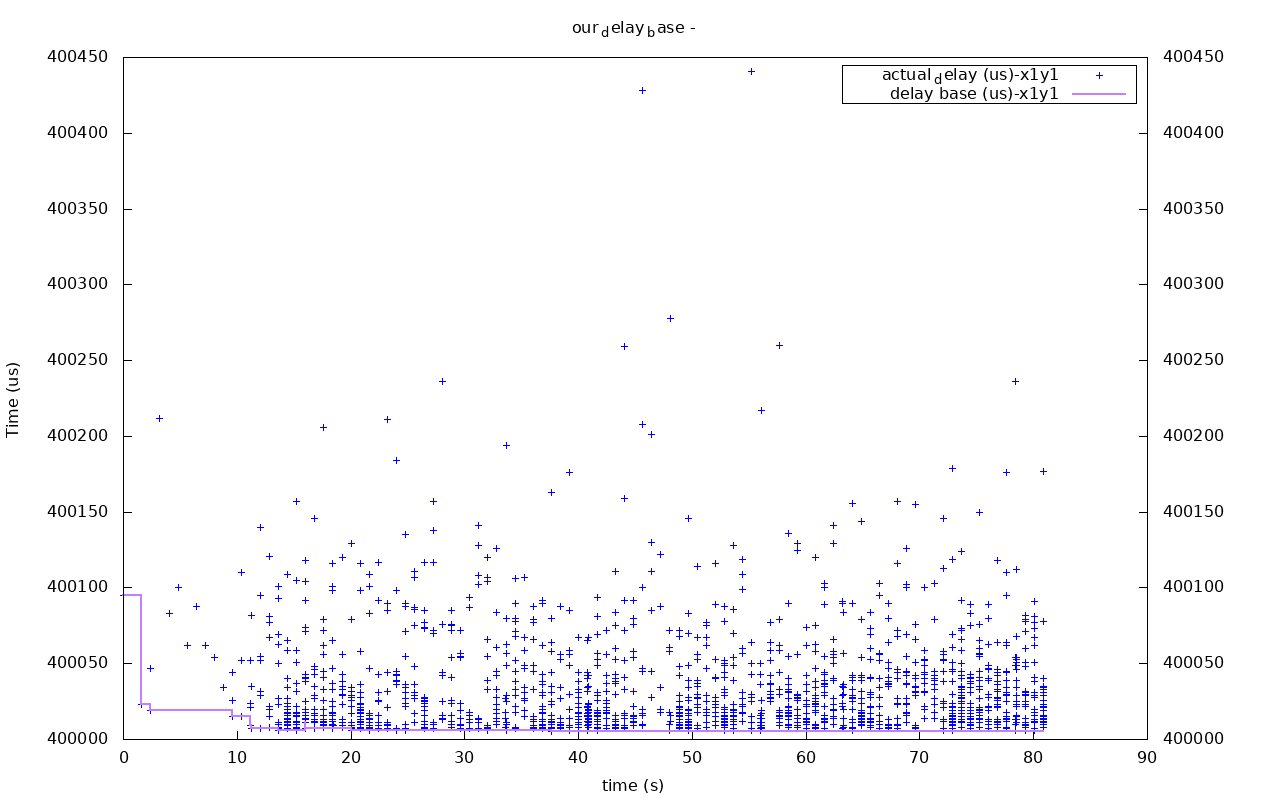
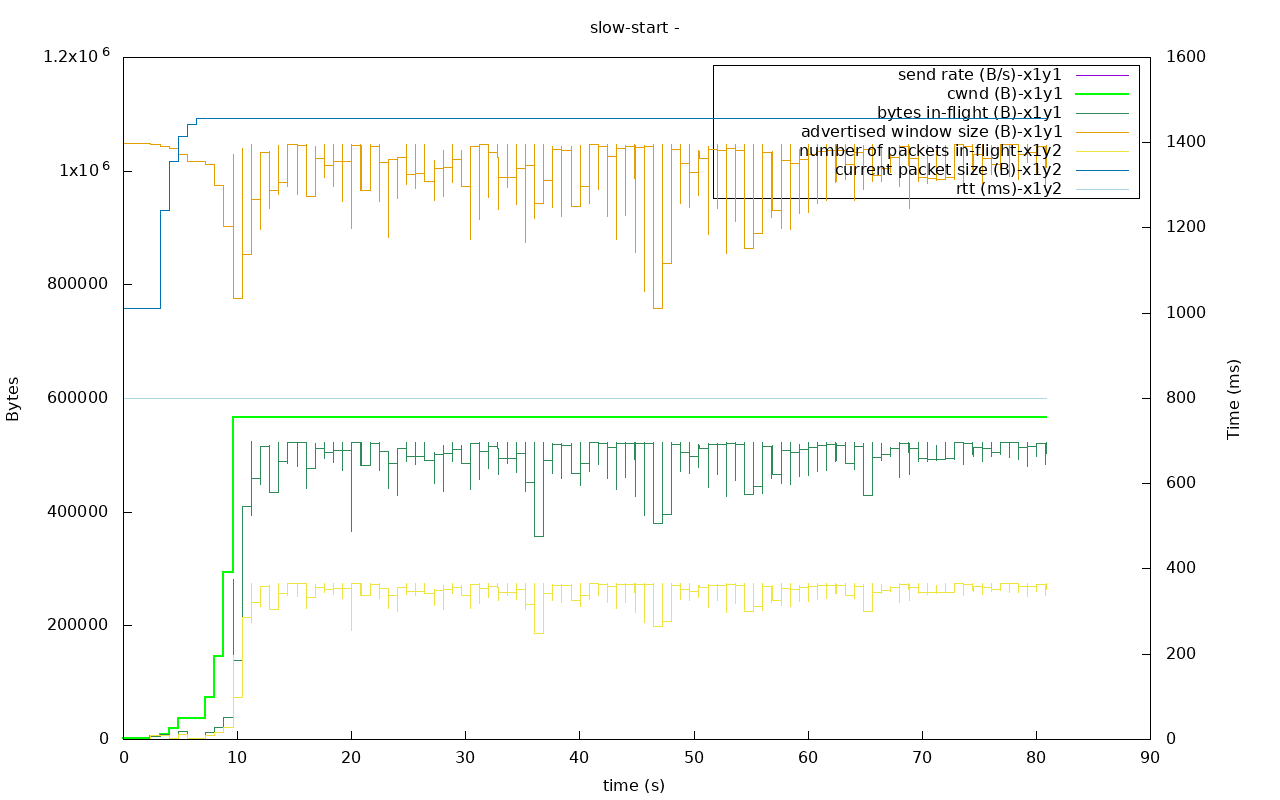
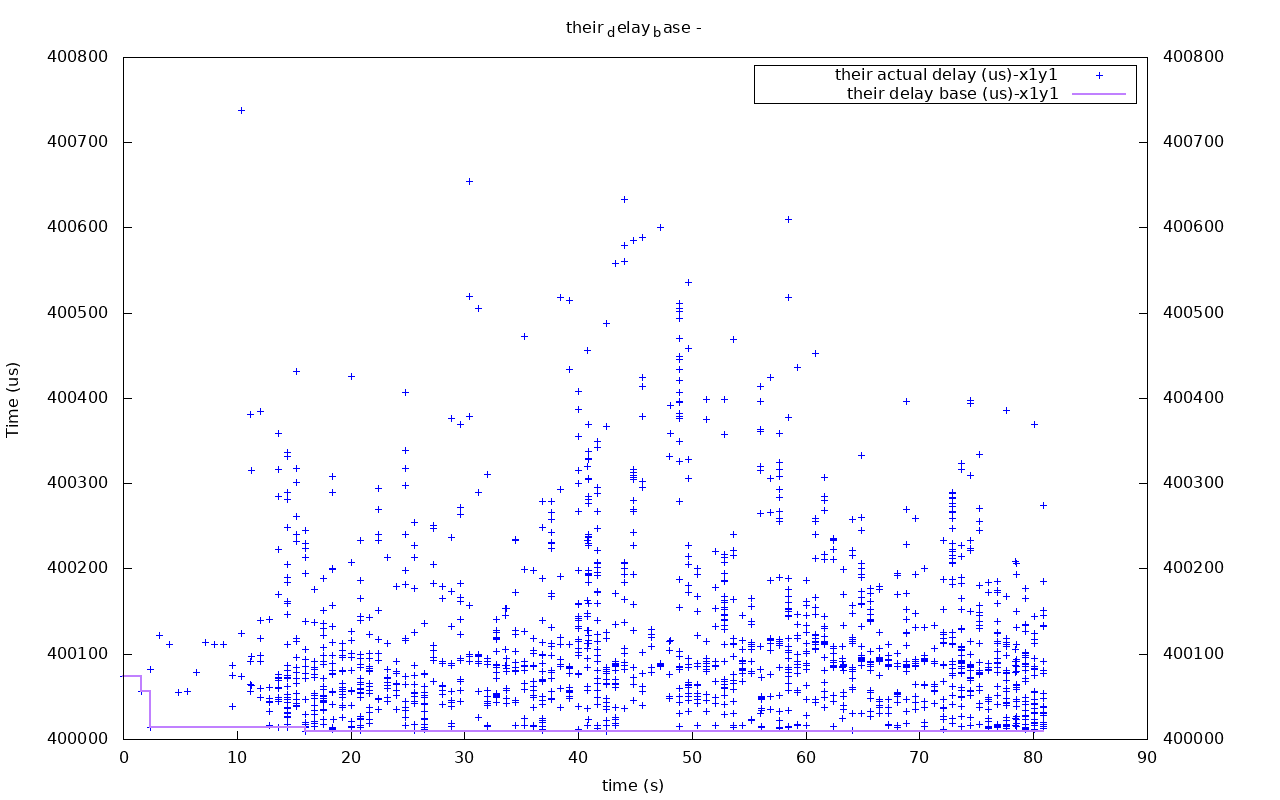
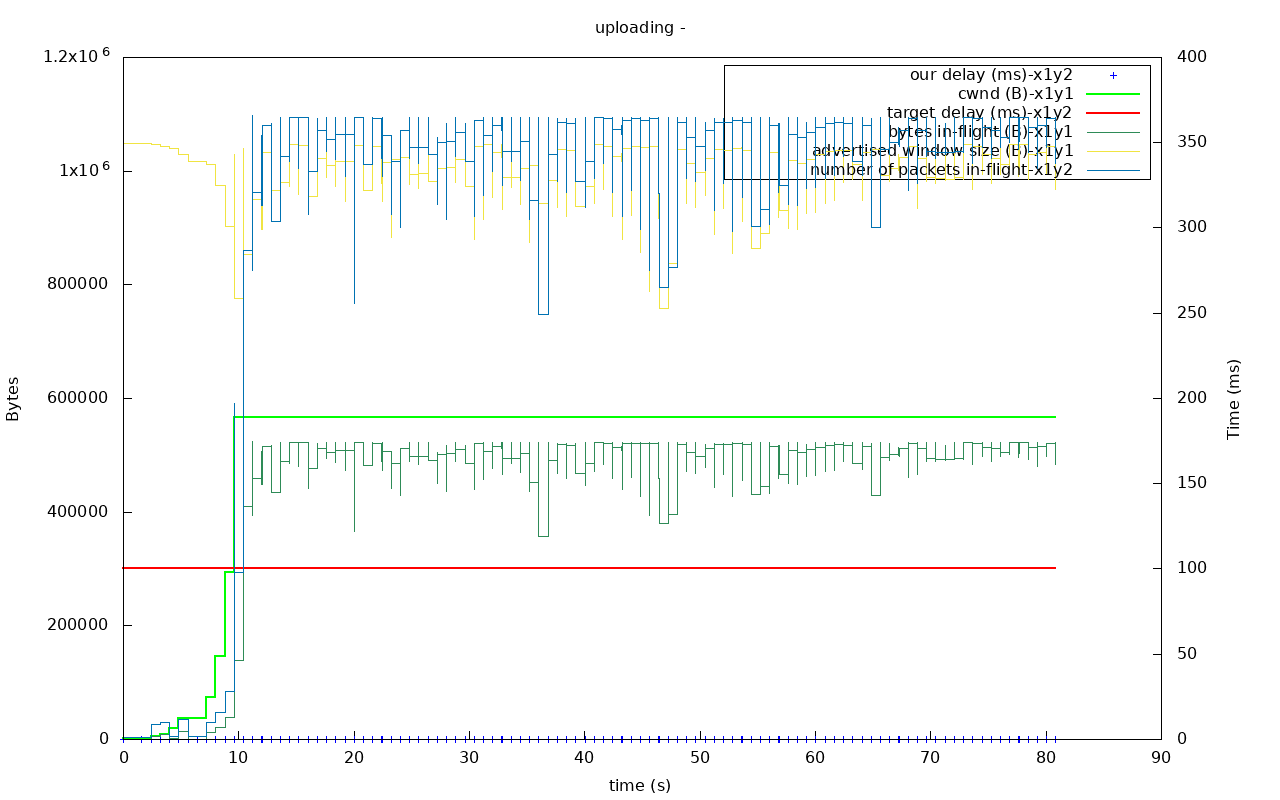
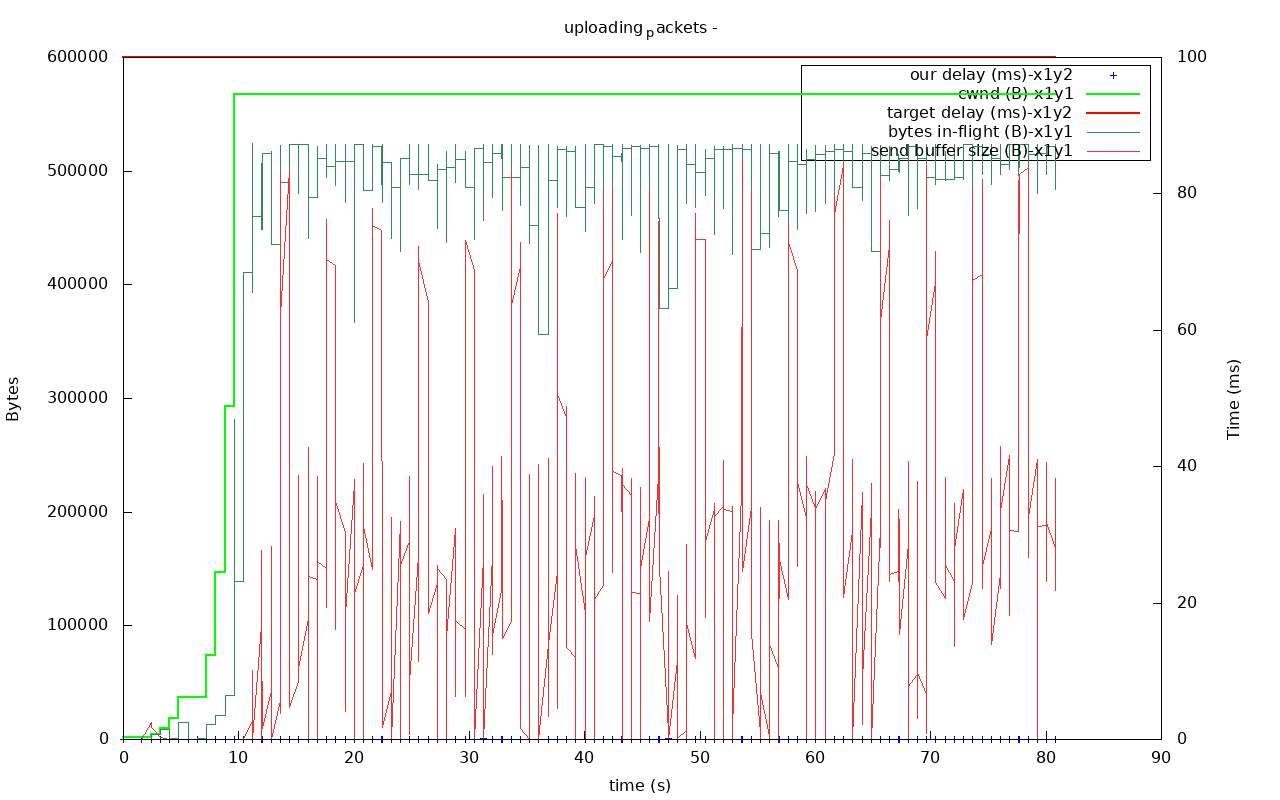
ichorid
on 21 Feb 2018
Now, let's do a really simple test to estimate the peak performance we could hope to get in this setup.
We will push data with netcat utility through UDP, without any link control at all, and measure the flow at the receiving end.
nc -v -u -l 777 |dd bs=1024k of=/dev/null
dd if=/dev/zero bs=1024k | nc -u 192.168.0.13  777
The results for UDP (obviously, no link control):
9262039040 bytes (9.3 GB, 8.6 GiB) copied, 316.683 s, 29.2 MB/s
(urandom-based results are the same. TCP-based transers by netcat achieve 2MB/s)
ichorid
on 21 Feb 2018
@arvidn, could we do something like this test, but libtorrent-based? Like, completely disabling ACKs and all kind of feedback on uTP, just to test the sender side on it's own?
Push the knobs beyond the limits of sanity, so to say?
ichorid
on 21 Feb 2018
@arvidn, I've just tried to do a very dumb thing with libtorrent. I started to double the received advertised window size on seeder's side, like this:
# utp_stream.cpp
# m_adv_wnd = ph->wnd_size;
m_adv_wnd = ph->wnd_size*2;
and the download speed bumped up to 2Mb/s!
When I tried to push it to increase 4 times, it became too unstable, but sometimes actually reached 3,1 Mb/s.
Here are some plots from ph->wnd_size*2 version:
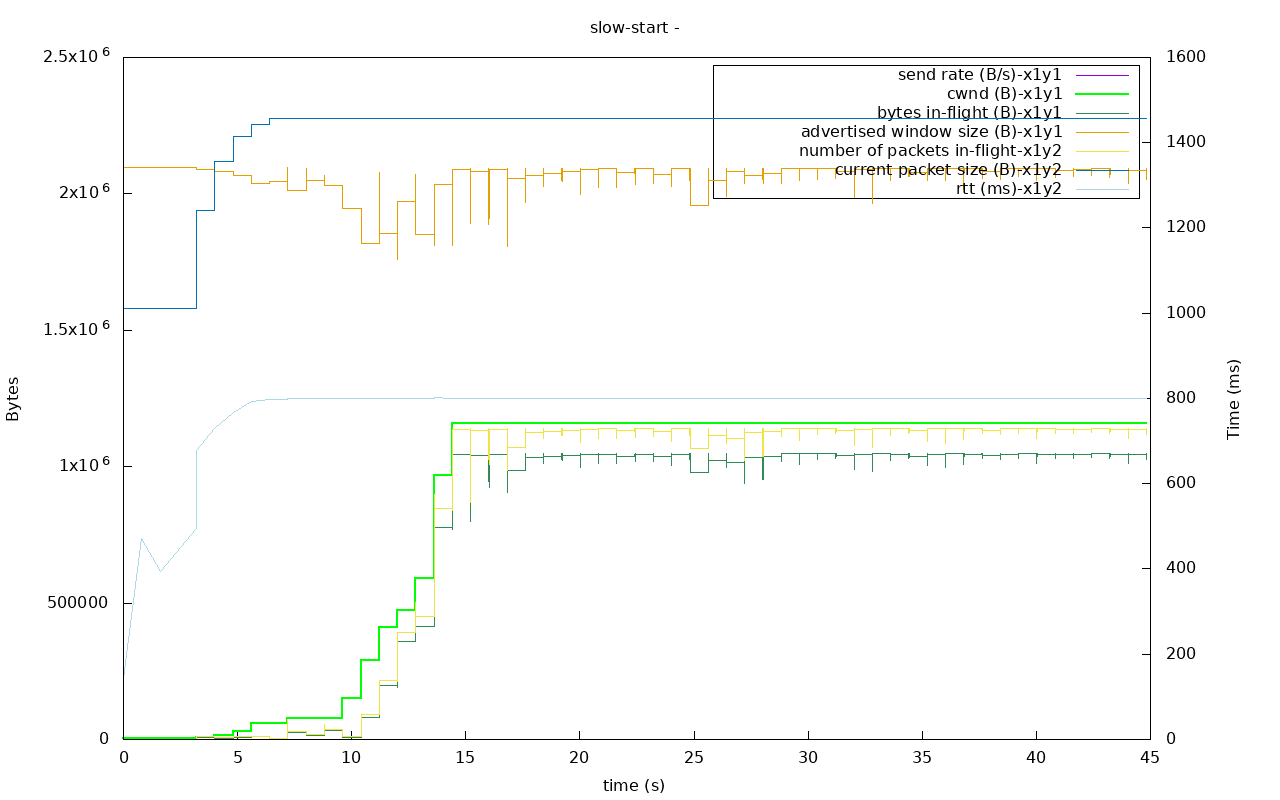
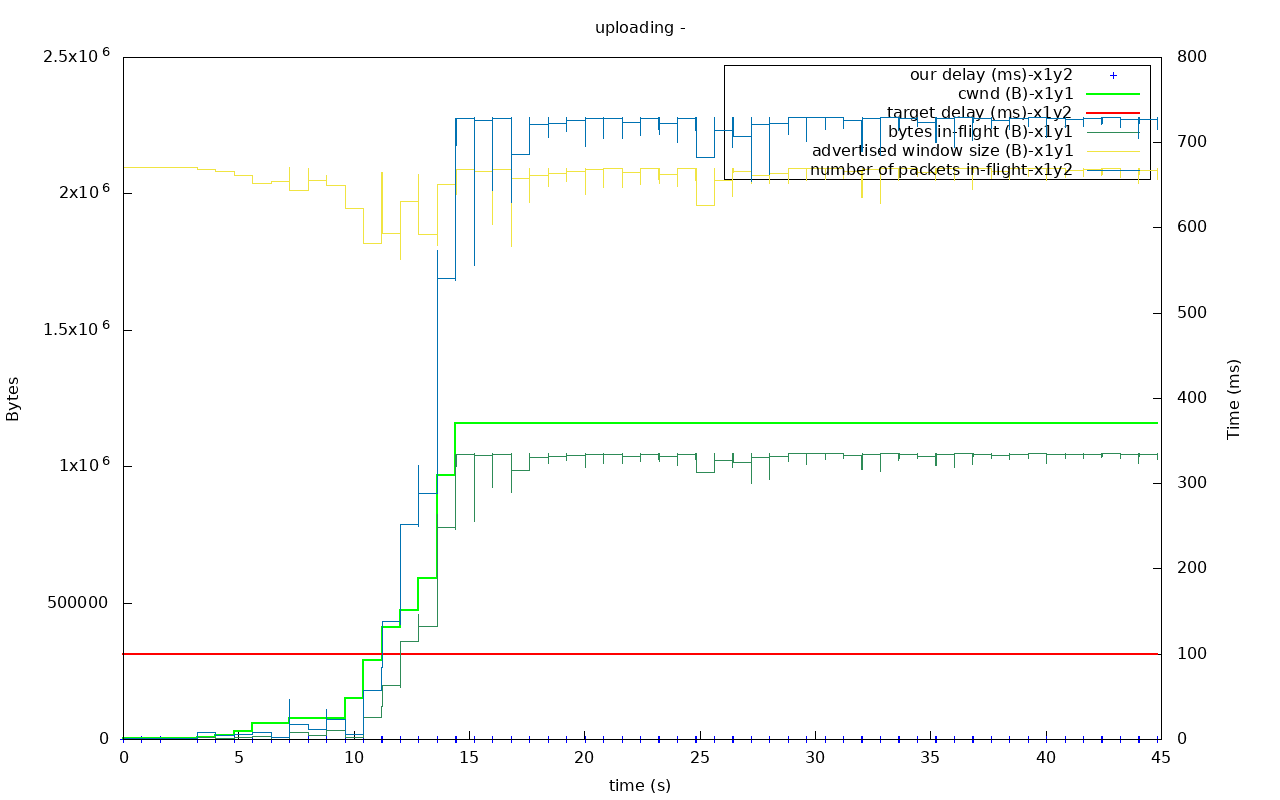
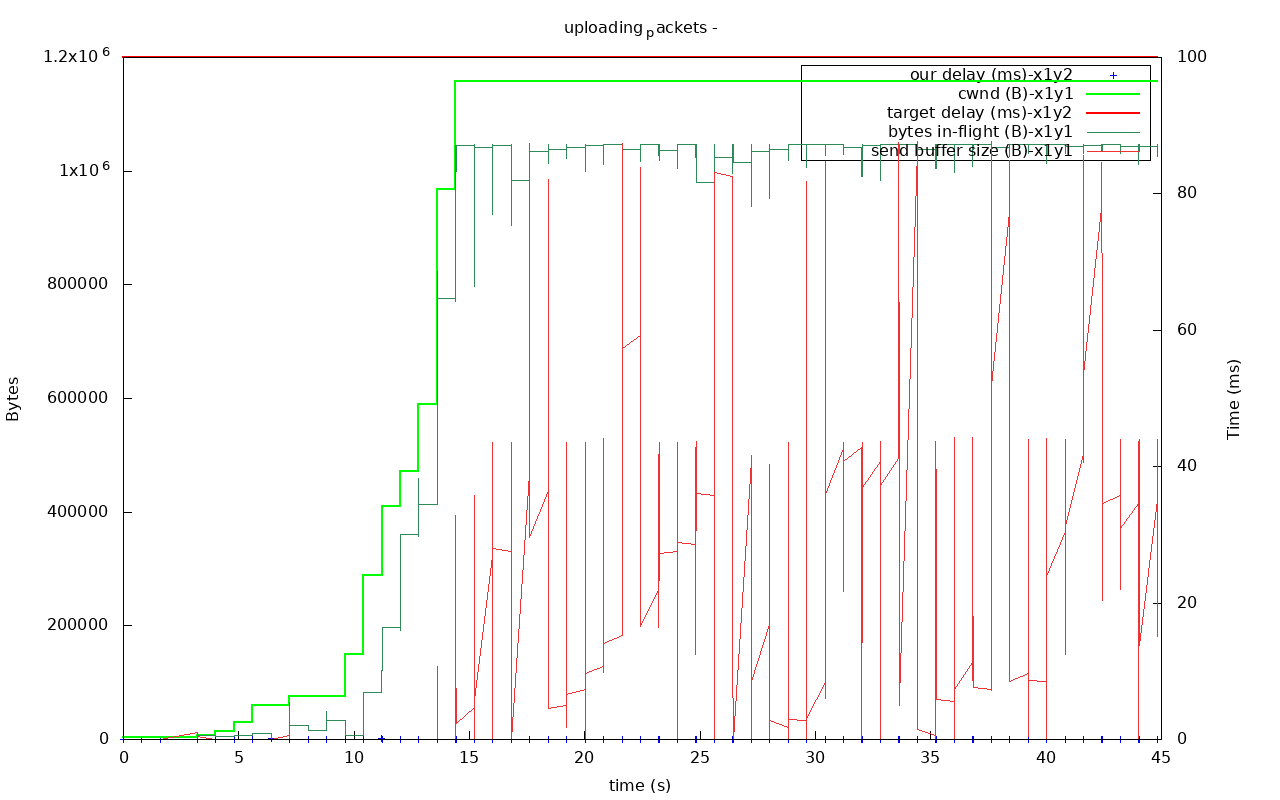
But no matter if I use modified libtorrent or not, the download rate remains unstable. Could we do something to make it more stable, and keep this 2Mb/s result?
ichorid
on 21 Feb 2018
I see, so perhaps there's a bug where the advertised receive window is misinterpreted, and that we're really hitting that limit. The advertised receive window is determined by recv_socket_buffer_size on the downloader. Does it have the same effect to set this to 4 MiB?
regarding turning all the knobs up; I think the issue is to understand which know is left to turn up, but it seems like you're onto something with the advertised receive window.
regarding "stability", what is the symptom you see exactly? The graphs you post looks extremely stable to me, as in a very steady number of bytes is outstanding at any given time.
In this last graph you posted, it looks like the send buffer may being completely drained regularly, suggesting you need to increase the send_buffer_watermark or increasing the number of outstanding requests on the downloader.
arvidn
on 21 Feb 2018
@arvidn, increasing recv_socket_buffer_size on the downloader side have no effect on the download speed. Besides, previous tests already used 4MiB for these settings.
By the way, it is normal for uTP not to pull the cwnd and, consequently, bytes in flight up to the ceiling of advertised window size? Is it normal that the actual cwnd always remains only a half of it?
ichorid
on 21 Feb 2018
no that's not how it's supposed to work. cwnd is supposed to be able to grow all the way up to the advertised receive window (unless it's held back by something else, like congestion or the send buffer size).
arvidn
on 21 Feb 2018
I got one. It never leaves slow_start mode according to logs. It happens because:
if (delay >= target_delay)never fires, because there is no variation in delay in these tests;- there is no packet loss.
It just sits there stuck half-way to normal saw mode.
This is a corner case, I'll try to do it more realistic.
ichorid
on 21 Feb 2018
that does sound like an issue, but if anything, that should cause it to be more aggressive. it doesn't explain why it would stop growing before hitting the advertised receive window, not why it does in fact cut cwnd in half sometimes (but maybe I shouldn't be conflating the results from the older testruns)
arvidn
on 21 Feb 2018
so, I was theorising that staying in slow-start would somehow prevent cwnd from exceeding half of the advertised receive window. My expectation on what constrains cwnd was incorrect. It's not limited by the advertised receive window, but the effective send window is min(cwdn, adv_wnd).
So, the fact that cwnd stops increasing appears to be unrelated to the advertised window. It's possible there's some issue where utp thinks the upper layer doesn't have any more to send, or isn't sending fast enough and that cwnd_saturated ends up being false, for some reason.
Is there any chance I could get a full log from this run? maybe even a verbose log, if it doesn't affect the result too much
arvidn
on 22 Feb 2018
@arvidn, here you are, sir: https://drive.google.com/open?id=1rqSsHsXgKkPSSjyEAOJr1UNL4FkAiHpw
Please, don't mind the cwnd_saturated line I added. It fires just after the cwnd_saturated check.
ichorid
on 22 Feb 2018
@arvidn
       if (m_bytes_in_flight + payload_size > (std::min)(int(m_cwnd >> 16)
                , int(m_adv_wnd) - m_bytes_in_flight))
do we really need to int(m_adv_wnd) - m_bytes_in_flight here? In every other place m_cwnd is compared with m_adv_wnd directly.
I tried to do it this way:
       if (m_bytes_in_flight + payload_size > (std::min)(int(m_cwnd >> 16)
                , int(m_adv_wnd)))
and the speed doubled, but cwnd_saturated still false everywhere, but it breaks out of slow_start eventually.
ichorid
on 22 Feb 2018
The logs from this run:
cwnd_saturated m_bytes_in_flight:1041825 acked_bytes: 1437 m_mtu:1457 m_cwnd:1047721 saturated:0
do_ledbat delay:4 off_target: 99996 window_factor:0.001373 target_factor:0.999954 scaled_gain:0.000000 cwnd:1047721 slow_start:0
mtu:1457 in_flight:1043262 adv_wnd:1047139 cwnd:1047721 acked_bytes:1437 cwnd_full -> 0
cwnd > advertized wnd (1047139) slow_start -> 0
no space in window send_buffer_size:391755 cwnd:1047721 adv_wnd:1047139 in-flight:1046136 mtu:1457
(p.s. I have no slightest idea what I'm doing.)
ichorid
on 22 Feb 2018
I have just redid the test for the full 1024MiB download. Here are the plots.
Unpatched:
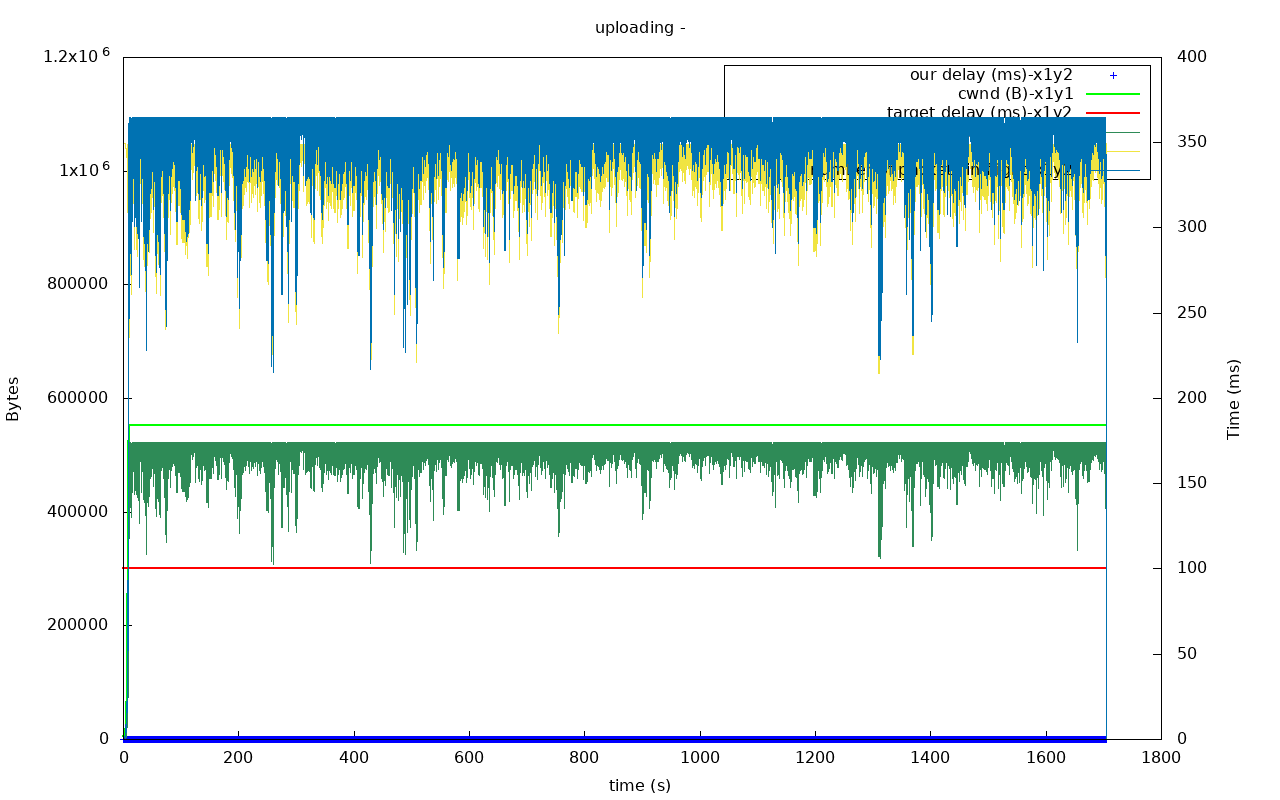
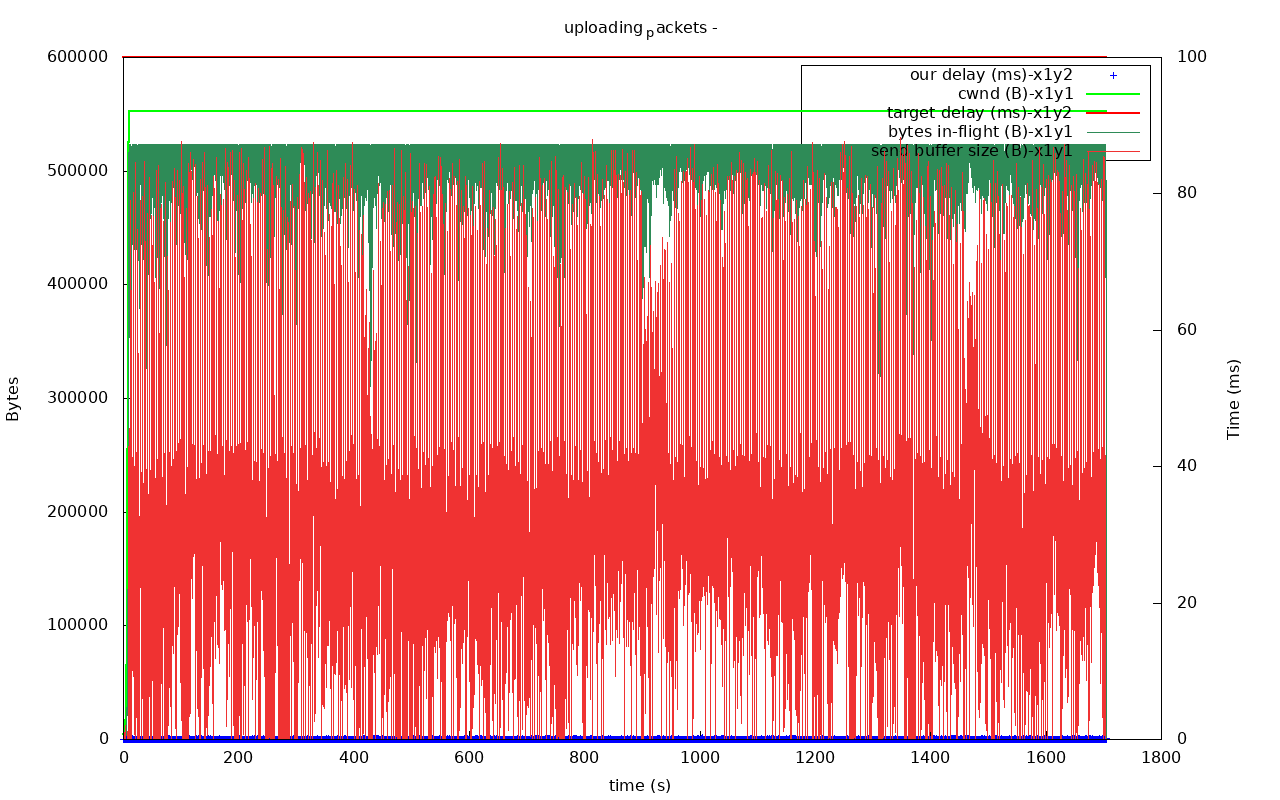
Patched:
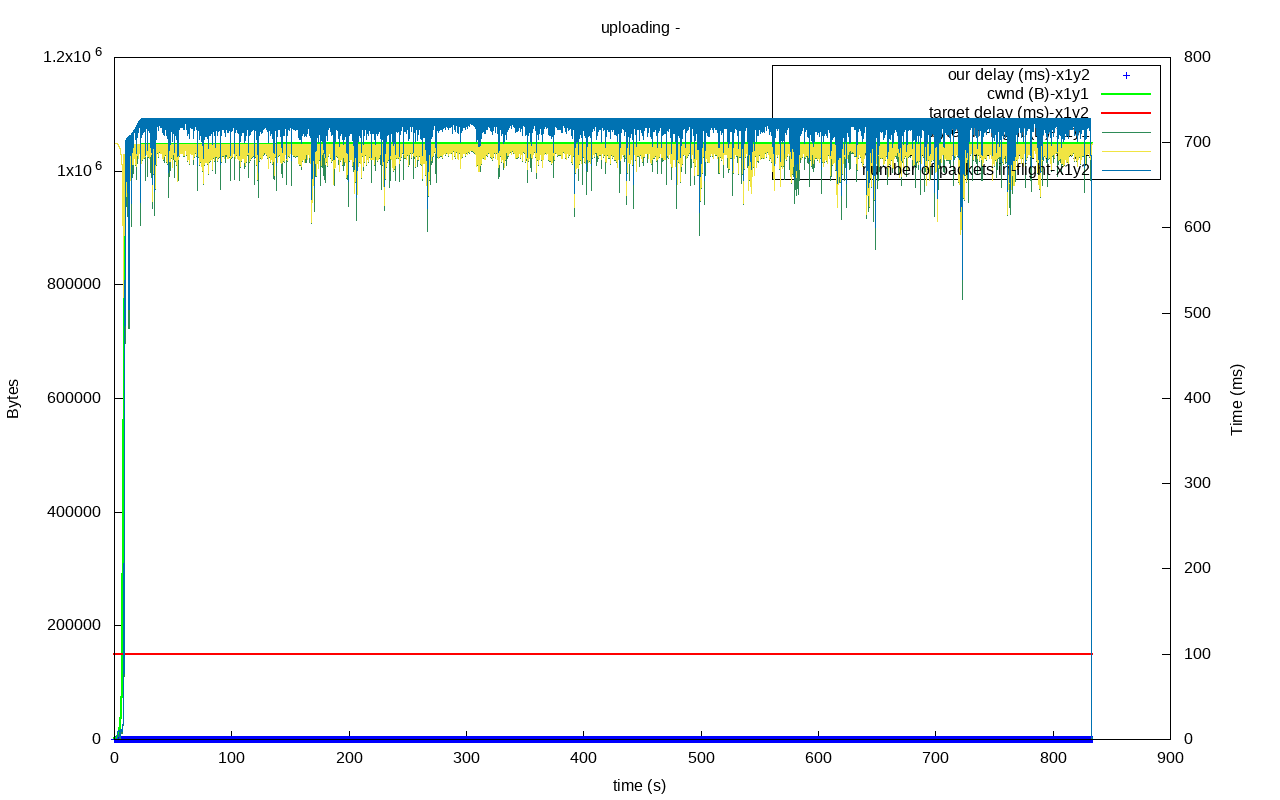
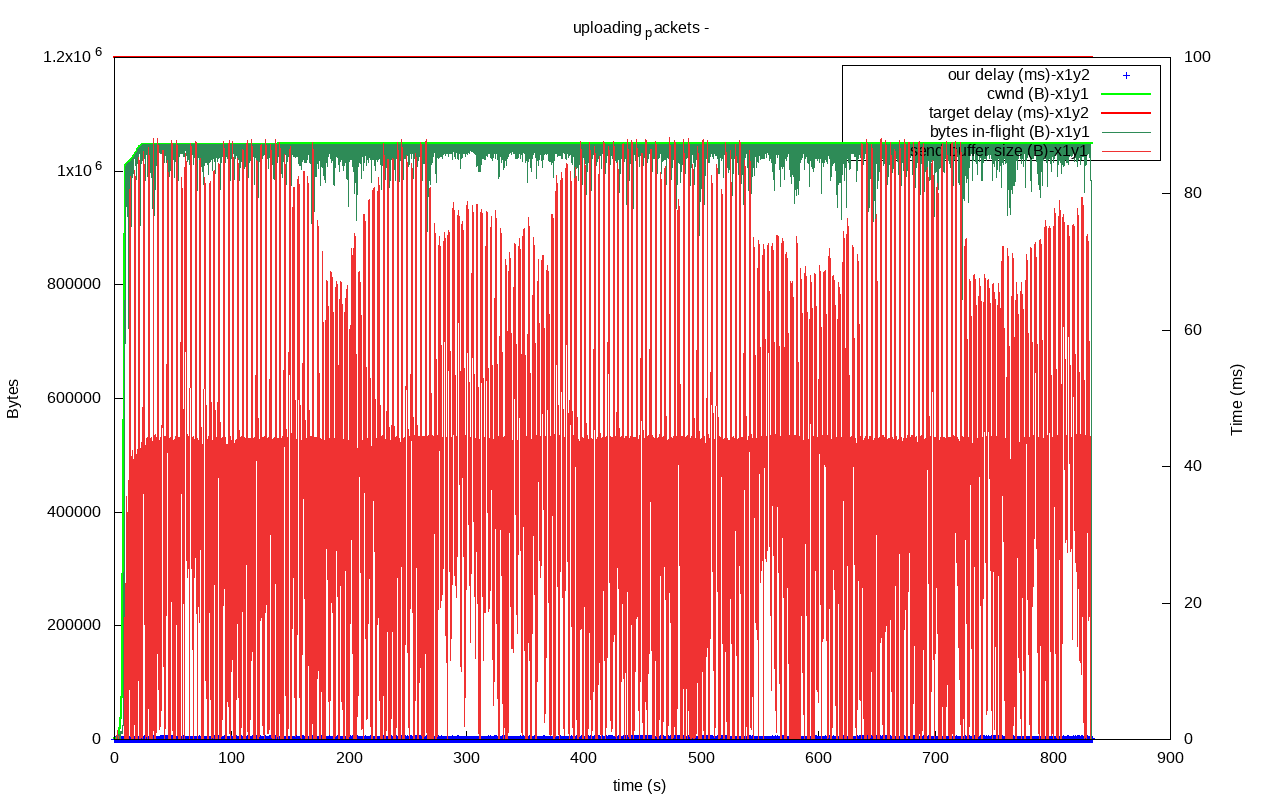
ichorid
on 22 Feb 2018
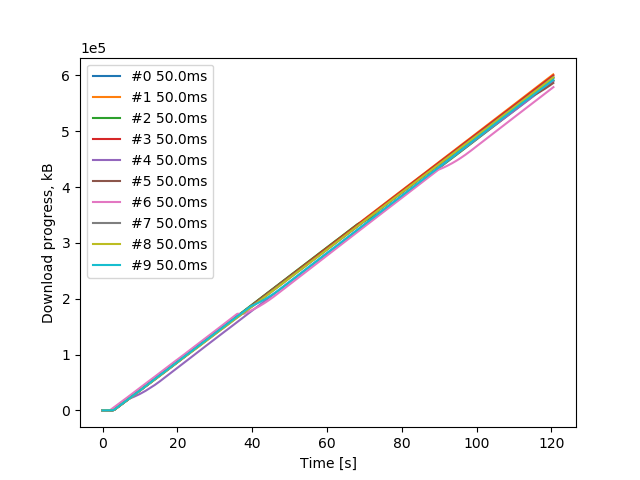
Also, I have redone it with our Python-based test suite:
Libtorrent
settings['recv_socket_buffer_size'] = 100*1024*1024
settings['send_socket_buffer_size'] = 100*1024*1024
Unpatched:
Patched:
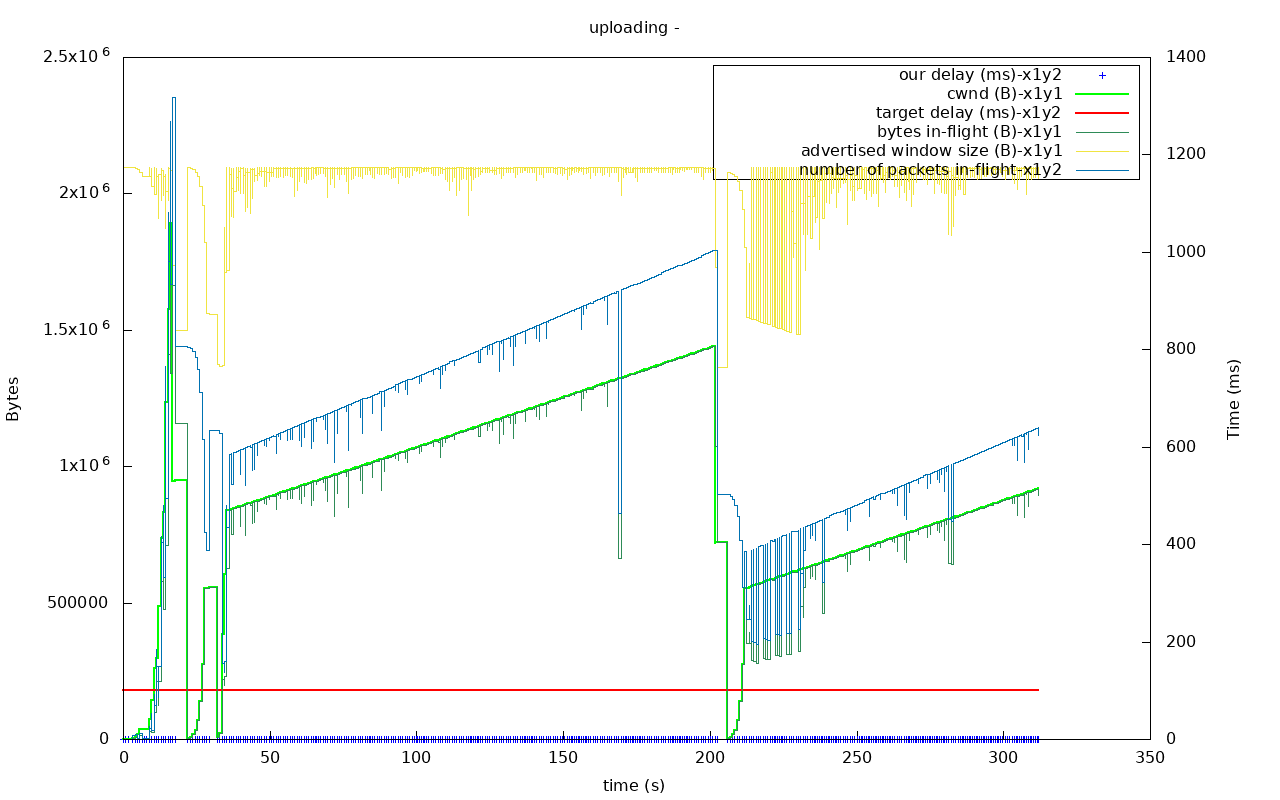
ichorid
on 22 Feb 2018
Evening, making solid progress clearly. Already doubled performance. impressive.
no space in window send_buffer_size:391755 cwnd:1047721 adv_wnd:1047139 in-flight:1046136 mtu:1457
As a non-expert this seems the _adv_wnd_ minus the _in-flight_ (it's merely 1MByte) does not have sufficient room to fit another _mtu_. Is LEDBAT holding back the size of _cwnd_? In the patched graphs it's also always maxed out at 1MByte.
{wrote a LEDBAT paper once but really don't know any details anymore}
synctext
on 22 Feb 2018
@ichorid You're right. subtracting the in-flight bytes from the advertised window definitely seems like a bug. From your graphs, it seems that with your patch cwnd does reach all the way up the the advertised window. Is that right? If so, it suggests the the bottleneck right now would be the recv_socket_buffer_size setting on the receiving end.
The y-axis is a little bit subtle in those test suite graphs, but I take it the ticks are to be multiplied by 10^5 and 10^6 respectively. so the patched version nearly twice as fast. Which is consistent with allowing a 2 MiB cwnd instead of 1 MiB.
You say you set the send and receive buffers to 100 MiB though, it would be interesting to see what uTP thinks the advertised receive window is. I fear that there may be some edge cases and possibly overflows at very high numbers. Although, I'm pretty sure the protocol use 32 bits for the advertised receive window.
arvidn
on 23 Feb 2018
@arvidn, actually, recv_socket_buffer_size does not affect advertised window and/or receive buffer size in any way. Leecher computes its advertised window by doing:
h->wnd_size = (std::max)(m_in_buf_size - m_buffered_incoming_bytes
        - m_receive_buffer_size, boost::int32_t(0));
But m_in_buf_size is initialized as:
m_in_buf_size(1024 * 1024)
and in utp.log it seems never to exceed this value. It does not matter if I set send_socket_buffer_size, recv_socket_buffer_size, send_buffer_watermark to 4 or 100 MiBytes,
m_in_buf_size does not change. Is it really should be like this, or I'm turning the wrong knobs?
ichorid
on 23 Feb 2018
To check it anyway, I manually changed its initialization to:
m_in_buf_size(2*1024 * 1024)
The advertised window size immediately increased to 2 MiBytes:
mtu:1457 in_flight:918243 adv_wnd:2088530 cwnd:918545 acked_bytes:8622 cwnd_full -> 0
However, the connection became unstable: sometimes it would peak at 2,9 Mb/s, and sometimes would drop to 0. The average throughput dropped to 1,2-1,8 Mb/s. The log shows some lost packets:
got SACK first:61285 01110000 our_seq_nr:6228
duplicate_acks:1 fast_resend_seq_nr:61284
acked packet 61286 (1437 bytes) (rtt:800)
duplicate_acks:1 fast_resend_seq_nr:61284
acked packet 61287 (1437 bytes) (rtt:800)
duplicate_acks:1 fast_resend_seq_nr:61284
acked packet 61288 (1437 bytes) (rtt:800)
Lost packet 61284 caused cwnd cut
re-sending packet seq_nr:61284 ack_nr:42559
Here are the plots:
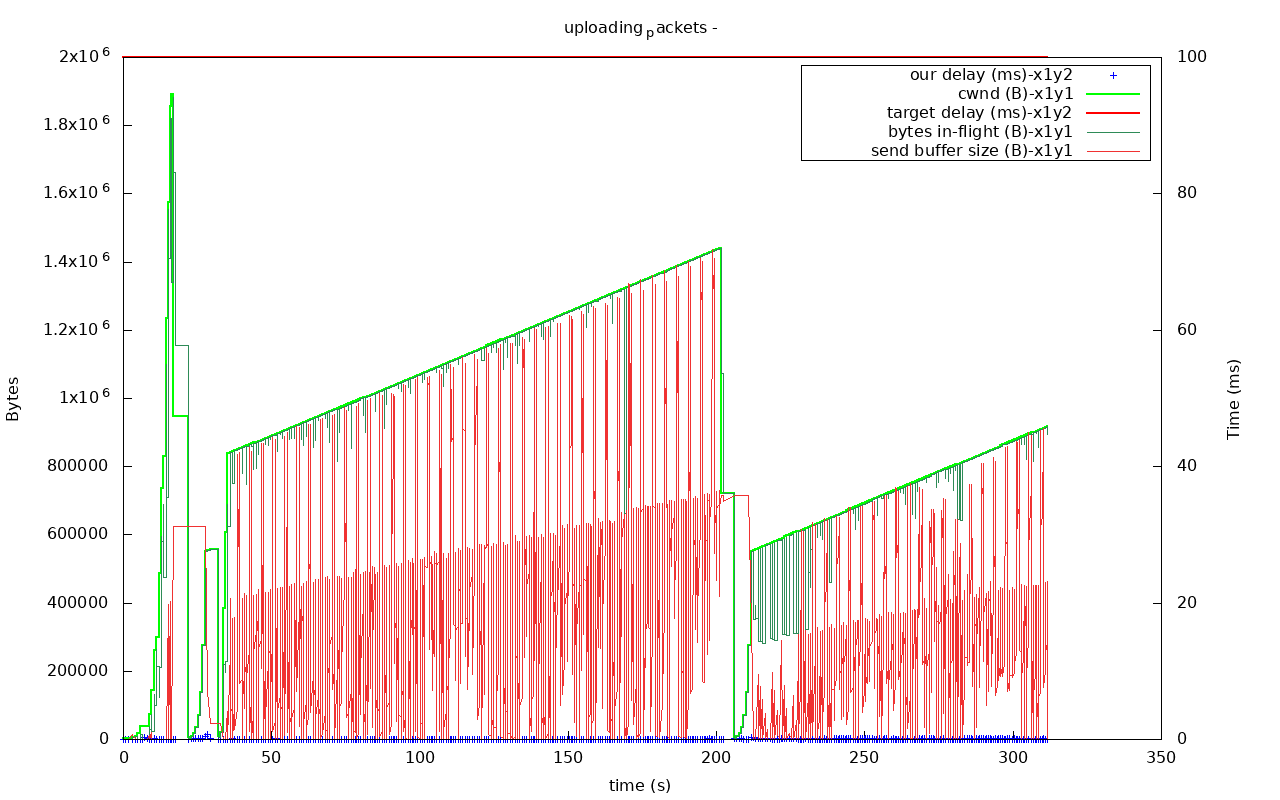
@arvidn, could we really stabilise our connection speed at the levels of these 2,9 Mb/s peaks?
ichorid
on 23 Feb 2018
However, increasing the buffer size through regular settings interface is required to achieve these 2Mb/s speeds. My guess is, the buffer settings somehow are not propagated all the way downwards to utp_socket_imp.
ichorid
on 23 Feb 2018
@arvidn, should I make a libtorrent issue/pull request on that one?
       if (m_bytes_in_flight + payload_size > (std::min)(int(m_cwnd >> 16)
                , int(m_adv_wnd)))
If I increase the buffer further, like to 8Mb, the thing goes to 3,1 Mb/s for a moment, and then dives to 0. And sometimes it even dies completely after that, not able to re-establish the connection.
Something tells me this is not how uTP congestion control is intended to work.
The plots of a run that resulted in dead connection:
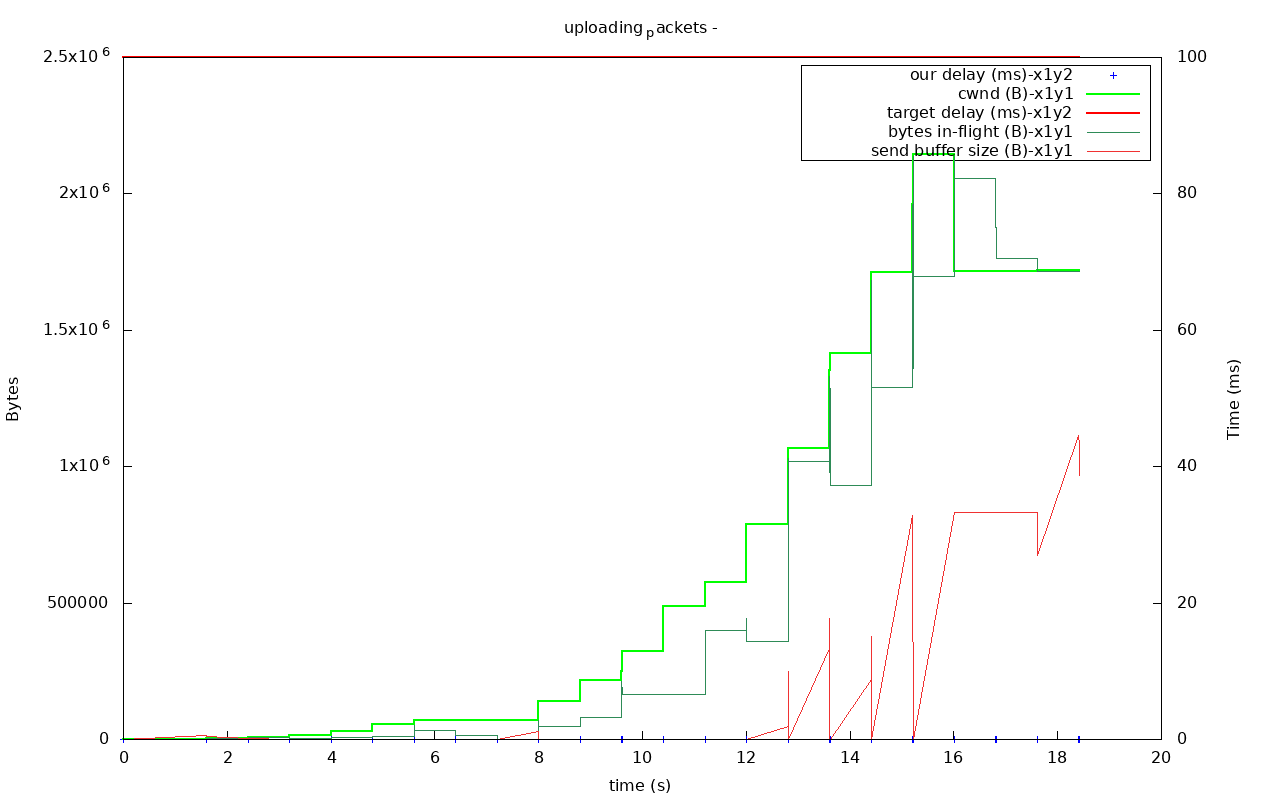
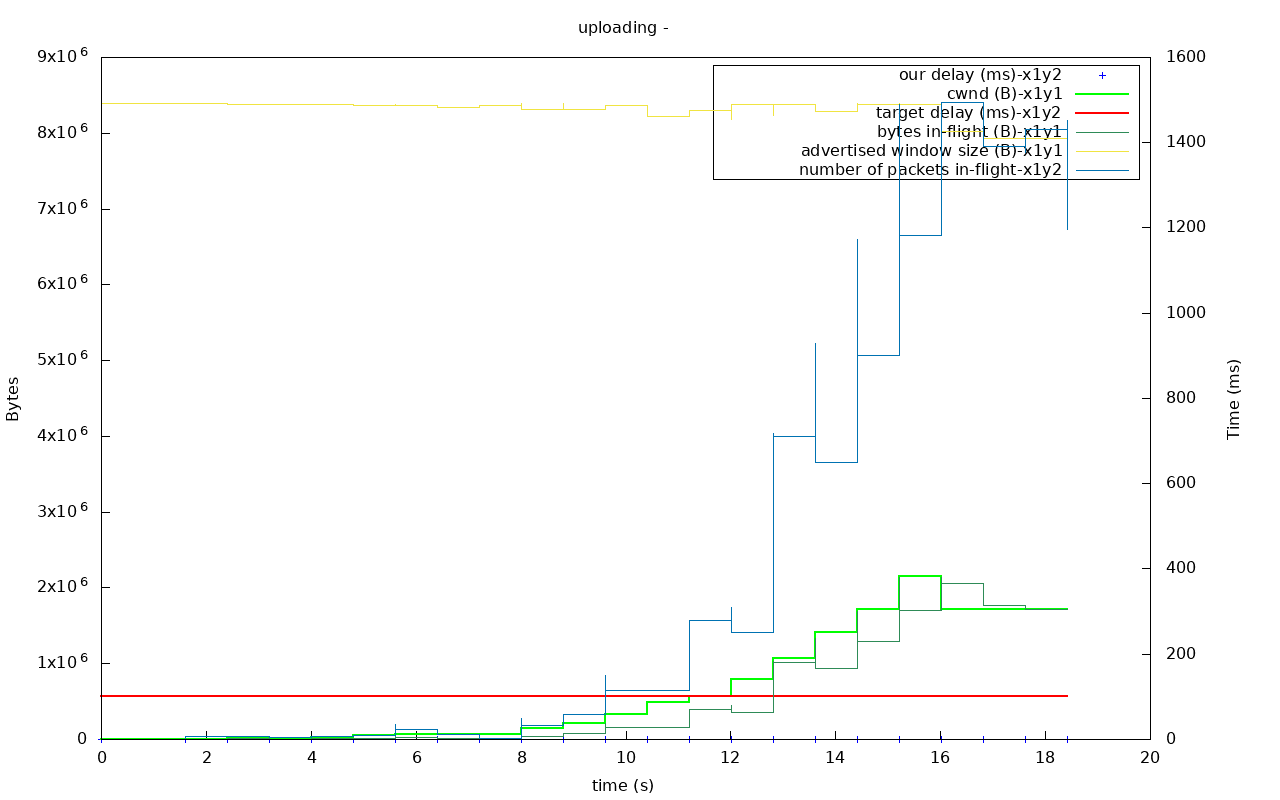
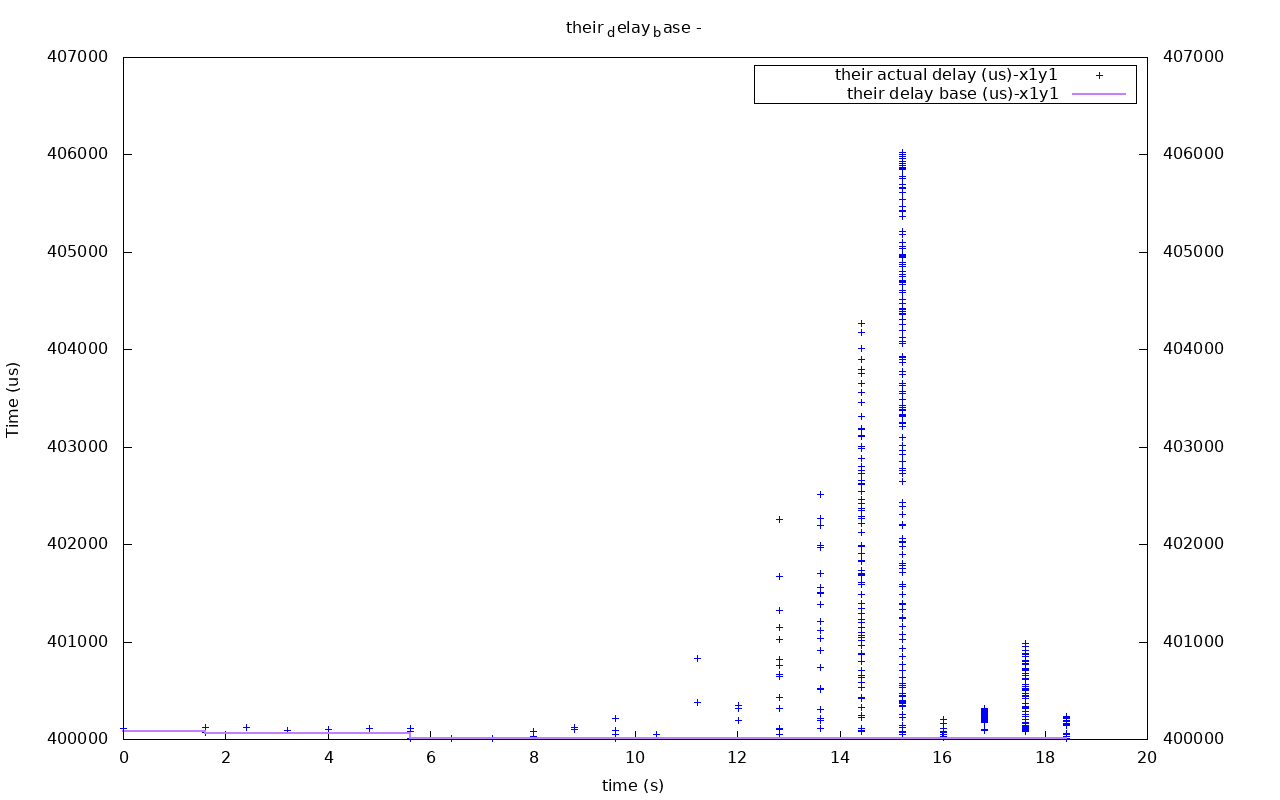
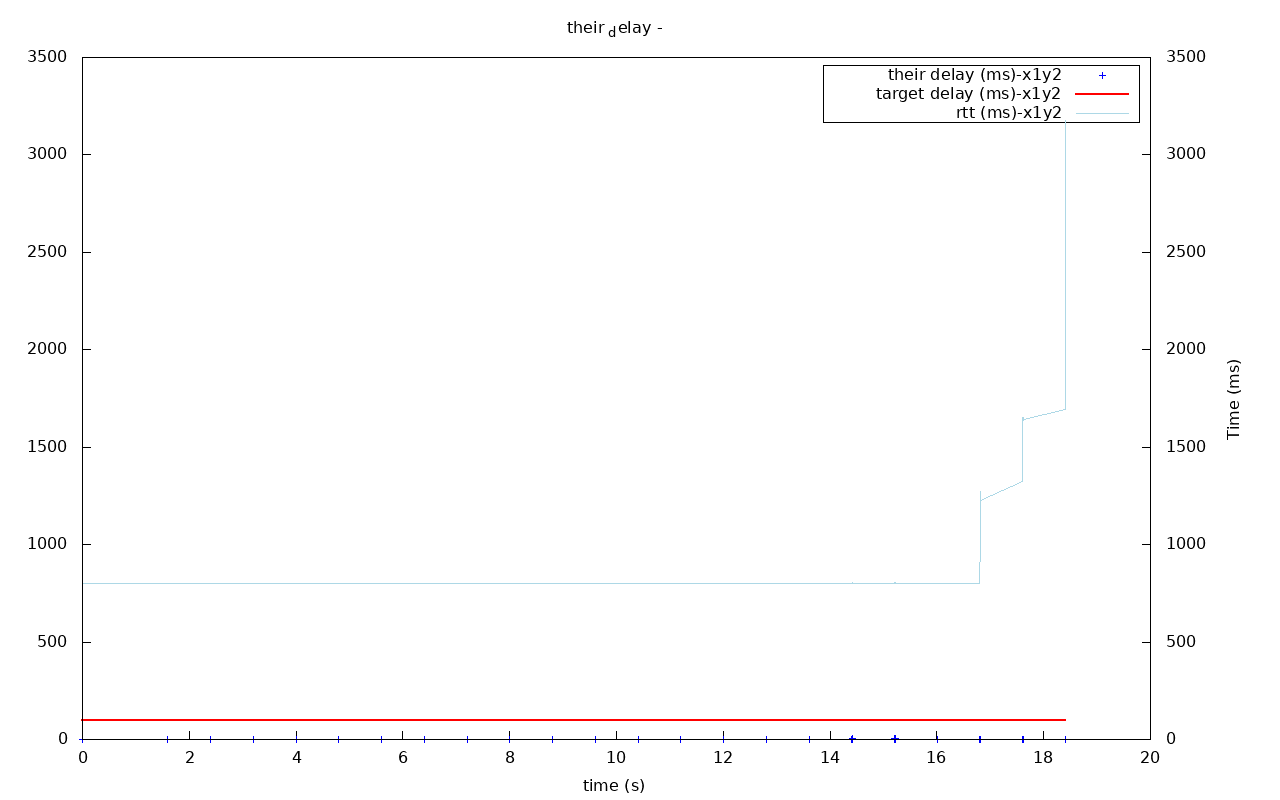
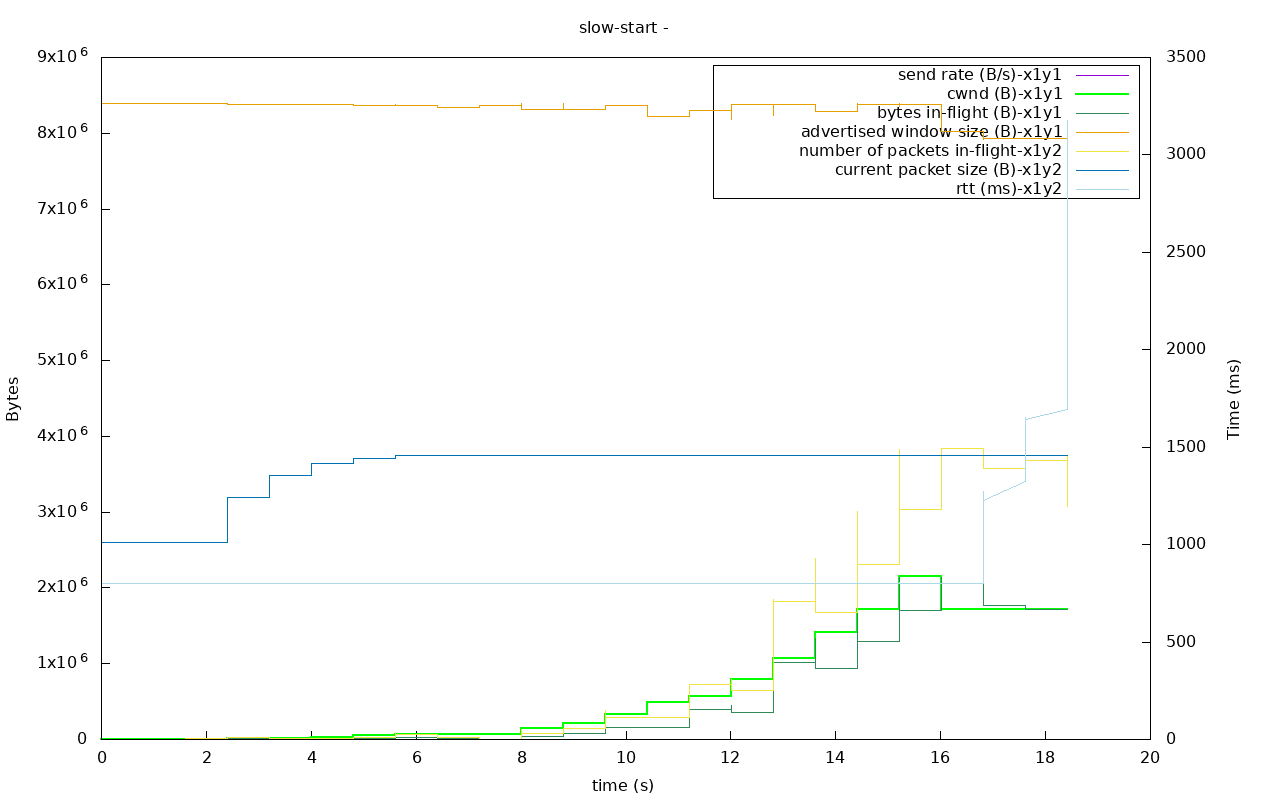
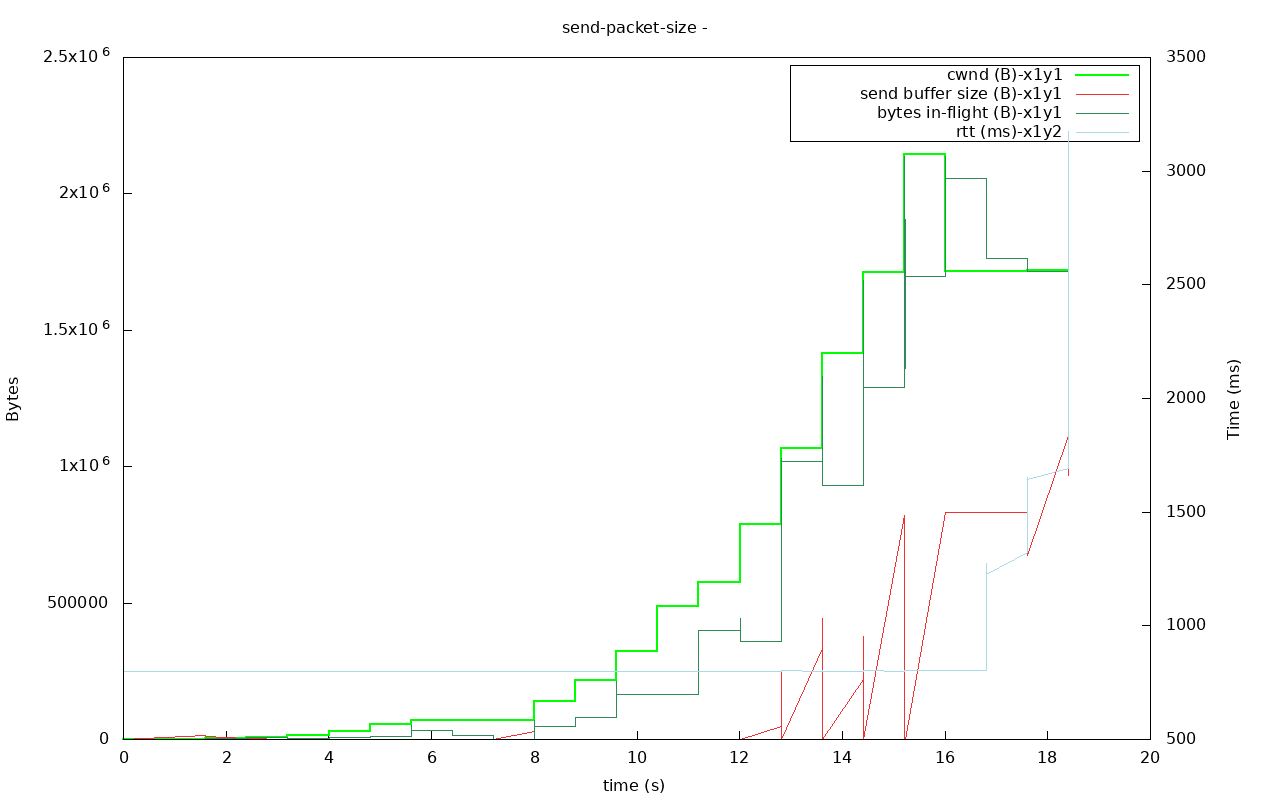
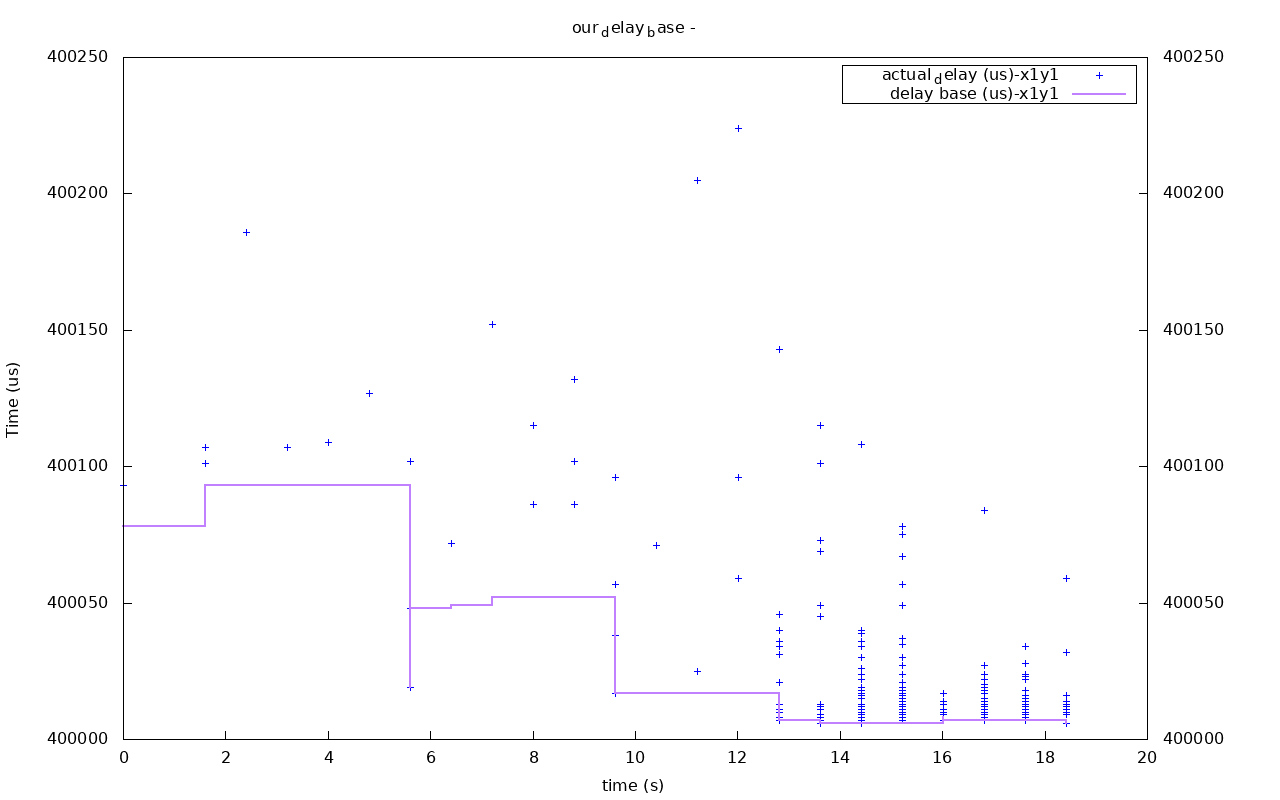
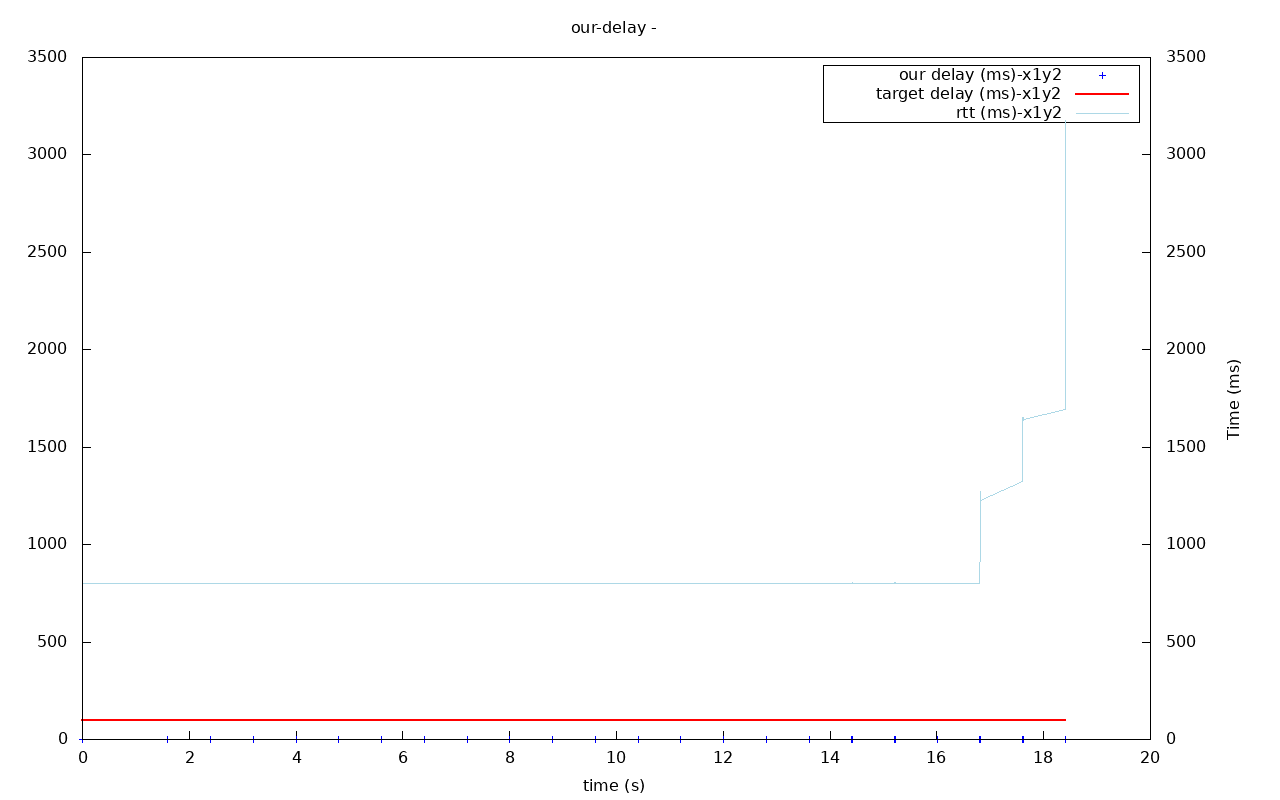
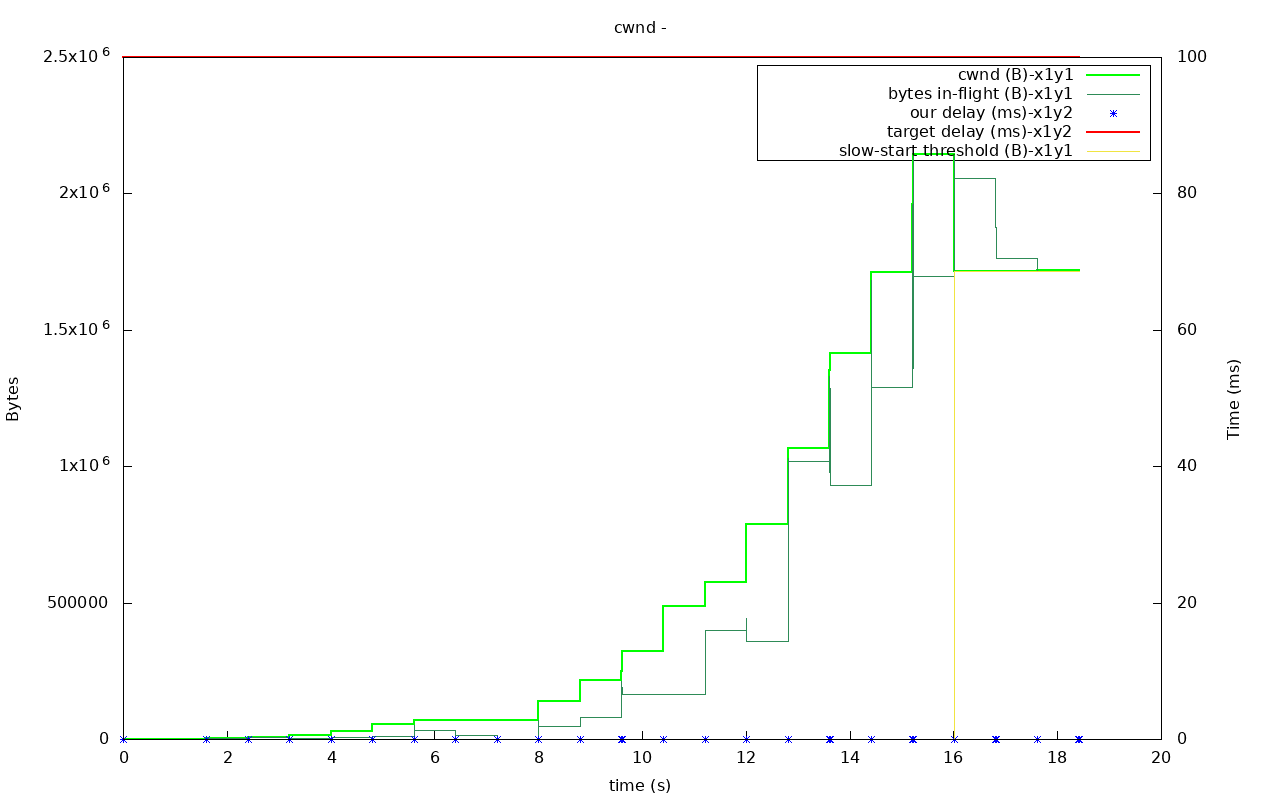
And the log itself:
https://drive.google.com/open?id=1JC0HvzEtOza97USrBw1wpX-nfmFcCl7r
(FYI, when pushing data through netcat in the same setup, the achieved speed is about 2,8 Mb/s.)
ichorid
on 23 Feb 2018
ok. it looks like there are two bugs. the other one being the socket_receive_buffer setting not taking effect at the utp_socket_impl level.
Yes, please make a pull request, ideally with fixes for both of these bugs. Please make it against the RC_1_1 branch, as that's the current stable.
Looking at your new graphs (the penultimate ones you posted), it looks like it's the receiver that's causing the hick-ups. look at the advertised receive window when the connection enters time-out and restart from 0. It has a significant drop every time, suggesting the receiver has a hard time keeping up (which, if it's writing to disk may be understandable). Both when leaving the initial slow start as well as when we get the first packet loss, the advertised receive window drops significantly.
arvidn
on 23 Feb 2018
when you test with netcat, does it do any congestion control or ACKing? or is it just blindly sending packets, no matter whether they're dropped or not?
it looks like there's a burst of packet loss right after the slow-start, and then again at around 200 seconds. I think it's quite reasonable to enter time-out and reset with another slow-start in that case.
arvidn
on 26 Feb 2018
With netcat id depends on its working mode. In default mode it uses TCP with ACKs and everything. It produces 2.8 MB/s. When switched to UDP mode (nc -u), I assume it does not use any kind of link control. It sends packets blindly at rates of dozens of GB/s. One can see it on sender's side s dd stats output. On receiver's side, dd stats show around 30 MB/s of received packets. All the gigabytes are dropped at the sender's queue, but the fascinating thing is, the resulting raw throughput is 10 times higher that that for TCP!
@arvidn, if just we fix this two issues with advertised congestion window in libtorrent, we could actually break low-latency link performance we intended to enhance. The always-fixed 1MB advertised window size "insulated" slow-start mechanism from growing cwnd to dangerous heights. And we have seen what happens when slow-start starts losing packets on these kind of links: it completely freaks out and either falls into "slow-start -> cwnd to 0" oscillating mode, or dies completely.
And if other clients already have buf_size set to higher than default setting. It means that when they move to libtorrent patched with this fix, there won't be this "insulation" of windows size around. So, they could experience the same kind of problem we saw in my last test.
In short, this fix puts much more load on packet loss recovery mechanisms. And from what I have seen here, I'm not sure they work as intended on low-latency links.
So, I need to do more testing to know it would be safe.
ichorid
on 26 Feb 2018
@arvidn, in the seeder log there is some strange things going on. I am not an expert on faretransmit/recovery algorithms, but I guess if the sender side receives at least 3 ACKs, it should trigger an "experienced loss" event. And we can see this kind of behaviour earlier in the logs. But near the end of the log, before thant burst of packet loss and timeout, the sender side does not seem to react to these duplicate ACKs properly. It seems like it does not recognise them as duplicate. This seems as an error to me.
Again, I am no expert here.
Here is the suspicious part of the log (35276 is the sequence number of last received packet):
[000021012791] 0x7fceac00b4d0: incoming packet reply_micro:400018 base_change:0
[000021012791] 0x7fceac00b4d0: updating timeout to: now + 3397
[000021012792] 0x7fceac00b4d0: incoming packet seq_nr:8299 ack_nr:35276 type:ST_DATA id:32832 size:9 timestampdiff:400016 timestamp:1731163045 our ack_nr:8298 our seq_nr:36472 our acked_seq_nr:35276 our state:CO
[000021012793] 0x7fceac00b4d0: incoming: saving packet in receive buffer (9)
[000021012794] 0x7fceac00b4d0: remove inbuf: 8299 (0)
[000021012802] 0x7fceac00b4d0: no space in window send_buffer_size:966748 cwnd:1717774 adv_wnd:8388608 in-flight:1717089 mtu:1457
[000021012803] 0x7fceac00b4d0: skipping send seq_nr:36472 ack_nr:8299 id:32831 target:192.168.0.14:6881 header_size:20 error:Success send_buffer_size:966748 cwnd:1717774 adv_wnd:8388608 in-flight:1717089 mtu:145
[000021012804] 0x7fceac00b4d0: defer ack
[000021012805] 0x7fceac00b4d0: subscribe drained
[000021012811] 0x7fceac00b4d0: no space in window send_buffer_size:966748 cwnd:1717774 adv_wnd:8388608 in-flight:1717089 mtu:1457
[000021012812] 0x7fceac00b4d0: allocating 20 bytes on the stack
[000021012813] 0x7fceac00b4d0: sending packet seq_nr:36472 ack_nr:8299 type:ST_STATE id:32831 target:192.168.0.14:6881 size:20 error:Success send_buffer_size:966748 cwnd:1717774 adv_wnd:8388608 in-flight:1717089
[000021012819] 0x7fceac00b4d0: calling read handler read:0
[000021012820] 0x7fceac00b4d0: calling read handler read:0 ec:Success kill:0
[000021012823] 0x7fceac00b4d0: add_read_buffer 9 bytes
[000021012824]   Didn't fill entire target: 0 bytes left in buffer
[000021012824] 0x7fceac00b4d0: 1 packets moved from buffer to user space (9 bytes)
[000021012828] 0x7fceac00b4d0: new read handler. 0 bytes in buffer
[000021019778] 0x7fceac00b4d0: tick:CONNECTED r: 0 (handler) w: 0 (handler)
[000021519839] 0x7fceac00b4d0: tick:CONNECTED r: 0 (handler) w: 0 (handler)
[000022019875] 0x7fceac00b4d0: tick:CONNECTED r: 0 (handler) w: 0 (handler)
[000022501764] 0x7fceac00b4d0: their_delay::add_sample:400096 prev_base:400008 new_base:400008
[000022501769] 0x7fceac00b4d0: incoming packet reply_micro:400096 base_change:0
[000022501771] 0x7fceac00b4d0: updating timeout to: now + 3397
[000022501772] 0x7fceac00b4d0: incoming packet seq_nr:8299 ack_nr:35276 type:ST_DATA id:32832 size:9 timestampdiff:400014 timestamp:1732651941 our ack_nr:8299 our seq_nr:36472 our acked_seq_nr:35276 our state:CO
[000022501776] 0x7fceac00b4d0: already received seq_nr: 8299
[000022501796] 0x7fceac00b4d0: no space in window send_buffer_size:966748 cwnd:1717774 adv_wnd:8388608 in-flight:1717089 mtu:1457
[000022501805] 0x7fceac00b4d0: skipping send seq_nr:36472 ack_nr:8299 id:32831 target:192.168.0.14:6881 header_size:20 error:Success send_buffer_size:966748 cwnd:1717774 adv_wnd:8388608 in-flight:1717089 mtu:145
[000022501809] 0x7fceac00b4d0: defer ack
[000022501810] 0x7fceac00b4d0: subscribe drained
[000022501828] 0x7fceac00b4d0: no space in window send_buffer_size:966748 cwnd:1717774 adv_wnd:8388608 in-flight:1717089 mtu:1457
[000022501829] 0x7fceac00b4d0: allocating 20 bytes on the stack
[000022501862] 0x7fceac00b4d0: sending packet seq_nr:36472 ack_nr:8299 type:ST_STATE id:32831 target:192.168.0.14:6881 size:20 error:Success send_buffer_size:966748 cwnd:1717774 adv_wnd:8388608 in-flight:1717089
[000022519932] 0x7fceac00b4d0: tick:CONNECTED r: 0 (handler) w: 0 (handler)
[000023019969] 0x7fceac00b4d0: tick:CONNECTED r: 0 (handler) w: 0 (handler)
[000023520007] 0x7fceac00b4d0: tick:CONNECTED r: 0 (handler) w: 0 (handler)
[000024020044] 0x7fceac00b4d0: tick:CONNECTED r: 0 (handler) w: 0 (handler)
[000024520082] 0x7fceac00b4d0: tick:CONNECTED r: 0 (handler) w: 0 (handler)
[000025001950] 0x7fceac00b4d0: their_delay::add_sample:400080 prev_base:400008 new_base:400008
[000025001952] 0x7fceac00b4d0: incoming packet reply_micro:400080 base_change:0
[000025001953] 0x7fceac00b4d0: updating timeout to: now + 3397
[000025001954] 0x7fceac00b4d0: incoming packet seq_nr:8299 ack_nr:35276 type:ST_DATA id:32832 size:9 timestampdiff:400096 timestamp:1735152143 our ack_nr:8299 our seq_nr:36472 our acked_seq_nr:35276 our state:CO
[000025001955] 0x7fceac00b4d0: already received seq_nr: 8299
[000025001966] 0x7fceac00b4d0: no space in window send_buffer_size:966748 cwnd:1717774 adv_wnd:8388608 in-flight:1717089 mtu:1457
[000025001970] 0x7fceac00b4d0: skipping send seq_nr:36472 ack_nr:8299 id:32831 target:192.168.0.14:6881 header_size:20 error:Success send_buffer_size:966748 cwnd:1717774 adv_wnd:8388608 in-flight:1717089 mtu:145
[000025001972] 0x7fceac00b4d0: defer ack
[000025001972] 0x7fceac00b4d0: subscribe drained
[000025001981] 0x7fceac00b4d0: no space in window send_buffer_size:966748 cwnd:1717774 adv_wnd:8388608 in-flight:1717089 mtu:1457
[000025001981] 0x7fceac00b4d0: allocating 20 bytes on the stack
The burst of packet loss happens right after this point. It seems like it is triggered by this non-responsiveness to duplicate ACKs.
ichorid
on 26 Feb 2018
Oh, I see, they are of ST_DATA type, so they don't count as a real ACKs. But is it really like it should be? The leecher's log shows only a single ST_STATE on 35276 was sent back.
Could you please look into it and say if it is OK?
Here it is:
https://drive.google.com/open?id=16TS2btzpyOCJMWFN7aMTOe1AwisEQU9m
ichorid
on 26 Feb 2018
@arvidn, on leecher side there is some interesting sequence in the log:
[000021012042] 0x7ff094009e20: skipping send (no payload and no force) seq_nr:8299 ack_nr:35276 id:32832
[000021012085] 0x7ff094009e20: sending packet seq_nr:8299 ack_nr:35276 type:ST_STATE id:32832
[000021013148] 0x7ff094009e20: sending packet seq_nr:8299 ack_nr:35276 type:ST_DATA id:32832
[000022502055] 0x7ff094009e20: re-sending packet seq_nr:8299 ack_nr:35276 type:ST_DATA id:32832
[000025002258] 0x7ff094009e20: re-sending packet seq_nr:8299 ack_nr:35276 type:ST_DATA id:32832
The packet changes from ST_STATE to ST_DATA and is resent 3 times afterwards. Could it be that these should have been all ST_STATE instead? Could these be the "missing" ACKs?
Like:
ST_STATE -> ST_STATE -> ST_STATEshould trigger recovery, and in does;ST_DATA -> ST_DATA -> ST_DATAshould not trigger recovery, and it does not;ST_STATE -> ST_DATA -> ST_DATAshould trigger recovery, and it does not (or it should be selective ACK or something?).
(Disclaimer: I am not even sure this question makes sense.)
ichorid
on 26 Feb 2018
And it seems max_packet_reorder = 512 is too small for this kind of link. I guess it should scale with in_buf, but it is fixed instead. Or it would break SACKs or something, if it would be variable?
ichorid
on 26 Feb 2018
I have changed max_packet_reorder to 2048, and voilà! The errors ceased and the plots became much more beautiful:
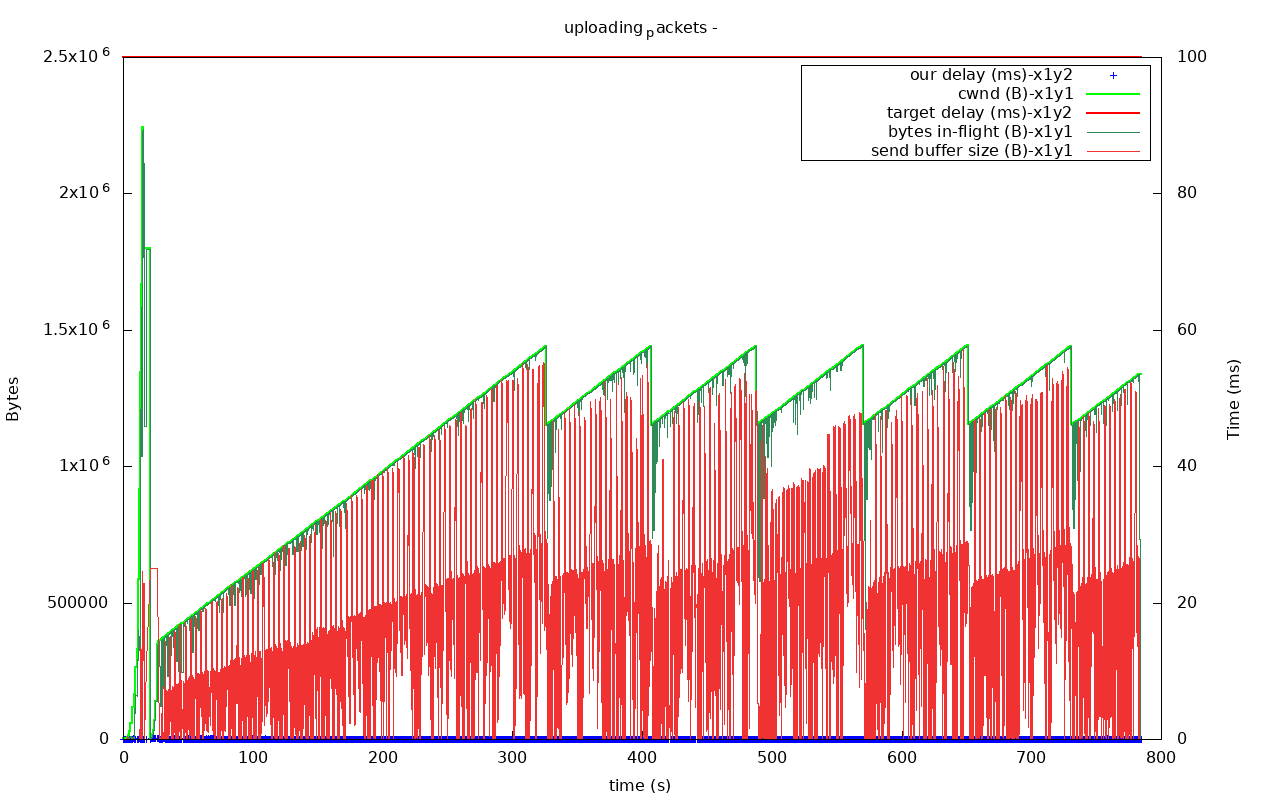
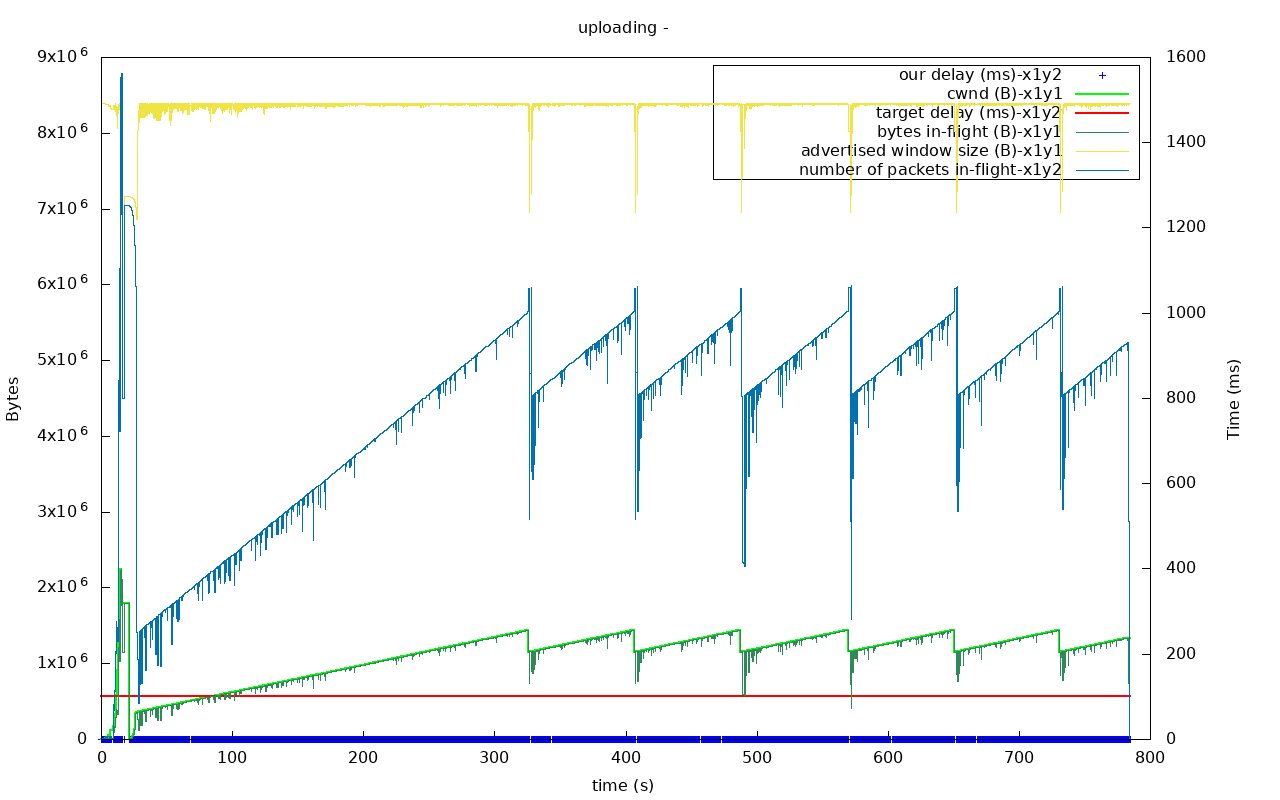
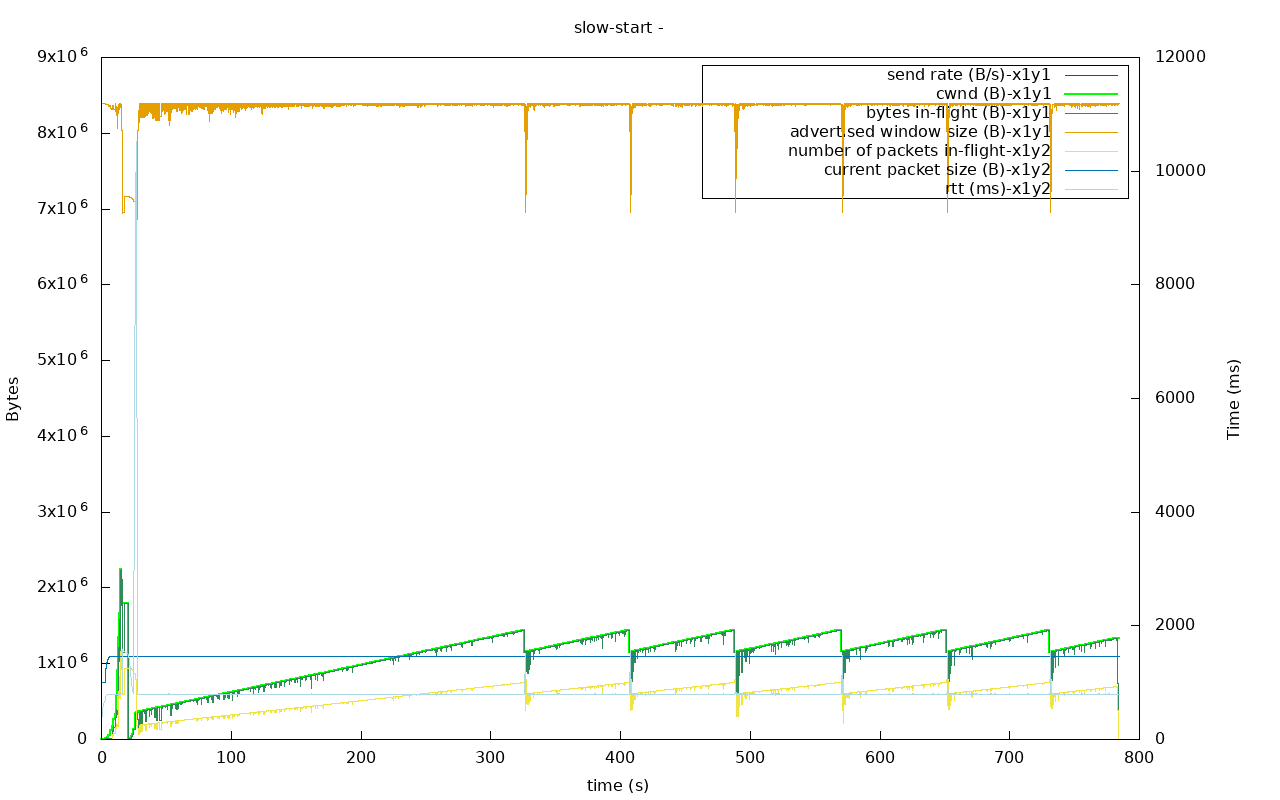
Guess we'll have to expose an option to change max_packet_reorder in settings_pack.
The only obvious problem remaining here is that it is too slow to increase cwnd in linear mode. This obviously happens because the increase happens on ACKs, and these are slow because RTT is so high. I'll try to make it scale with RTT, as an experiment.
ichorid
on 26 Feb 2018
That's a great find!
Do you think it would work to make the reorder buffer size proportional to the receive buffer size? That seems like a reasonable option to base it on, rather than exposing another knob.
One potential hack to work around the initial crash after the first slow start could be to initialize ssthres to 1 MiB, or something. But that's obviously not great, since it wouldn't adapt to new links.
increasing only on ACKs, and hence increase slower on a higher RTT link is an important property. I don't think you can mess too much with that. Having a longer RTT means you need to be more careful since the congestion feedback takes longer to get back.
I think a better approach would be to figure out a way to make slow-start work better, and actually find the capacity quicker.
It looks like the ssthres setting by the initial packet loss may be a bit too conservative. iirc, when we experience loss during slow-start, the ssthres is set to the last cwnd (i.e. half of what it was when we got a loss). Combining this with treating ssthres conservatively, and not increase past it, seems to have the effect of cutting cwnd to a 4th.
arvidn
on 26 Feb 2018
@arvidn, I'm going to prepare the patches. However, my latest experiments revealed another problem: in case of burst packet loss (seeder -> leecher), sequences of SACKs do not trigger fast retransmits beyond the first packet.
This would be no problem, but with high latencies burst packet loss always happens during the first slow_start. Typically, a loss of 300 hundred packets results in mass timeout and drop of thousands of packets, with return back to slow_start mode.
Here are examples from the seeder logs:
[000016809890] 0x7ffa00009df0: got SACK first:9205 0000000000000000 our_seq_nr:10766
[000016809903] 0x7ffa00009df0: Packet 9204 lost. (3 duplicate acks, trigger fast-resend)
[000016809904] 0x7ffa00009df0: Lost packet 9205 caused cwnd cut
[000016809904] 0x7ffa00009df0: experienced loss, slow_start -> 0
[000016809915] 0x7ffa00009df0: re-sending packet seq_nr:9204 ack_nr:46947 type:ST_DATA id:50288 target:192.168.0.14:6881 size:1457 error:Success send_buffer_size:573385 cwnd:1796170 adv_wnd:8365616 in-flight:2244384 mtu:1457 timestamp:598648105 time_diff:400045
[000016809917] 0x7ffa00009df0: incoming packet seq_nr:46948 ack_nr:9203 type:ST_STATE id:50289 size:0 timestampdiff:400015 timestamp:598248043 our ack_nr:46947 our seq_nr:10766 our acked_seq_nr:9203 our state:CONNECTED
[000016809930] 0x7ffa00009df0: no space in window send_buffer_size:573385 cwnd:1796170 adv_wnd:8365616 in-flight:2244384 mtu:1457
[000016809932] 0x7ffa00009df0: skipping send seq_nr:10766 ack_nr:46947 id:50288 target:192.168.0.14:6881 header_size:20 error:Success send_buffer_size:573385 cwnd:1796170 adv_wnd:8365616 in-flight:2244384 mtu:1457 effective-mtu:1457
[000016809935] 0x7ffa00009df0: their_delay::add_sample:400068 prev_base:400014 new_base:400014
[000016809936] 0x7ffa00009df0: incoming packet reply_micro:400068 base_change:0
[000016809936] 0x7ffa00009df0: updating timeout to: now + 809
[000016809937] 0x7ffa00009df0: got SACK first:9205 000000000000000000000000 our_seq_nr:10766
[000016809938] 0x7ffa00009df0: incoming packet seq_nr:46948 ack_nr:9203 type:ST_STATE id:50289 size:0 timestampdiff:400014 timestamp:598248067 our ack_nr:46947 our seq_nr:10766 our acked_seq_nr:9203 our state:CONNECTED
[000016809948] 0x7ffa00009df0: no space in window send_buffer_size:573385 cwnd:1796170 adv_wnd:8362742 in-flight:2244384 mtu:1457
[000016809949] 0x7ffa00009df0: skipping send seq_nr:10766 ack_nr:46947 id:50288 target:192.168.0.14:6881 header_size:20 error:Success send_buffer_size:573385 cwnd:1796170 adv_wnd:8362742 in-flight:2244384 mtu:1457 effective-mtu:1457
[000016809952] 0x7ffa00009df0: their_delay::add_sample:400071 prev_base:400014 new_base:400014
[000016809952] 0x7ffa00009df0: incoming packet reply_micro:400071 base_change:0
[000016809953] 0x7ffa00009df0: updating timeout to: now + 809
[000016809953] 0x7ffa00009df0: got SACK first:9205 000000000000000000000000 our_seq_nr:10766
[000016809954] 0x7ffa00009df0: incoming packet seq_nr:46948 ack_nr:9203 type:ST_STATE id:50289 size:0 timestampdiff:400011 timestamp:598248081 our ack_nr:46947 our seq_nr:10766 our acked_seq_nr:9203 our state:CONNECTED
[000016809964] 0x7ffa00009df0: no space in window send_buffer_size:573385 cwnd:1796170 adv_wnd:8361305 in-flight:2244384 mtu:1457
[000016809965] 0x7ffa00009df0: skipping send seq_nr:10766 ack_nr:46947 id:50288 target:192.168.0.14:6881 header_size:20 error:Success send_buffer_size:573385 cwnd:1796170 adv_wnd:8361305 in-flight:2244384 mtu:1457 effective-mtu:1457
[000016809968] 0x7ffa00009df0: their_delay::add_sample:400061 prev_base:400014 new_base:400014
[000016809968] 0x7ffa00009df0: incoming packet reply_micro:400061 base_change:0
[000016809969] 0x7ffa00009df0: updating timeout to: now + 809
[000016809969] 0x7ffa00009df0: got SACK first:9205 000000000000000000000000 our_seq_nr:10766
[000016809970] 0x7ffa00009df0: incoming packet seq_nr:46948 ack_nr:9203 type:ST_STATE id:50289 size:0 timestampdiff:400009 timestamp:598248107 our ack_nr:46947 our seq_nr:10766 our acked_seq_nr:9203 our state:CONNECTED
[000016809979] 0x7ffa00009df0: no space in window send_buffer_size:573385 cwnd:1796170 adv_wnd:8358431 in-flight:2244384 mtu:1457
[000016809981] 0x7ffa00009df0: skipping send seq_nr:10766 ack_nr:46947 id:50288 target:192.168.0.14:6881 header_size:20 error:Success send_buffer_size:573385 cwnd:1796170 adv_wnd:8358431 in-flight:2244384 mtu:1457 effective-mtu:1457
[000016809983] 0x7ffa00009df0: their_delay::add_sample:400056 prev_base:400014 new_base:400014
[000016809984] 0x7ffa00009df0: incoming packet reply_micro:400056 base_change:0
[000016809984] 0x7ffa00009df0: updating timeout to: now + 809
[000016809990] 0x7ffa00009df0: got SACK first:9205 000000000000000000000000 our_seq_nr:10766
[000016809991] 0x7ffa00009df0: incoming packet seq_nr:46948 ack_nr:9203 type:ST_STATE id:50289 size:0 timestampdiff:400013 timestamp:598248127 our ack_nr:46947 our seq_nr:10766 our acked_seq_nr:9203 our state:CONNECTED
[000016810002] 0x7ffa00009df0: no space in window send_buffer_size:573385 cwnd:1796170 adv_wnd:8356994 in-flight:2244384 mtu:1457
[000016810003] 0x7ffa00009df0: skipping send seq_nr:10766 ack_nr:46947 id:50288 target:192.168.0.14:6881 header_size:20 error:Success send_buffer_size:573385 cwnd:1796170 adv_wnd:8356994 in-flight:2244384 mtu:1457 effective-mtu:1457
[000016810006] 0x7ffa00009df0: their_delay::add_sample:400066 prev_base:400014 new_base:400014
[000016810007] 0x7ffa00009df0: incoming packet reply_micro:400066 base_change:0
This is how it looks like in plots:
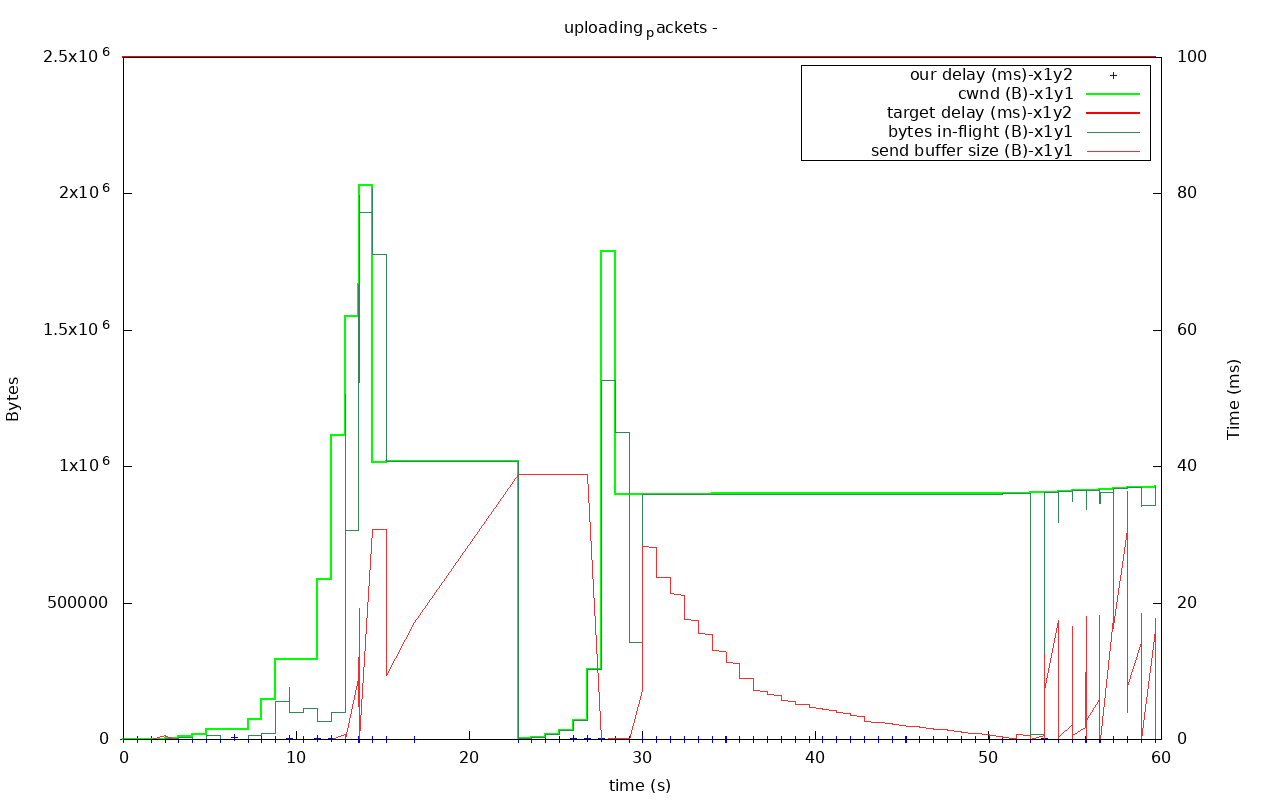
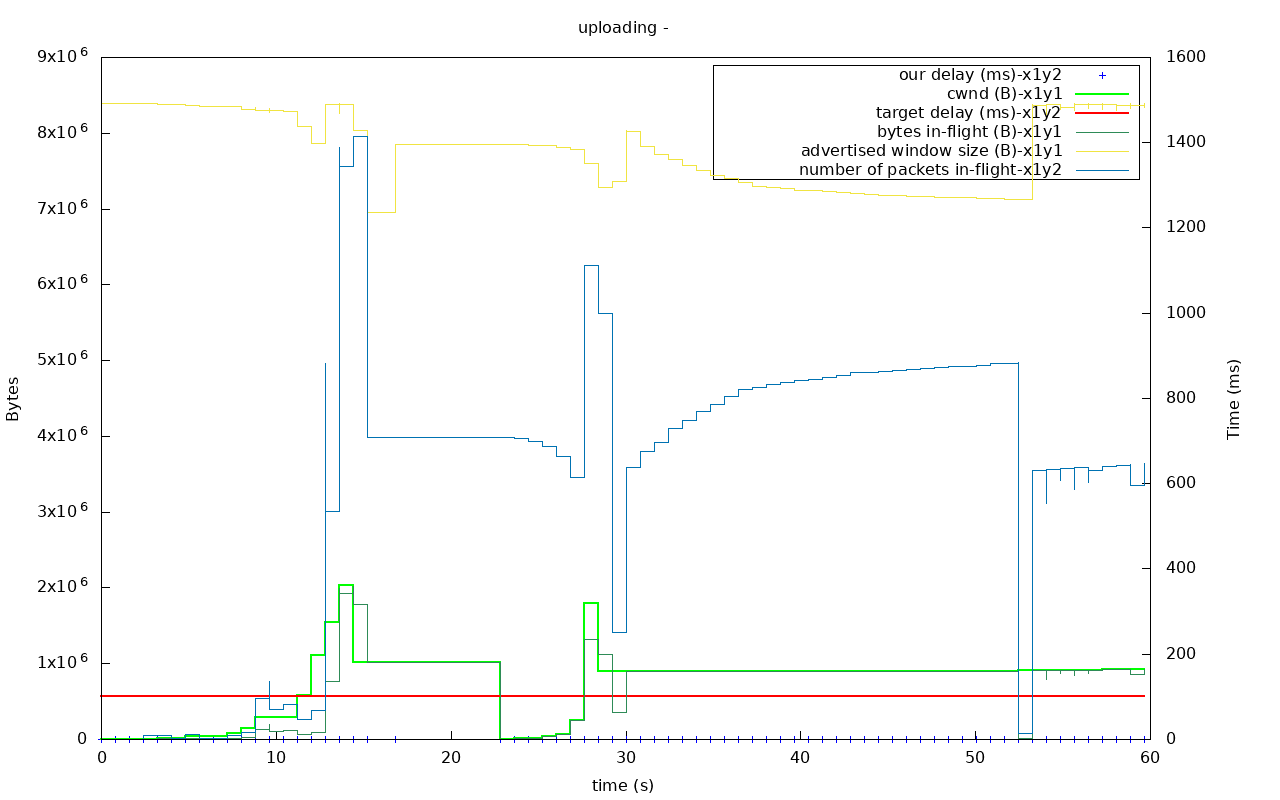
From studying libtorrent code, uTP logs and TCP congestion control papers for two days, I'm starting to suspect this is not the intended behaviour for TCP-Reno-style congestion control. Could you please provide some insight on this issue?
ichorid
on 27 Feb 2018
Created pull request to libtorrent. Yay!
ichorid
on 1 Mar 2018
thanks @ichorid ! sorry for long response times. I've been unusually busy at work (still am). You may have found that there is an attempt at making SACK trigger fast-retransmit by counting the number of ACKed packets after the first unacked (which is implied by the bitmask). I'll take a look at the PR asap.
arvidn
on 1 Mar 2018
@arvidn, you'r welcome ;-))
I guess I found the reason for these strange zero-filled SACKs. The lost sequence of packets in this run was 300+ packets long. And there is a limit on SACK bitfield size in the sender code. If the gap is more than 32*8 packets, it would SACK every packet that fits into these 32*8 bits, and silently ignore the rest:
    int sack = 0;
    if (m_inbuf.size())
    {
        // the SACK bitfield should ideally fit all
        // the pieces we have successfully received
        sack = (m_inbuf.span() + 7) / 8;
        if (sack > 32) sack = 32;
    }
After doing several test runs with setting this to 1300 (pretty randomly), I could say that catastrophic packet loss event is gone, and there are now patterns of exchanging long SACK streams.
The plots became even nicer:
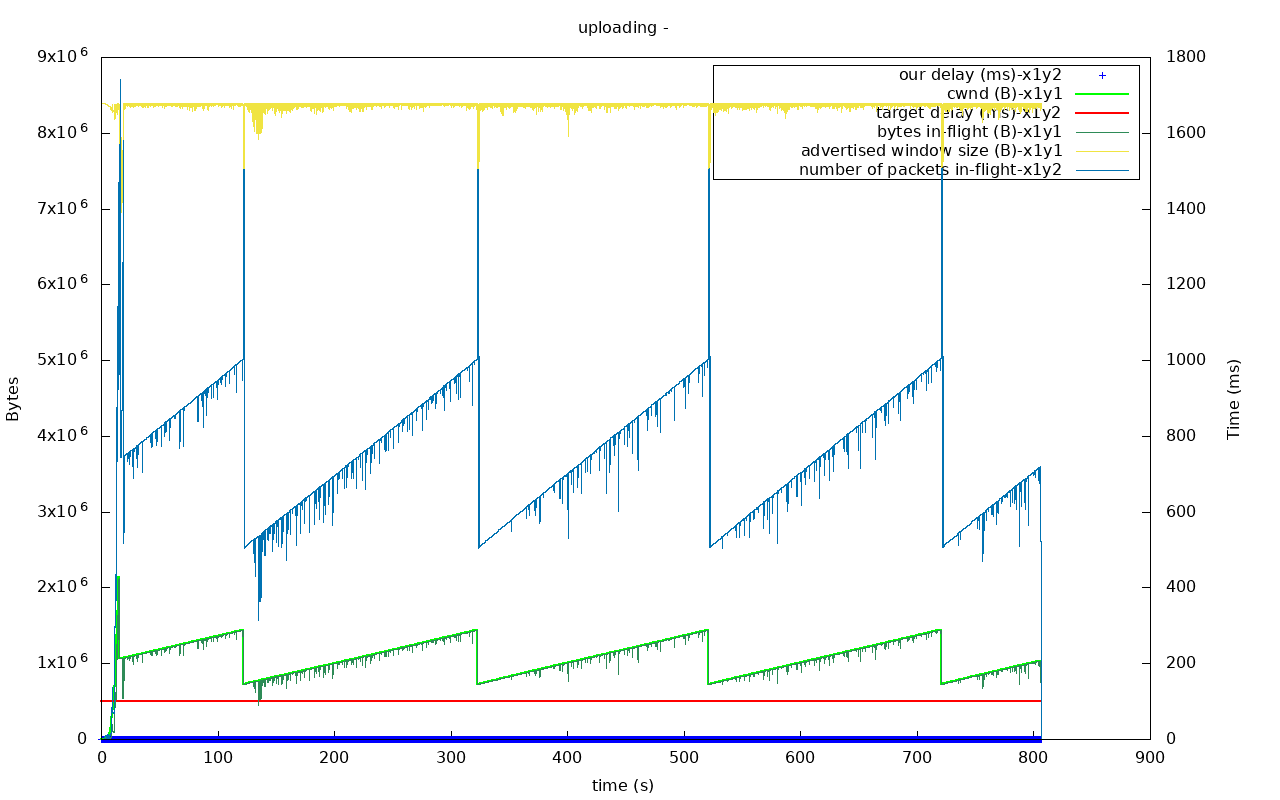
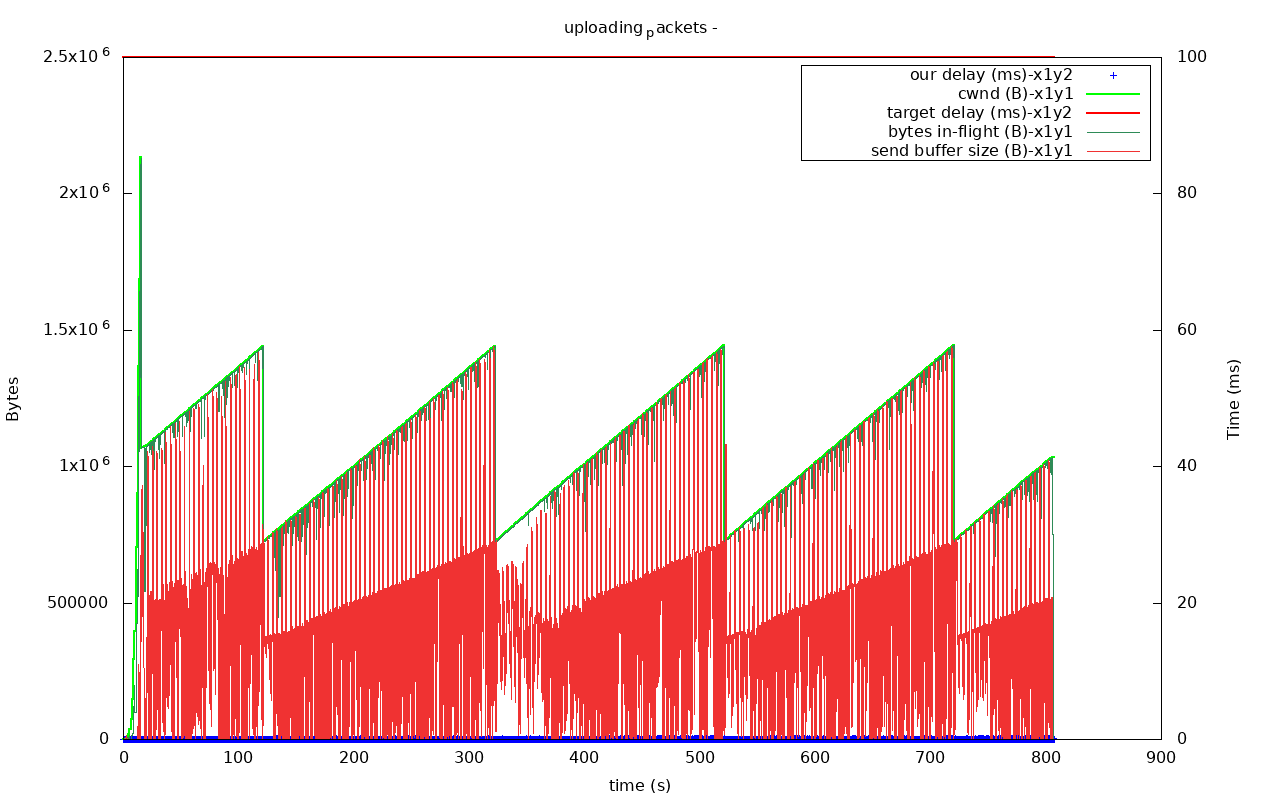
However, the uTP performance (1,1-1,8 MB/s) is still worse than TCP (1,4-2,1 MB/s).
ichorid
on 1 Mar 2018
that's beautiful. great find!
do you think this performance difference can be explained by the system call overhead? I assume you're pegging the CPU in both cases, right?
arvidn
on 1 Mar 2018
@arvidn, the CPU load is almost non-existent under 800ms RTT latencies. It is less than 2% on both seeder and leecher side. So, the problem is still somewhere in the uTP protocol. Maybe that is because there is really no feedback from the channel in the form of latency change. And that is because, well, there is no queue in netem. There are only added delay and stone-wall packet drop when netem buffer overflows. And uTP is less well suited for packet-drop-based congestion control than TCP.
However, with all this effort, we managed to make uTP function properly on 800ms latency link! And it was not even possible before.
Now uTP performs much better under these conditions, and even outperforms TCP on lower latencies!
| RTT Latency | TCP (MB/s) | uTP (MB/s) |
|-------------|------------|------------|
| 50 ms | 8,32 | 19,32 |
| 150 ms | 2,84 | 6,4 |
| 800 ms | 1,63 | 1,26 |
We only need to make sure the patches are done correctly, and won't break anything in long-term.
ichorid
on 2 Mar 2018
I see. In theory, uTP should be slightly more aggressive than TCP on links with no queuing/congestion delay. This is because in the steady additive increase and multiplicative decrease, TCP increments the cwnd by one segment per RTT (iirc, segments being MTU sized), whereas uTP increases by a fixed 3000 bytes (roughly 2 MTUs) per RTT. So, that's under normal MTU sizes and on links that don't cause any delay when there's congestion, but just packet loss.
Now that I'm thinking about it though, TCP most likely will detect that the loopback device has an MTU of 65536 bytes. are you running over loopback now, or is this still in containers?
If so, TCP would be a lot more aggressive, since 64kiB is a lot more than 3000 bytes per RTT.
As I mentioned before, I used to have code to detect the MTU of an interface and adjust it accordingly, but I decided the extra complexity did not warrant the use case (which mostly is tests). If the link you test over has an unusually high MTU, I would suggest trying to lower it to be the normal 1500 bytes.
arvidn
on 2 Mar 2018
@arvidn, these tests were made with containers, usin emulated 1Gb/s Ethernet links. The latency was added on egress on both sides.
ichorid
on 2 Mar 2018
Now we have a problem. For 5ms latency, setting m_in_buf_size to 2 MByte or more results in slow download rate and, eventually, dead connection. Would have to investigate utp.log. Again.
ichorid
on 2 Mar 2018
Doubtful any of this is very helpful now, but my earlier findings seems an echo of what's here:
https://github.com/arvidn/libtorrent/issues/1432#issuecomment-284094829
and
https://github.com/arvidn/libtorrent/issues/1432#issuecomment-286123228
The packet loss that was happening (triggering retransmits) shouldn't have happened in the first place.
It caused immense speed die-offs, slow ramp-up, and ran slowly like it was hitting an invisible speed limit.
A hard-wired Ethernet LAN should have very low noise and very low packet loss in the first place and local loopback (via 127.0.0.1) should have none.
 Seeker2
on 3 Mar 2018
Seeker2
on 3 Mar 2018
@Seeker2, thanks for the links! But from reading that thread I was not able to understand, why those retransmits bothered you in the first place, and what kind of test setup you used? On real links it's perfectly normal to retransmit lost packets - if there was real packet loss, of course.
ichorid
on 3 Mar 2018
Libtorrent RC_1_1 TCP-based performance is much higher than that of 1.1.6! It seems to exploit the virtual nature of LXC "ethernet" interface somehow. Therefore, we need to move to another, more realistic method of network emulation.
Here are the updated results (LXC<->LXC):
| RTT Latency | TCP (MB/s) | uTP (MB/s) | uTP patched (MB/s) |
|------------:|-----------:|-----------:|-------------------:|
| 6 ms | 204,0 | 48,0 | 85,0|
| 50 ms | 46,7 | 9,3 | 19,3 |
| 100 ms | 26,2 | 5,4 | 9,6 |
| 200 ms | 15,8 | 2,7 | 5,0 |
| 800 ms | 3,2 | 0,34 | 1,2 |
ichorid
on 5 Mar 2018
Superficially, it looks like you managed to trigger two different degenerate cases of LEDBAT behavior: base delay doesn’t seem to reset in one, and loss seems to govern in another. I will need to understand the parameters and the scenarios better before I can diagnose what’s going on.
 shalunov
on 12 Mar 2018
shalunov
on 12 Mar 2018
@arvidn, I ran the tests (debug and uTP log enabled) on my not-so-fast workstation, and it seems we hit CPU performance bottleneck for uTP:
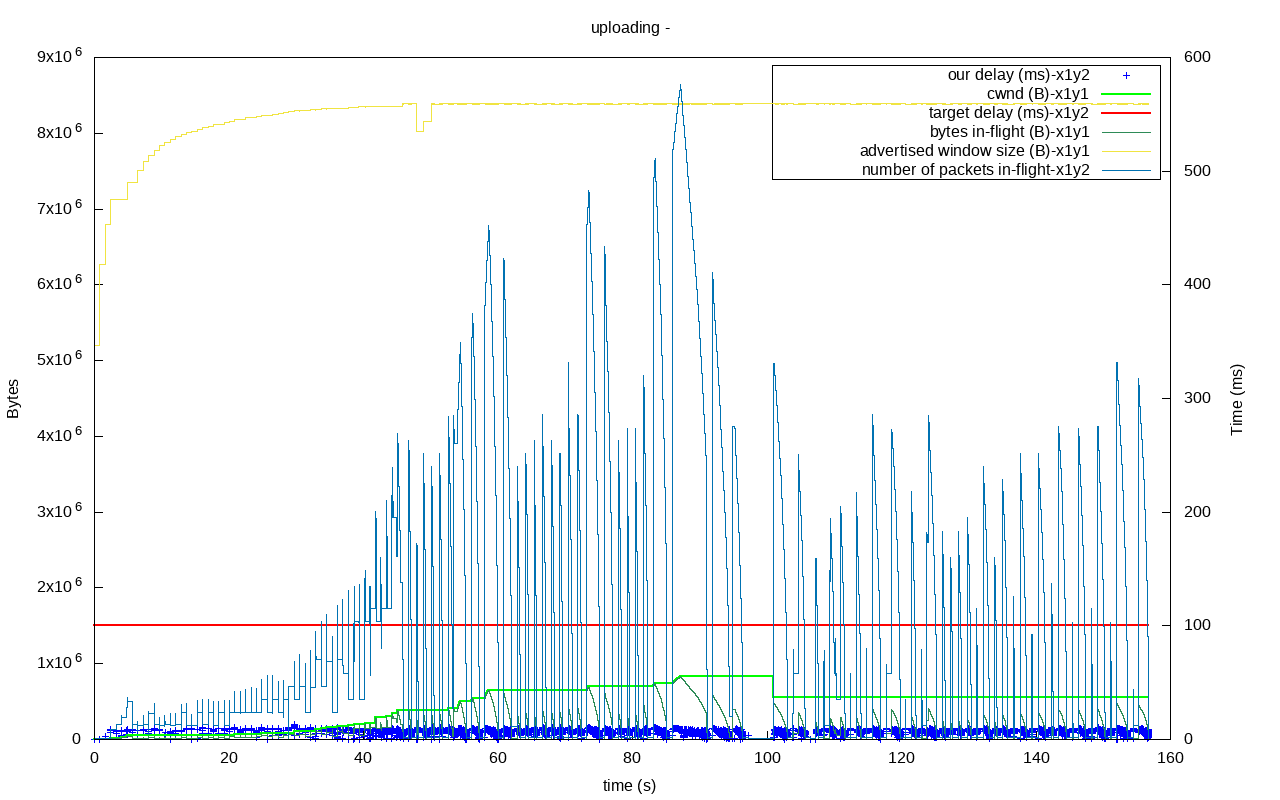
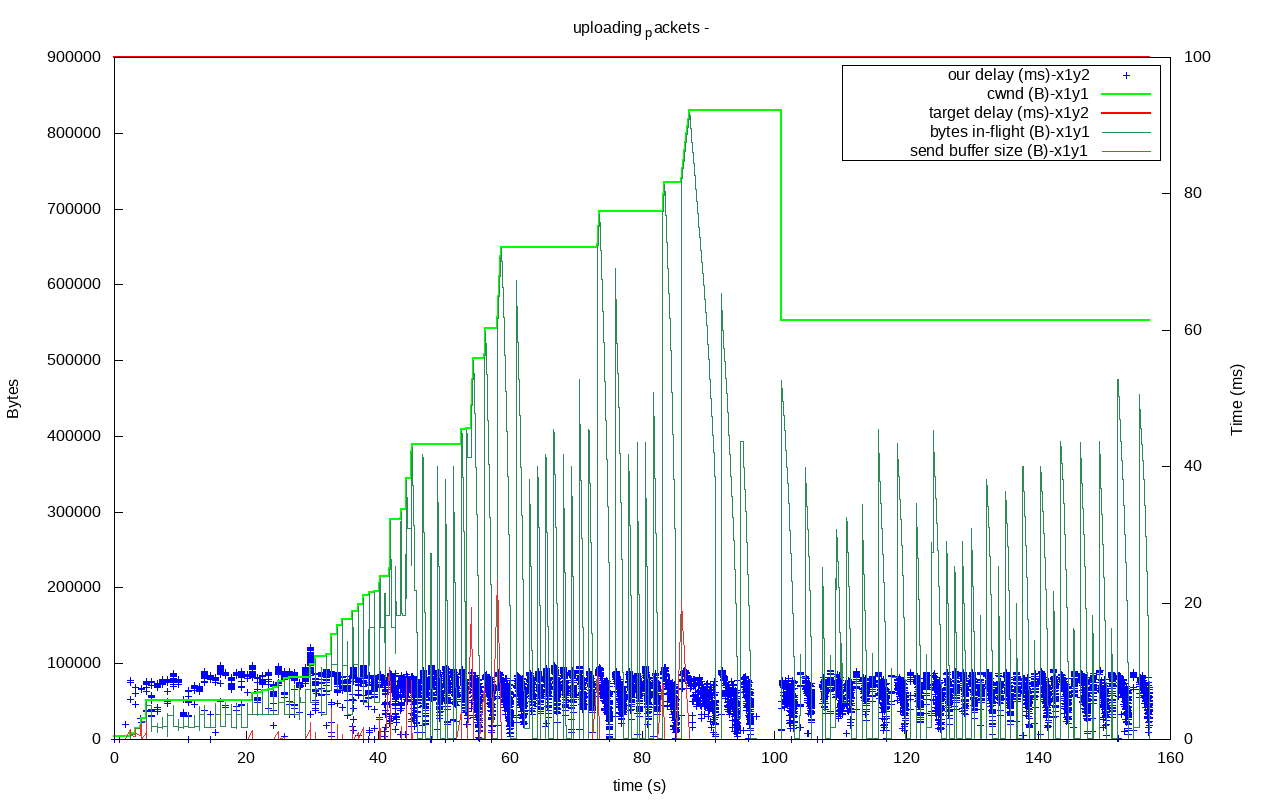
TCP-based performance matches that of the server, but uTP hits 0,3-0,5 MBytes/s ceiling no matter the latency, with 2 CPU threads on seeder side hitting 60-90% load. Sometimes (I guess if the process is scheduled at idle cores or something), uTP hits 5 MBytes/s, but soon drops back to 0,3 MBytes/s.
And this is on a Xeon X5650 machine (2-CPU x6 cores, Westmere 2,67 GHz).
I wonder how Raspberry Pi takes that...
ichorid
on 12 Mar 2018
With debugging/logs disabled, on my PC, it shows results similar to that I had on the server. It seems not every machine is fast enough to profile libtorrent.
ichorid
on 12 Mar 2018
At 200ms(+/-10ms) RTT latency I sometimes can get 3,3 MBytes/s on my PC (no debug/log). But this happens after several minutes of connection ramping up and dropping back to zero. Sometimes it would linger in would even play this "snakes and ladders" for the entire (agonizingly slow) download time.
One important thing to note: when I first set 200ms RTT latency _without_ variance, it quickly goes to 3-5MBytes/s. And if I _then_ add variance, it stays at 3-4MBytes/s.
ichorid
on 12 Mar 2018
A few questions:
- Are these results from an actual tests with a tunnel or a lab setup test? The context seems to be a lab test.
- What is the jitter distribution added? (What is “+/- 10ms”, for example?)
- Can we see an actual distribution of delays through a Tribler tunnel, as measured rather than postulated?
shalunov
on 12 Mar 2018
@shalunov , answering your questions:
- These are lab tests. The setup is two LXC containers running on a single machine. The delay is added via
netemutility. - Jitter distribution is added via
netemoption. Excerpt fromnetemmanual:
       adds the chosen delay to the packets outgoing to chosen network interface.
The optional parameters allow introducing a delay variation and a correlation.
Delay and jitter values are expressed in ms while correlation is percentage.
We add it like this: tc qdisc change dev eth0 root netem delay 100ms 1ms rate 100Mbit. This means that every _outbound_ packet that shoud be sent from eth0 will be subjected to TBF-style rate policing of 100Mbit, and then latency would be added to it according to formula _(L+v)_, where _L=100ms_ in our case, and _v_ varies between +1ms and -1ms according to normal distribution (or whatever authors of netem meant by that).
- It is a good idea to measure this info. I will work on it.
ichorid
on 12 Mar 2018
Usually, network delays follow a highly asymmetric distribution. Near the min/mode, it is often close to exponential, with the tail occasionally fatter. The normal-looking hump only forms under fairly severe congestion, when the correct behavior for LEDBAT is to back off. That is correct, expected, and as designed.
It would be good to see the actual distribution.
Does netem support your choice of distributions for the simulated jitter?
shalunov
on 12 Mar 2018
Ok, I think I got the trail of another one. In do_ledbat() method m_cwnd and scaled_gain are _incommensurable_ . In physics, this is considered a grave error. m_cwnd is measured in bytes, while scaled_gain is a dimensionless quantity.
    const boost::int64_t window_factor = (boost::int64_t(acked_bytes) * (1 << 16)) / in_flight;
    const boost::int64_t delay_factor = (boost::int64_t(target_delay - delay) * (1 << 16)) / target_delay;
    boost::int64_t scaled_gain;
...
    boost::int64_t linear_gain = (window_factor * delay_factor) >> 16;
    linear_gain *= boost::int64_t(m_sm->gain_factor());
...
                scaled_gain = linear_gain;
...
        m_cwnd += scaled_gain;
Besides, the formulas governing the window_factor and delay_factor does not scale with RTT, while being bound to constant target_delay and RTT-dependend in_flight.
ichorid
on 12 Mar 2018
@shalunov , yes netem supports several distributions:
       DELAY := delay TIME [ JITTER [ CORRELATION ]]]
              [ distribution { uniform | normal | pareto |  paretonormal } ]
Pareto sounds like the most useful track of these.
shalunov
on 12 Mar 2018
@shalunov, OK, I'll try to use Pareto and build its plot. It would be very nice to be able to reproduce real-life network properties in lab simulation.
ichorid
on 12 Mar 2018
I think I got the problem.
Congestion window changes on each do_ledbat by adding increase/decrease step (scaled_gain):
m_cwnd += scaled_gain
Now, in linear mode scaled gain is calculated by the formula:
(t-d)/t * a/f,
where:
t - target delay,
d - current delay,
a - bytes acknowledged by the latest ACK,
f - our bytes in flight.
_Scenario 1._
When d is low, and f is high, the connection is stable, because the formula (and thus scaled_gain) produces a relatively small value. This could happen if, with some luck, we had already achieved a high window, and random swings from d (e.g., variance) are small enough.
_Scenario 2._
When d is high and f is low, the window size would oscillate around the point where it was left by slow_start. And chances are high, that it would be a very low point because slow_start stops when it sees that d > t.
_Scenario 3._
When both d is high, and f is high, we could have huge swings in both directions, that would ultimately result in _Scenario 2_, because the d depends on _lowest_ value of delay from current sample range.
ichorid
on 12 Mar 2018
In the complete torture scenario of 600+/-200ms (normal dist), with default settings, BW never does more than 0,03MBytes/s. However, when I set target_delay to 400ms, it goes to sweet 1,1-1,9 MBytes/s. TCP does 3,3-3,8 Mbytes/s in that scenario. So, I guess this uTP performance is the best thing we could ask for.
Now, the question is: should we try to modify libtorrent's LEDBAT implementation to be able to adapt to such harsh conditions automatically, or we could just do away with setting target_delay high enough in Tribler?
ichorid
on 13 Mar 2018
If you expect +/- 200ms of non-congestive delay, I think you should raise the target delay in Tribler. But what would you expect to cause such delay if it isn't congestion? It wouldn't be enough for the tunnel implementation to be inefficient, as it would (presumably) be consistently inefficient.
arvidn
on 13 Mar 2018
in the previous post, your description of how the congestion window is adjusted is correct. That's how it's supposed to work. I don't think there are any problems with it, but it sounds like you do. If so, would you mind elaborating on which behavior you think is wrong?
Another (I think simpler) way of looking at that formula is this:
- Each round trip, the cwnd i increased or decreased by no more than
gain_factor(which I think is somewhere around 3000 bytes) - Whether it's increased or decreased, and by how much, depends on the signed difference between the target delay and the current one-way delay. i.e. when the delay is above target, we decrease cwnd and vice versa. This is called
delay_factor. - This adjustment is supposed to happen once per round-trip. This is similar to how TCP adjusts its cwnd, and ensures that we don't adjust it faster than we can get feedback from the other end. Instead of using the time-domain for this, a more accurate and predictable metric is to consider all bytes-in-flight as one round-trip, and the number of bytes that were just ACKed by this message, the portion of the RTT this
cwndadjustment represents. So the acked-bytes / bytes-in-flight is therefore calledwindow_factor.
The final change to cwnd is gain_factor * delay_factor * window_factor.
Now, this is made a bit more complicated by the slow-start logic in there, as well as the logic to detect whether the sender is not saturating the current cwnd, in which case we don't keep growing it indefinitely.
arvidn
on 13 Mar 2018
@arvidn, I expect a widely variable delay caused by other connections maintained by intermediate peers. I would not expect latency added by these intermediate peers to have the distribution similar to that of the typical Internet router. These peers are regular PCs or seedboxes, with their connection always filled to the point of congestion, ruled by quite un-sophisticated queue management algorithms. Besides, there are always 2-3 of them in the way, producing a superposition of latency distributions. So, I assume the (almost) worst possible case - the normal distribution.
As was noted by @shalunov, to be sure, I should get the distribution from a real tunnel connection on Tribler.
ichorid
on 13 Mar 2018
@arvidn, regarding your question on LEDBAT scaled_gain formula, I'm not ready to answer it yet.
A brief mathematical analysis of it showed that the formula could produce very unstable behavior when delay-target_delay difference becomes large enough. This is a result of having a feedback loop, introduced in the form of dependence on bytes_in_flight.
Again, I'm no expert on differential equations and stability analysis, so I need to recheck everything several times.
ichorid
on 13 Mar 2018
These are plots from several experiments running Tribler -> client_test connection with different number of hops.
Single hop, our exit node under load:


Three hops:


ichorid
on 20 Mar 2018
From these plots, it is obvious that we are not limited by the window size. Instead, we are limited by packet loss and overall instability of connection (and probably by buffer bloat).
TCP-style protocol's performance is a product of bandwidth, (inverted) latency, and (inverted) packet loss. The problem is:
- the bandwidth to the target peer is bottlenecked by the smallest bandwidth in the circuit;
- the latency is the sum of all latencies in the circuit, amplified by buffer bloat effects.
- the packet loss probability is the product of loss probabilities in the circuit.
TCP performance

Traditional congestion control and error correction do not work in these circumstances, and we are not going to invent our own.
Instead, we can utilize Tribler peer network to simultaneously create several circuits to a single peer, for a single download. We could gradually create new circuits/connections until the download speed stops growing: that would signal that either leecher's or seeder's uplink bandwidth is saturated.

ichorid
on 20 Mar 2018
latency is the sum of all latencies in the circuit, amplified by buffer bloat effects.
Great progress again. Solid performance plots. With tokens we will move to online resource utilization of below 10%! There is strong evidence for that, please ensure to understand Figure 6 in our measurement study. Relays, seeds and exit nodes will be mostly idle when they demand payments. No premature optimizations please.
Slowly we're are getting to the heart of the problems and fixing them. This is not a buffer bloat problem I believe, but a CPU overload problem. Just saw a "htop" of these boxes. We lack load management, rejection of excess request or anything at the exit nodes. These boxes are moving TeraBytes per day and are chronically overloaded, leading to slow servicing of requests. A simple heuristic of rejecting new circuits when overloaded (cpu >85%, core pegging) is likely to dramatically clear up everything. But first we need that token economy to work..
synctext
on 21 Mar 2018
math model of oversupply economy: https://onlinelibrary.wiley.com/doi/epdf/10.1002/cpe.2856
synctext
on 21 Mar 2018
That’s pretty heavy congestive+processing delay. The LEDBAT algorithm seems to correctly respond by slowing down as designed. Throwing more traffic at the overloaded relay nodes (with whatever mechanism—parameter adjustment or not) would not make them have more capacity. I would leave the parameters at defaults and figure out where the delays are coming from and why.
shalunov
on 21 Mar 2018
Related issues
 grandpaul
·
10Comments
grandpaul
·
10Comments
 filicado
·
9Comments
synctext
·
11Comments
filicado
·
9Comments
synctext
·
11Comments
 hbiyik
·
5Comments
devos50
·
7Comments
hbiyik
·
5Comments
devos50
·
7Comments
Most helpful comment
Created pull request to libtorrent. Yay!