tmap: define 0 as the midpoint for divergent colors
I have asked this question on Stack Overflow and I will highly appreciate your help.
=======================================================
In the plot below (you can download the raster file from here), I want values below and above zero to have different colors. I got this plot
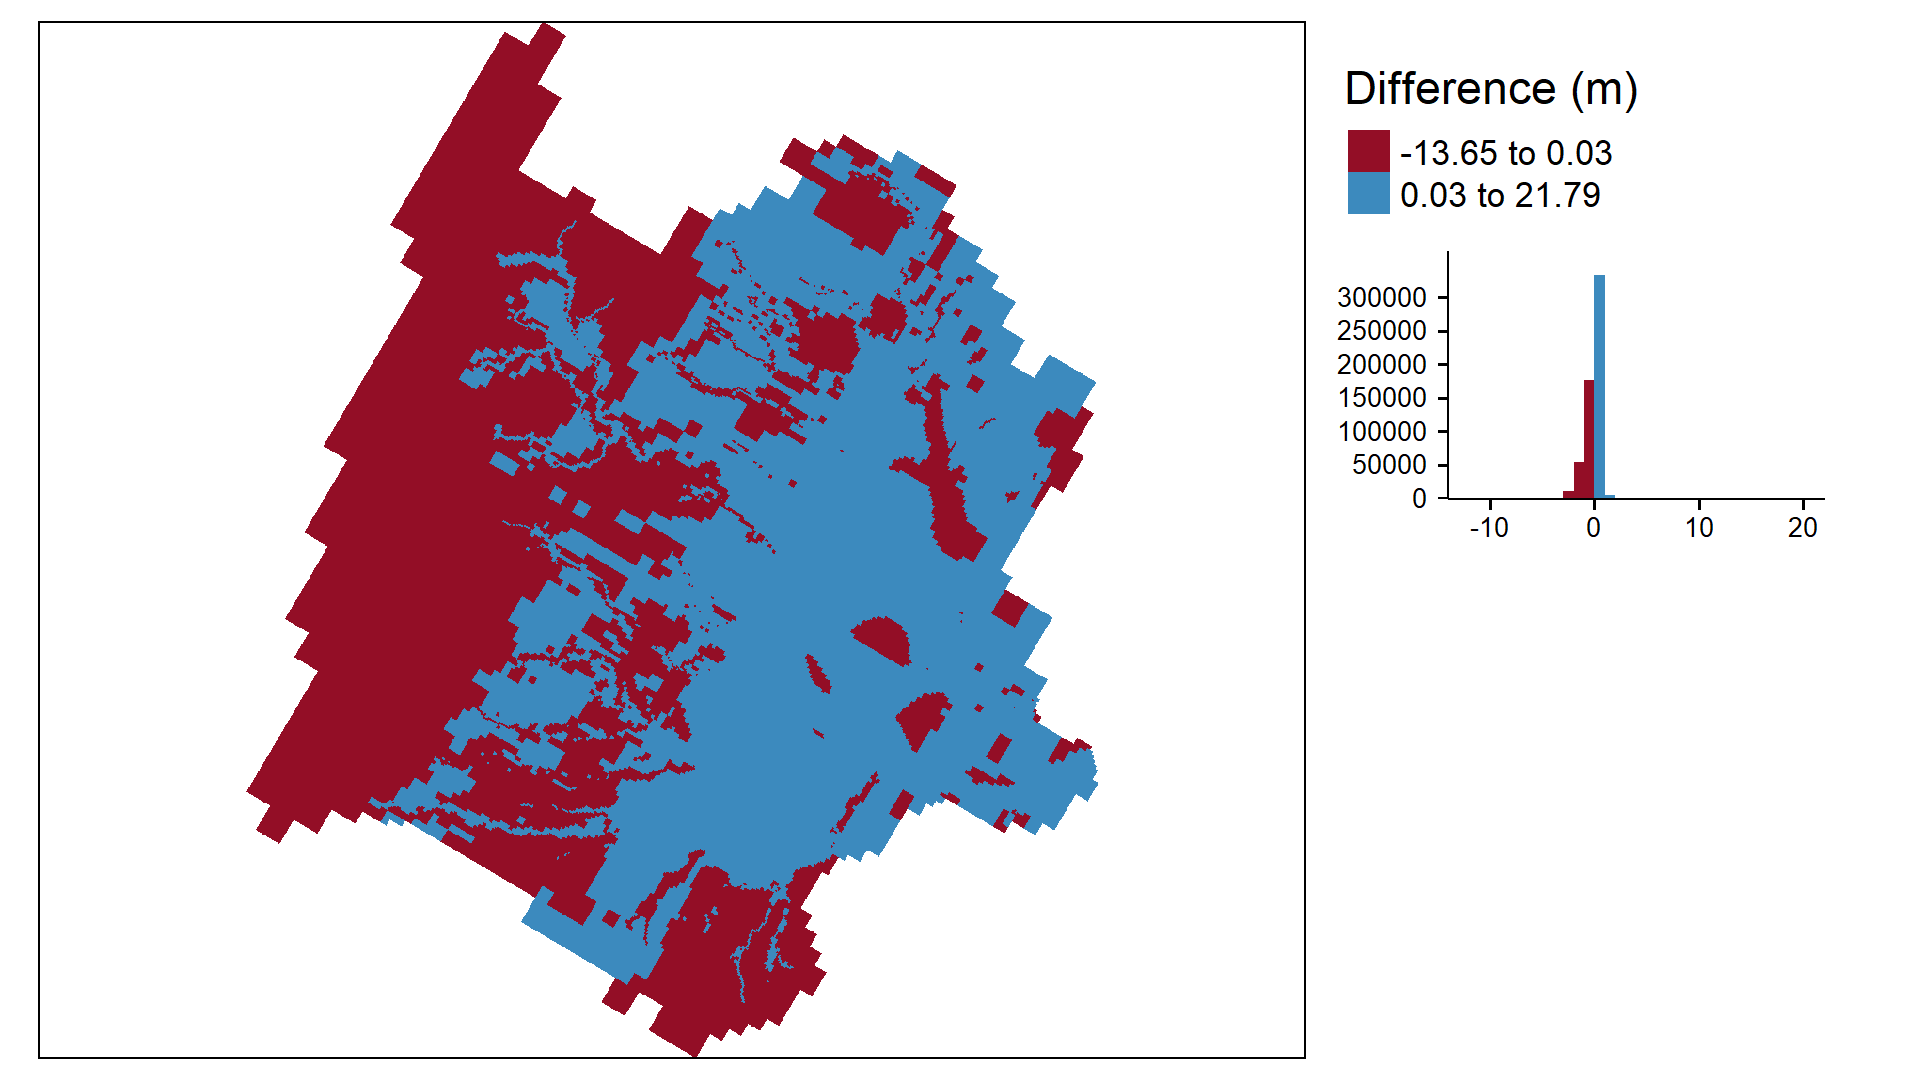
using this script
library(raster)
library(tmap)
diff <- raster("difference.tif")
cols <-get_brewer_pal("RdBu", n = 2, contrast = c(0, 0.65))

plot <-
  tm_shape(diff) +
  tm_raster(style = "quantile",
            n= 2,
            title = "Difference (m)",
            palette = cols,
            legend.hist = TRUE)+
  tm_legend(outside = TRUE, hist.width = 1)
plot
In order to make colours different above and below zero (make zero the midpoint), I had to define the breaks
breaks_diff <- c(minValue(diff), 0, maxValue(diff))
plot1 <-
  tm_shape(diff) +
  tm_raster(breaks = breaks_diff,
            palette = cols,
            title = "Difference (m)",
            legend.hist = TRUE
  )+
  tm_legend(outside = TRUE, hist.width = 1)

plot1
which gave this plot
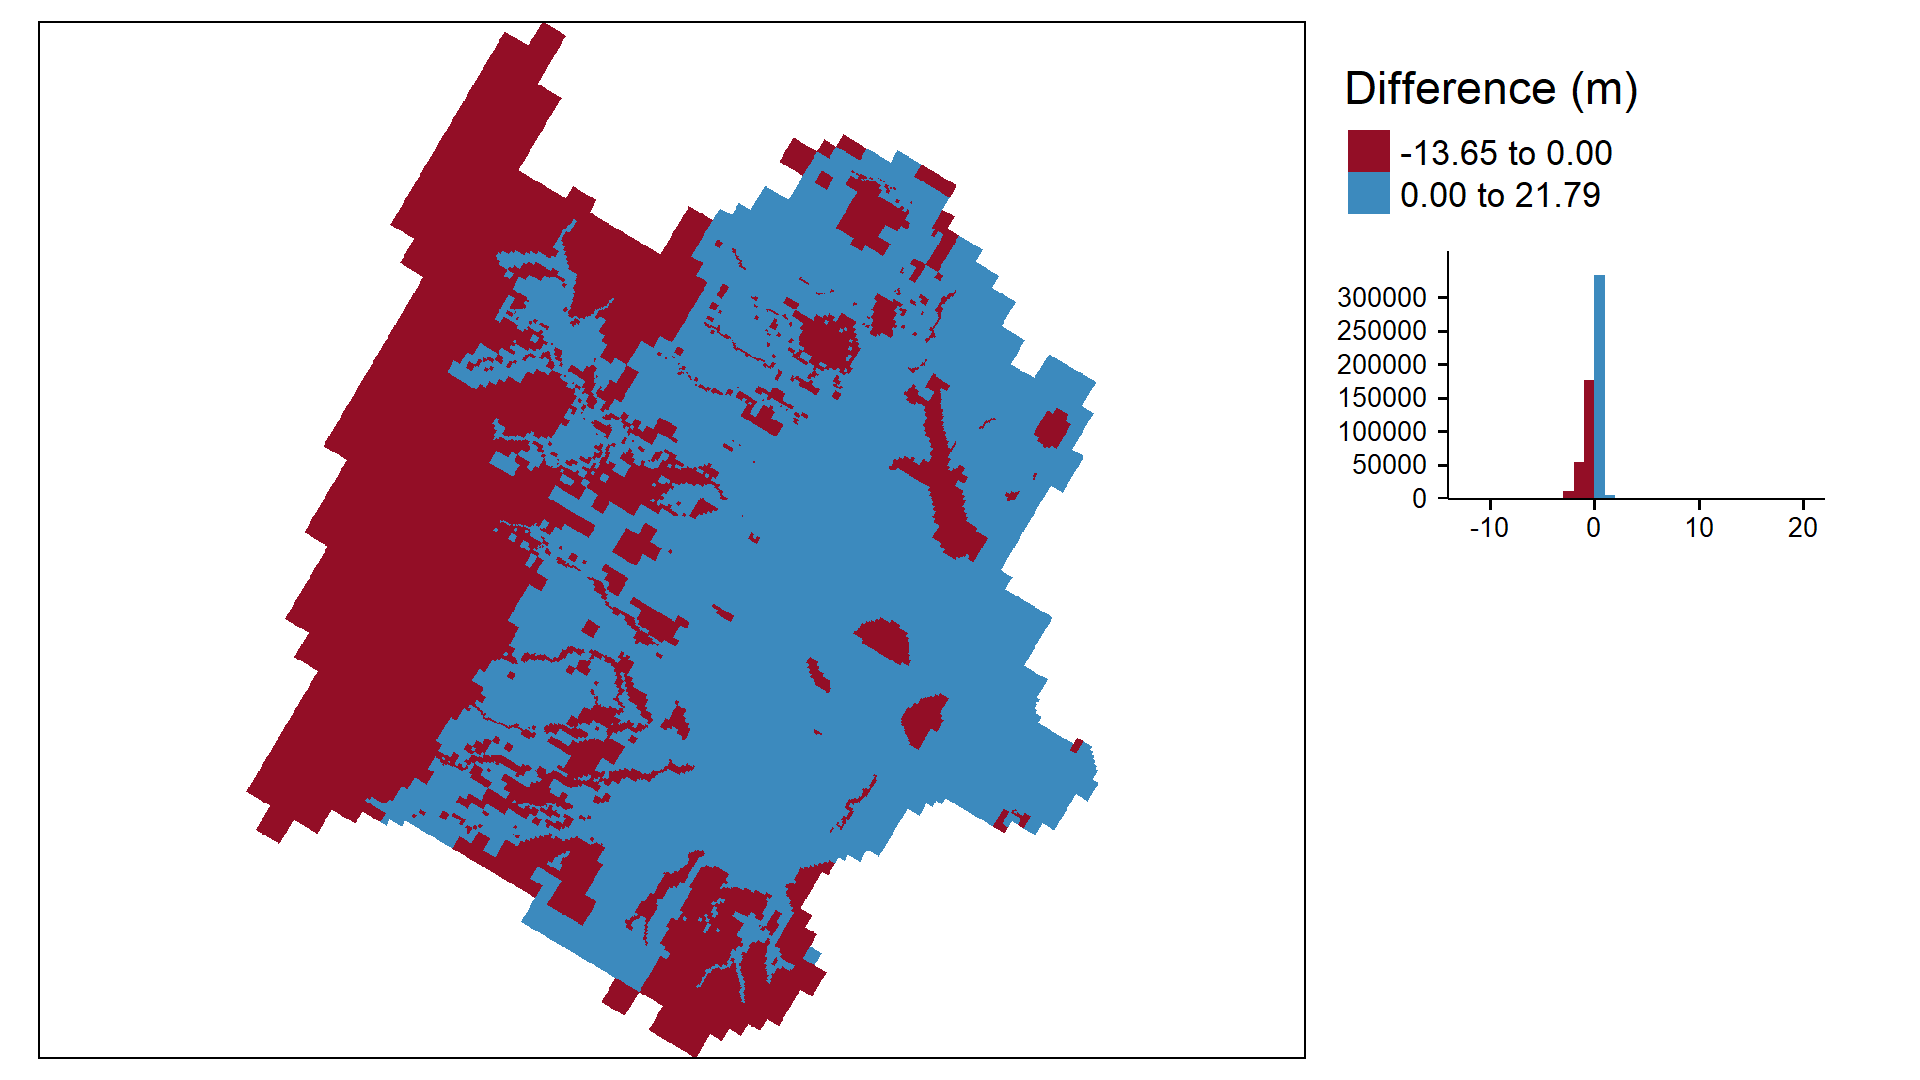
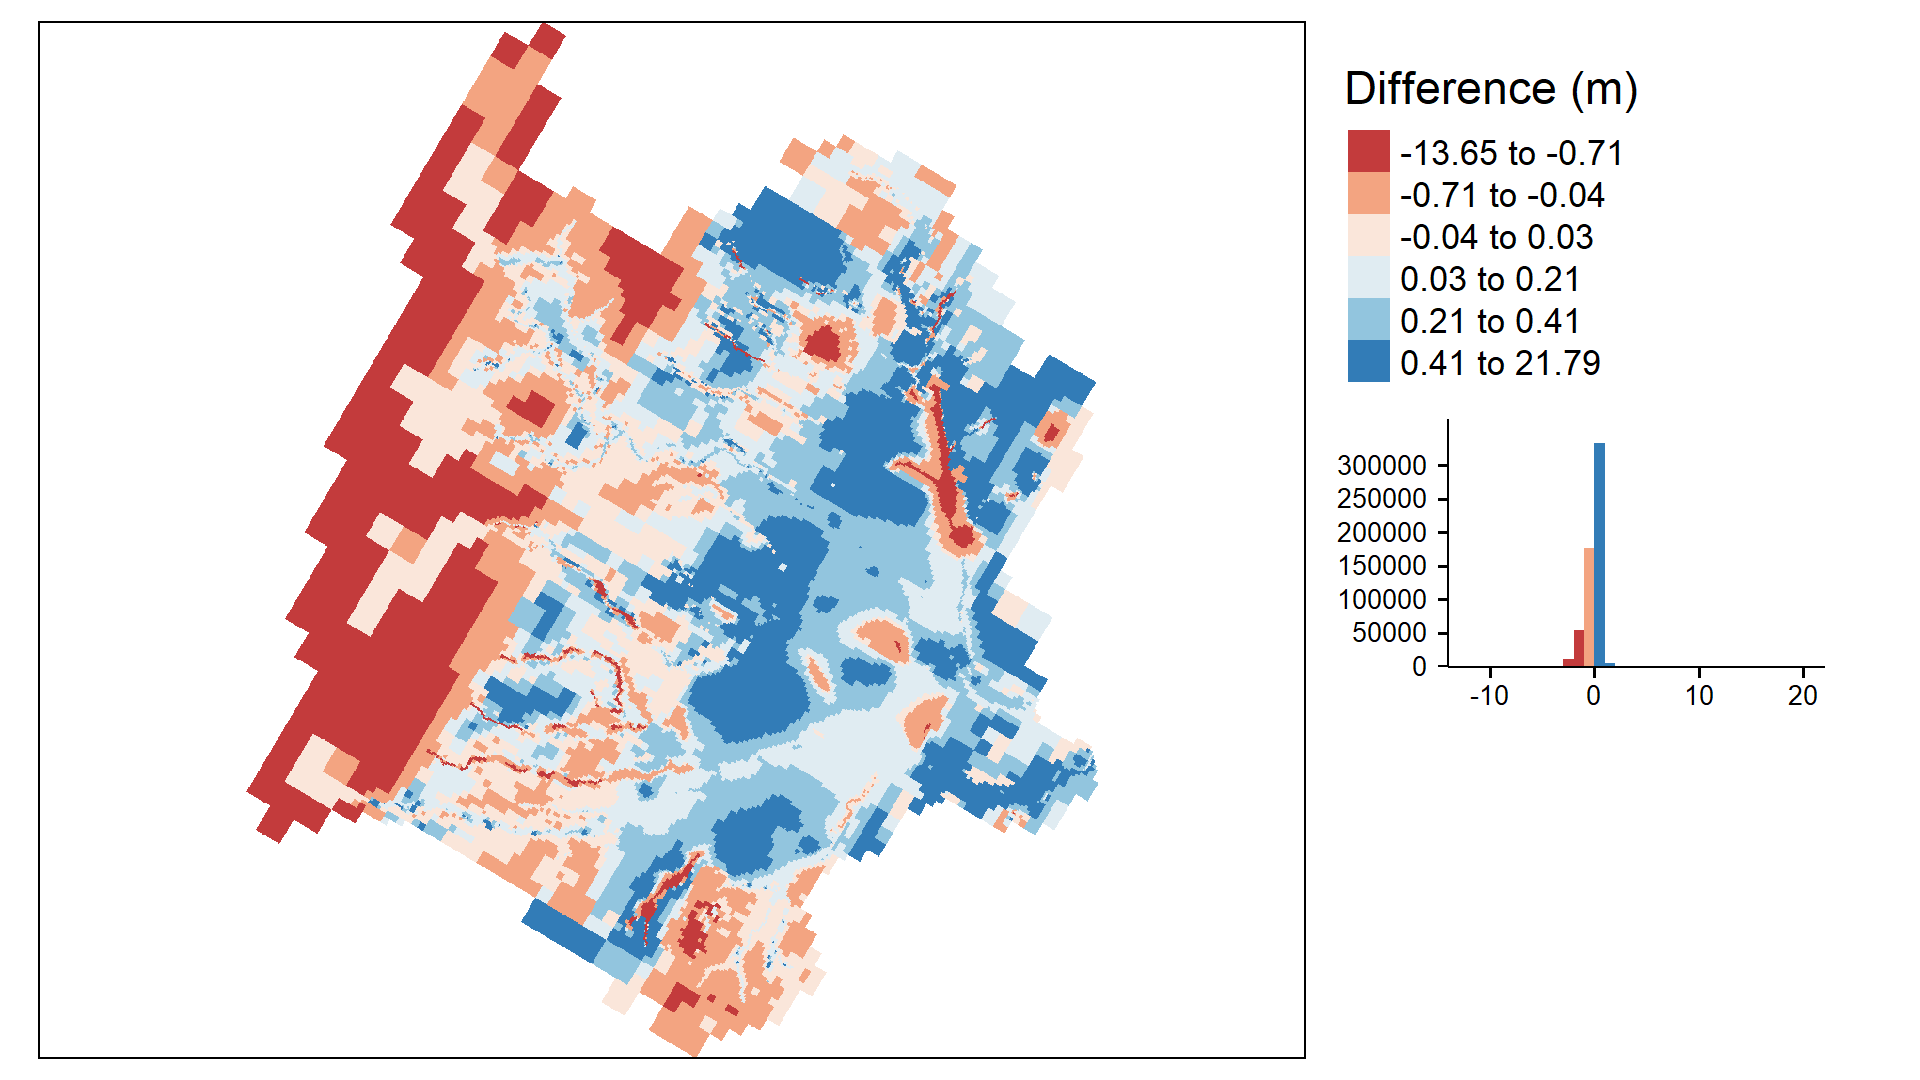
In this example, I used only 2 classes. Given that in many plots, I want to use more classes (5 or 6). I wonder if there is any better/efficient way to make sure the colors for values above and below zero will be divergent (red below zero and blue above zero without having to define breaks myself)?
cols <-get_brewer_pal("RdBu", n = 6, contrast = c(0, 0.65))
plot2 <-
  tm_shape(diff) +
  tm_raster(style = "quantile",
            n= 6,
            title = "Difference (m)",
            palette = cols,
            legend.hist = TRUE)+
  tm_legend(outside = TRUE, hist.width = 1)
plot2
 elwan3
All 13 comments
Have you tried to use the midpoint argument?
E.g.:
library(raster)
library(tmap)
diff <- raster("Difference.tif")

tm_shape(diff) + tm_raster(midpoint = 0,
                           style = "order",
                           palette = "RdBu")

tm_shape(diff) + tm_raster(midpoint = 0,
                           style = "fisher",
                           palette = "RdBu")
 Nowosad
on 5 Nov 2020
Nowosad
on 5 Nov 2020
Many thanks @Nowosad for your time and help. This is great.
Regarding the "fisher" style, the third class is from -0.53 to 0.26, is there a way to make sure a class won't include both negative and positive values (for example instead of -0.53 to 0.26, will be -0.53 to 0 and 0 to 0.26).
elwan3
on 5 Nov 2020
I do not think this is automatically possible. You can however, use the classInt package, split your data in two parts (below and above zero) and apply any method you want.
Also, you can learn more about the style argument at https://geocompr.github.io/post/2019/tmap-color-scales/.
Nowosad
on 5 Nov 2020
Thanks you so much
elwan3
on 6 Nov 2020
Dear elwan3,
Could you provide a small example with data as to demonstrate how you solved this issue using the classInt package?
I really appreciate that.
 ericmelse
on 6 Nov 2020
ericmelse
on 6 Nov 2020
Dear @elwan3 and @ericmelse, you can find a quick implementation of my idea below:
library(raster)
library(tmap)
library(classInt)

download.file("https://github.com/mtennekes/tmap/files/5500015/Difference.tif.zip",
              "Difference.tif.zip")

unzip("Difference.tif.zip", "Difference.tif")

diff <- raster("Difference.tif")

diff_values <- getValues(diff)

diff_values_below0 <- diff_values[diff_values < 0]
diff_values_above0 <- diff_values[diff_values > 0]

classes1 <- classIntervals(diff_values_below0, n = 4, style = "fisher")
classes2 <- classIntervals(diff_values_above0, n = 4, style = "fisher")

all_classes <- c(classes1$brks, classes2$brks)

tm_shape(diff) + tm_raster(midpoint = 0,
                           breaks = all_classes,
                           palette = "RdBu")

Created on 2020-11-06 by the reprex package (v0.3.0)
Nowosad
on 6 Nov 2020
Dear Nowosad, thank you very much, your example is very helpful.
ericmelse
on 7 Nov 2020
Many thanks @Nowosad for this great example. I highly appreciate your time and help.
elwan3
on 9 Nov 2020
No problem - happy to help.
Nowosad
on 9 Nov 2020
Another final question @Nowosad
When I use legend outside and save the map, there is white space to the right of the legend.
I wanted to remove this white space so I tried using outer.margins but my trials didn't work.
Your help will be highly appreciated.
diff_map<-
tm_shape(diff) +
  tm_raster(midpoint = 0,
            breaks = all_classes,
            palette = "RdBu")+
  tm_layout(legend.outside = TRUE)

tmap_save(diff_map, "diff_map.png", width=1000, height=700,dpi = 150)
@elwan3 I do not know what is the best approach here. Maybe modifying legend.outside.size or height:
diff_map <- tm_shape(diff) +
  tm_raster(midpoint = 0,
            breaks = all_classes,
            palette = "RdBu")+
  tm_layout(legend.outside = TRUE, legend.outside.size = 0.2)

diff_map
tmap_save(diff_map, "diff_map.png", width = 1000, height = 970, dpi = 150)
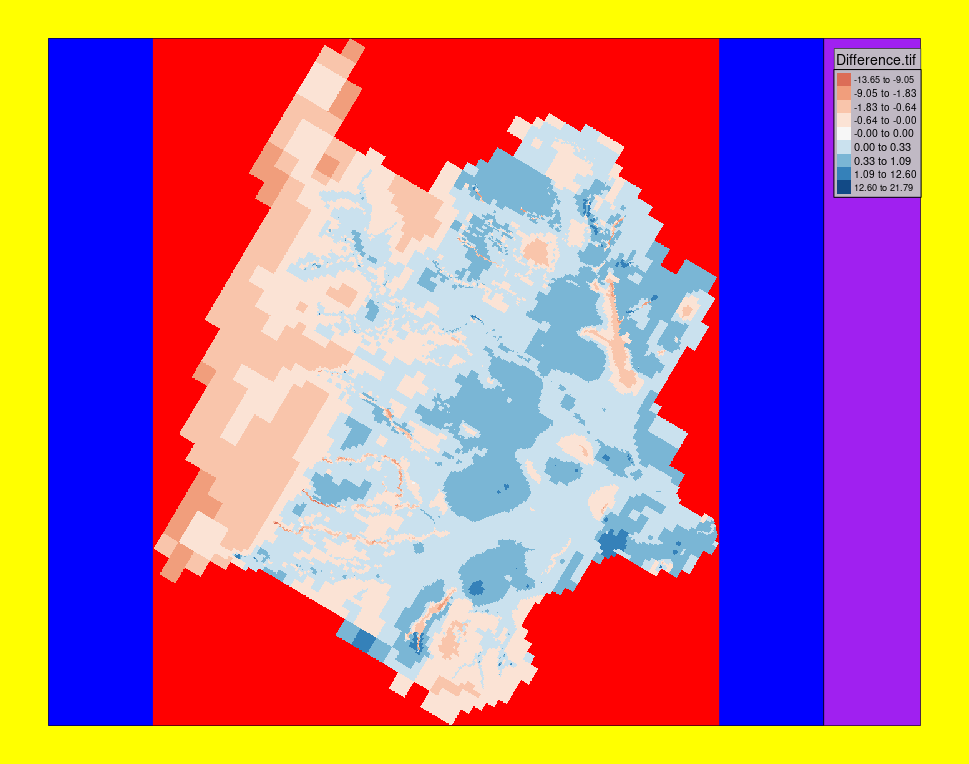
A combination of legend.outside.size and asp. Instead of trying to explain, I'll show it with tmap_design_mode() enabled.
diff_map <- tm_shape(diff) +
    tm_raster(midpoint = 0,
              breaks = all_classes,
              palette = "RdBu")+
    tm_layout(legend.outside = TRUE, legend.outside.size = 0.1, outer.margins = 0.05)

diff_map
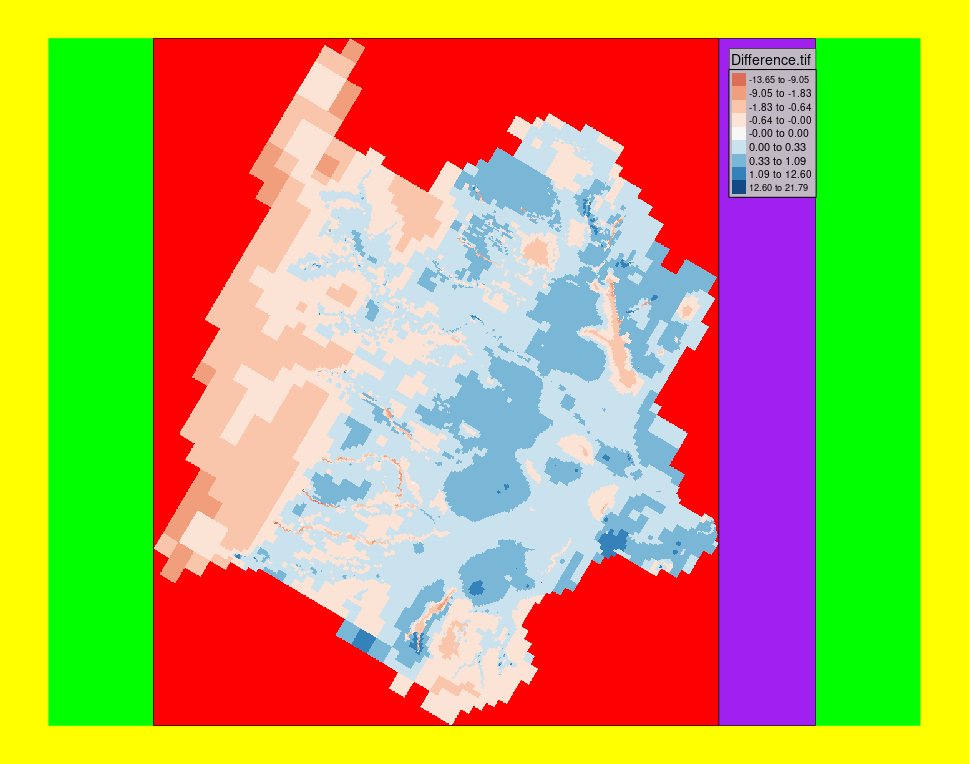
outer.margins correspond to the yellow part, legend.outside.size to the width of the purple block. Since asp is not defined, it uses the default, which is the aspect ratio of the shape. In other words, it stacks the legend to the righthand-side of the map. Therefore, you'll still see white space next to it.
When you set the aspect ratio to 0 (meaning of the device), the legend is aligned to the right, without any white space, other than from the outer margins:
diff_map <- tm_shape(diff) +
    tm_raster(midpoint = 0,
              breaks = all_classes,
              palette = "RdBu")+
    tm_layout(legend.outside = TRUE, legend.outside.size = 0.1, outer.margins = 0.05, asp = 0)

diff_map
Hope this helps.
 mtennekes
on 23 Nov 2020
mtennekes
on 23 Nov 2020
Thank you so much @mtennekes and @Nowosad for your time and help.
elwan3
on 3 Dec 2020
Related issues
 jarsc568
·
8Comments
Nowosad
·
5Comments
jarsc568
·
8Comments
Nowosad
·
5Comments
 Si-Chong
·
4Comments
Si-Chong
·
4Comments
 MatthieuStigler
·
3Comments
Nowosad
·
4Comments
MatthieuStigler
·
3Comments
Nowosad
·
4Comments