I.e. a stars object in which one dimension refers to simple features (e.g. MULTIPOLYGONs).
See https://r-spatial.github.io/stars/index.html :
suppressPackageStartupMessages(library(dplyr))
library(stars)

prec_file = system.file("nc/test_stageiv_xyt.nc", package = "stars")
(prec = read_ncdf(prec_file, curvilinear = c("lon", "lat"), ignore_bounds = TRUE))
sf::read_sf(system.file("gpkg/nc.gpkg", package = "sf"), "nc.gpkg") %>%
  st_transform(st_crs(prec)) -> nc # transform from NAD27 to WGS84
nc_outline = st_union(st_geometry(nc))
plot_hook = function() plot(nc_outline, border = 'red', add = TRUE)
prec %>%
  slice(index = 1:12, along = "time") %>%
  plot(downsample = c(5, 5, 1), hook = plot_hook)

a = aggregate(prec, by = nc, FUN = max)
a
#> stars object with 2 dimensions and 1 attribute
#> attribute(s):
#>  Total_precipitation_surface_1_Hour_Accumulation
#>  Min.   :  0.000
#>  1st Qu.:  0.380
#>  Median :  2.880
#>  Mean   :  9.904
#>  3rd Qu.: 13.750
#>  Max.   :136.630
#>  NA's   :966
#> dimension(s):
#>      from  to                  offset   delta  refsys point
#> geom    1 100                      NA      NA  WGS 84 FALSE
#> time    1  23 2018-09-13 18:30:00 UTC 1 hours POSIXct    NA
#>                                                                 values
#> geom MULTIPOLYGON (((-81.47258 3...,...,MULTIPOLYGON (((-78.65545 3...
#> time                                                              NULL
plot(a, max.plot = 23, border = 'grey', lwd = .5)

Created on 2020-06-09 by the reprex package (v0.3.0)
The most straightforward approach is to see it as a multiband sf object.
So the basic tmap code would be:
tm_shape(a) +
tm_polygons("Total_precipitation_surface_1_Hour_Accumulation") +
tm_facets("time")
Any ideas/suggestions are welcome, as well as other spatiotemptoral arrays which would require a different approach.
 mtennekes
>All comments
tm_shape(a) + tm_polygons() or alternatively qtm(a) gives
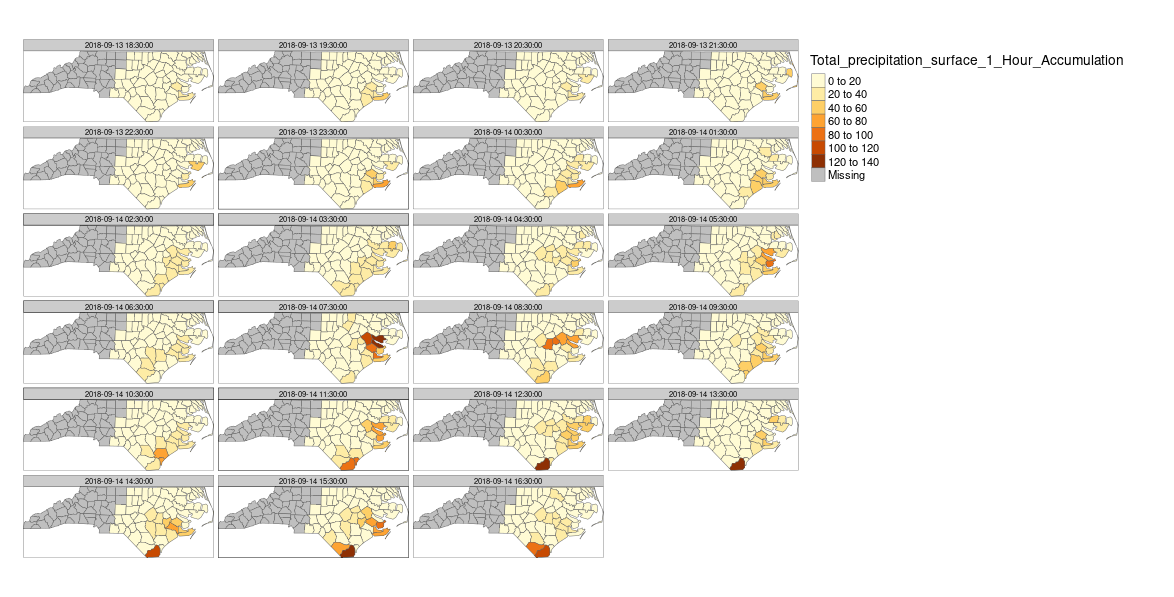
It may not cover all possibilities; it currently takes the first attribute, and the first non-geom dimension. I'm not sure there can be more than one non-geom dimension, but there can be multiple attributes (in that case, we'll need to make cross levels).
The current behavior is similar as with stars object with a raster and a band. In that case, a facet is created for each band value. The col parameter of tm_polygons / tm_raster cannot be specified by the user since it is set to the first attribute name.
Let me know if it works as expected, or if you have suggestions.
mtennekes
on 10 Jun 2020
Related issues
 Si-Chong
·
4Comments
Si-Chong
·
4Comments
 loreabad6
·
5Comments
loreabad6
·
5Comments
 marionowak
·
9Comments
mtennekes
·
4Comments
marionowak
·
9Comments
mtennekes
·
4Comments
 Nowosad
·
5Comments
Nowosad
·
5Comments
Most helpful comment
tm_shape(a) + tm_polygons()or alternativelyqtm(a)givesIt may not cover all possibilities; it currently takes the first attribute, and the first non-geom dimension. I'm not sure there can be more than one non-geom dimension, but there can be multiple attributes (in that case, we'll need to make cross levels).
The current behavior is similar as with stars object with a raster and a band. In that case, a facet is created for each band value. The
colparameter oftm_polygons/tm_rastercannot be specified by the user since it is set to the first attribute name.Let me know if it works as expected, or if you have suggestions.