Tmap: Allow size.max in tm_symbols (or tm_bubbles) to adjust the scaling of the symbol size
```data(World, metro)
metro$growth <- (metro$pop2020 - metro$pop2010) / (metro$pop2010 * 10) * 100
tm_shape(World) +
tm_fill("grey70") +
tm_shape(metro) +
tm_bubbles("pop2010", col = "growth",
size.max=max(metro$pop2010)/2,
border.col = "black", border.alpha = .5,
style="fixed", breaks=c(-Inf, seq(0, 6, by=2), Inf),
palette="-RdYlBu", contrast=1,
title.size="Metro population",
title.col="Growth rate (%)") +
tm_format("World")
```
I want to be able to scale down the size of the symbols when I use a variable as the input value for size argument. The reason is that the symbols are overlapping each other even though the maximum size has defaulted to 1 and other sizes are scaled proportionally to 1. I want the maximum size to be smaller (e.g, 0.1). I tried giving size.max a new value (e.g., 0.5 or max(metro$pop2010)/2), but it does not scale down the symbol size. I also tried changing the variable values (e.g., dividing them by 100), but that does not change the symbol size as well. How can I scale down the symbol size when the argument for size is a variable?
(size.max=max(metro$pop2010)/2)

(size.max=NA)
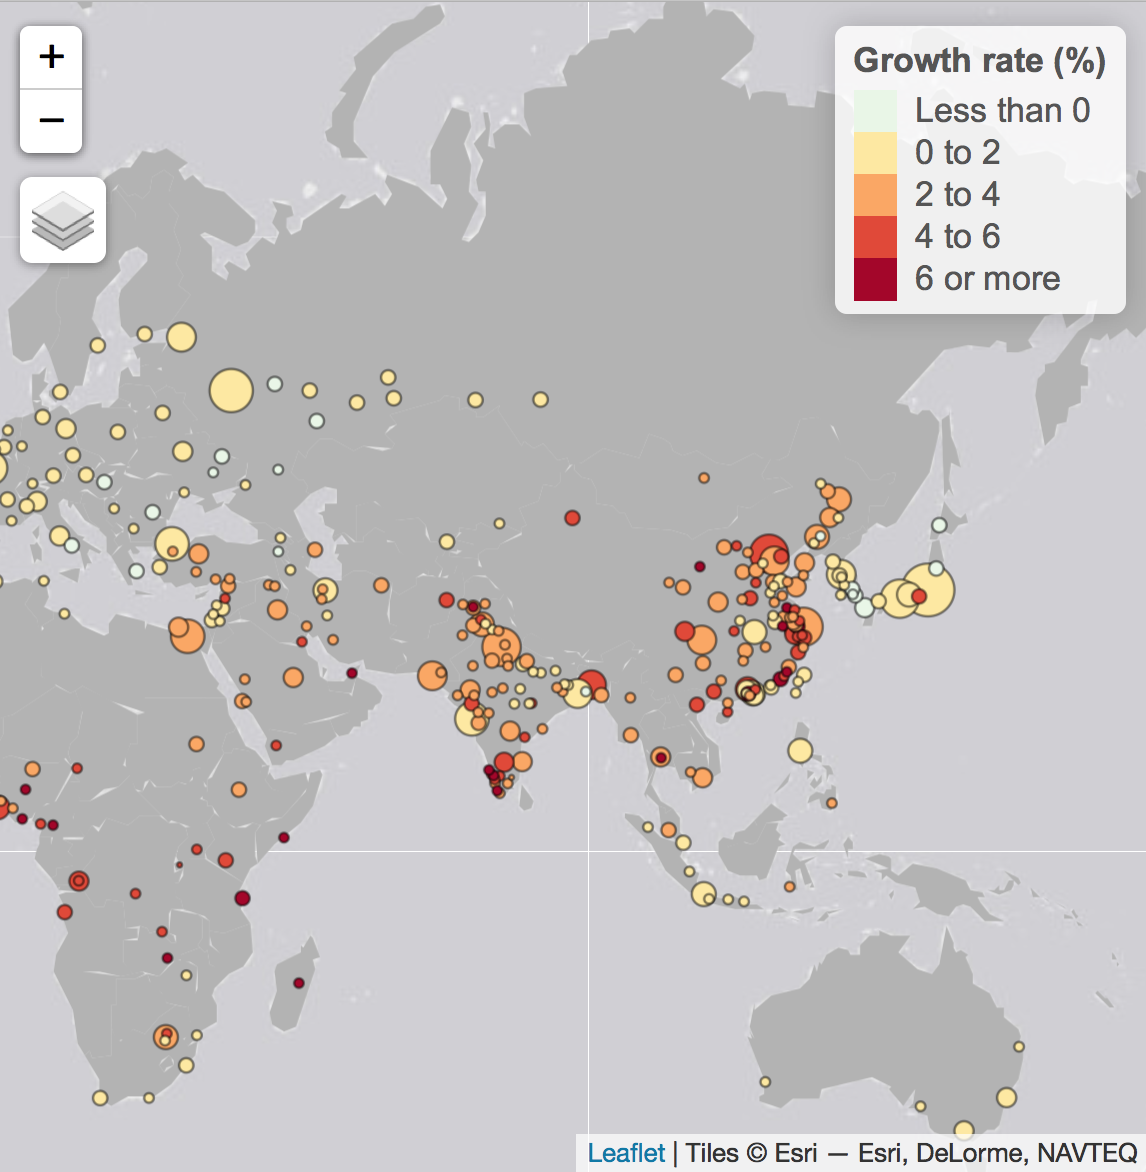
(size.max=0.5)

 xiaofanliang
All 2 comments
I find out how to work around it. So to scale down the size of symbols, people actually need to increase the value of size.max rather than decrease it. This is a counterintuitive setting, so I will leave it to the developers to decide if it should be changed.
xiaofanliang
on 23 Feb 2020
Thx for your question.
The scale argument is probably what you are looking for.
size.max determines the maximum of the range of values that are mapped to the bubbles. So, in this example, if you specify size.max = 100e6, the range [0, 100e6] is mapped to the bubbles, meaning that Tokyo with a population of 30e6, will be about 1/3 of the maximum bubble size.
Also size.lim might be interesting: it truncates values that are outside of a range. So if you would specify size.lim = c(0, 10e6). all cities with more than 10e6 population will be shown as if they have 10e6 population.
The actual bubble size that the largest value (i.e. size.max) represents, can be set with scale.
Please let me know if you understand how these arguments work, also from the description in the documentation.
 mtennekes
on 24 Feb 2020
mtennekes
on 24 Feb 2020
Related issues
 jarsc568
·
8Comments
jarsc568
·
8Comments
 robsalasco
·
4Comments
robsalasco
·
4Comments
 marionowak
·
9Comments
marionowak
·
9Comments
 jannes-m
·
5Comments
mtennekes
·
4Comments
jannes-m
·
5Comments
mtennekes
·
4Comments
Most helpful comment
Thx for your question.
The
scaleargument is probably what you are looking for.size.maxdetermines the maximum of the range of values that are mapped to the bubbles. So, in this example, if you specifysize.max = 100e6, the range [0, 100e6] is mapped to the bubbles, meaning that Tokyo with a population of 30e6, will be about 1/3 of the maximum bubble size.Also
size.limmight be interesting: it truncates values that are outside of a range. So if you would specifysize.lim = c(0, 10e6). all cities with more than 10e6 population will be shown as if they have 10e6 population.The actual bubble size that the largest value (i.e.
size.max) represents, can be set withscale.Please let me know if you understand how these arguments work, also from the description in the documentation.