I've tried to hide a region with missing value in a facet map, however showNA seams not working.
A reproducible code is below:
library(spData)
library(tmap)
library(sf)
#> Linking to GEOS 3.6.1, GDAL 2.1.4, proj.4 4.9.3

north_nz = subset(nz, Island == "North")
north_nz$Population[2] = NA

tm_shape(north_nz) +
  tm_polygons("Population") +
  tm_facets(by = "Name", showNA = FALSE)

 Nowosad
All 11 comments
Interesting. Actually, the purpose of showNA in tm_facets is whether to show facets for which there is no data at all (so not even rows with NA). Example
library(dplyr)
north_nz2 <- north_nz %>% mutate(Name = factor(Name)) %>%
    filter(Name != "Taranaki")

tm_shape(north_nz2) +
    tm_polygons("Population") +
    tm_facets(by = "Name", showNA = TRUE, textNA = "MISSING")
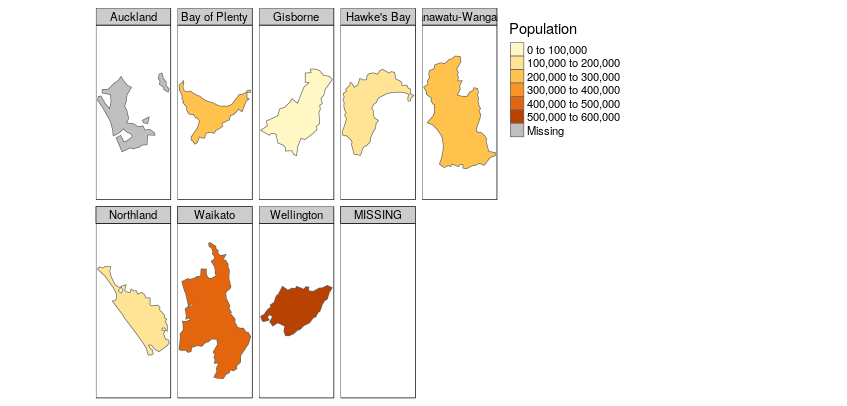
I think we can treat both cases (so data with all NA's and no data at all) similarly, don't you think? I will also check textNA, it's strange that it doesn't show "Taranaki" when I do not specify textNA = "MISSING".
 mtennekes
on 25 Apr 2018
mtennekes
on 25 Apr 2018
I dived in to it a little more. Now I understand the difference between the arguments showNA and drop.empty.facets:
```{r}
Case 1: NA's in the by variable (controlled with showNA)
north_nz1 = subset(nz, Island == "North")
north_nz1$Name[1] = NA # make "Northland" missing
tm_shape(north_nz1) +
tm_polygons("Population") +
tm_facets(by = "Name",
showNA = FALSE)
tm_shape(north_nz1) +
tm_polygons("Population") +
tm_facets(by = "Name",
showNA = TRUE,
textNA = "Missing Name")
Case 2: unused levels (controlled with drop.empty.facets)
north_nz2 = subset(nz, Island == "North")
north_nz2 <- north_nz2 %>% mutate(Name = factor(Name)) %>%
filter(Name != "Taranaki") # remove Taranaki feature (but keep name in levels)
tm_shape(north_nz2) +
tm_polygons("Population") +
tm_facets(by = "Name")
tm_shape(north_nz2) +
tm_polygons("Population") +
tm_facets(by = "Name",
drop.empty.facets = FALSE) # TRUE by default
Case 3: NA's in the data
north_nz3 = subset(nz, Island == "North")
north_nz3$Population[2] = NA # make Auckland population number missing
tm_shape(north_nz3) +
tm_polygons("Population") +
tm_facets(by = "Name")
```
The question is how to deal with Case 3 (so your question). On the one hand, drop.empty.facets is more suitable, since we do know the category/facet name (in this example Auckland). The argument showNA is meant for missing values in the by variable (like Case 1). On the other hand showNA is more intuitive, since it is about whether to show missing data. We can introduce a third argument for Case 3, but this would probably be to complicated...
mtennekes
on 25 Apr 2018
My thinking is to treat Case 3 the same as Case 1.
Btw, shouldn't the code below return only 9 panels?
tm_shape(north_nz3) +
  tm_polygons("Population") +
  tm_facets(by = "Name",
            showNA = TRUE,
            textNA = "Missing Name")
I decided to add another argument, called drop.NA.facets, since it's fundamentally different from showNA and I wasn't happy with drop.empty.facets either, since they should have different default values, in my option.
To point out the difference between showNA, drop.empty.facets and drop.NA.facets, consider this data example:
| by | var | |
| -------------|-------------|-------------|
| a | 1 ||
| b | 2 ||
| c | NA | drop.NA.facets (default FALSE) determines whether to show the features colored with colorNA
| d | 1 ||
| e | 2 ||
| NA | 4 | showNA (default: TRUE when any NA exist) determines whether to show as extra facet (titled textNA)|
level without data:
| by | |
| -------------|-------------|
| f | drop.empty.facets (default TRUE) determines whether to show this empty facet |
I created a new branch facet in which drop.NA.facets will be implemented. The file https://github.com/mtennekes/tmap/blob/facet/test/test_all.R is a systematic test in which all the combinations of the tm_facets settings are tested. There are 128 cases to test (for 6 T/F arguments, so 2^6, times 2 since for both numeric and categorical data have to be tested), and that's only for the polygon fill aesthetic. But we'll get there eventually:-)
A minor, but other new feature that I'm implementing at the same time, is the argument colorNULL which determines the color for features that are out of scope. It is to distinguish between missing data (NA), and features for which data is not applicable.
This is handy for two cases: for faceting when tm_facets(... , drop.units = FALSE), and for maps with neighboring regions (e.g. choropleth map of Europe where North African countries are visible and filled with very light gray). For the latter case, I was thinking to add a filter argument to tm_shape.
mtennekes
on 29 Apr 2018
Impressive work Martijn.
Nowosad
on 1 May 2018
It was quite some work, but the implementation is finished. The docs still have to be updated. I also tidied the code of the process_x functions. This should make it easier to implement new aesthetics.
mtennekes
on 11 May 2018
Hi Martijn,
I am trying to make a faceted map in which every unit with missing data (both by and var) is shown as NA (which is meaningful in many cases). However, I was not able to achieve this result by any combination of the parameters discussed above.
The workaround that helped me was to fill missing by's for all units. But this is not elegant since tidyr::complete() drops geometry column. Any ideas on how to achieve this without altering the data?
library(sf)
#> Linking to GEOS 3.6.1, GDAL 2.1.3, PROJ 4.9.3
library(tmap)
library(tidyverse)
library(rnaturalearth)
library(googlesheets4) # devtools::install_github("tidyverse/googlesheets4")

googlesheets4::sheets_deauth()

gapminder = read_sheet('1qHalit8sXC0R8oVXibc2wa2gY7bkwGzOybEMTWp-08o', 2)
#> Reading from 'Data Geographies - v1 - by Gapminder'
#> Range "'list-of-countries-etc'"

lifedf = read_sheet('1H3nzTwbn8z4lJ5gJ_WfDgCeGEXK3PVGcNjQ_U5og8eo') %>%
  rename(name = 1) %>%
  gather(year, lifexp, -name) %>%
  filter(year %in% c(1960, 2010)) %>%
  left_join(gapminder) %>%
  mutate(geo = stringr::str_to_upper(geo)) %>%
  select(geo, name, year, lifexp)
#> Reading from 'indicator life_expectancy_at_birth'
#> Range "'Data'"
#> Joining, by = "name"

# working width df only, since tidyr::complete() drops geometry
countries = ne_countries()@data %>%
  select(adm0_a3) %>%
  left_join(lifedf, by = c('adm0_a3' = 'geo')) %>%
  replace_na(list(year = 1960)) %>% # fake year (one from existing)
  complete(adm0_a3, year)           # complete all other years

countries_sf = ne_countries() %>%
  st_as_sf() %>%
  select(adm0_a3, sovereignt, admin) %>%
  st_transform("+proj=eck3") %>%
  left_join(countries, by = c('adm0_a3' = 'adm0_a3'))

tm_shape(countries_sf) +
  tm_polygons('lifexp',
              palette = 'YlGnBu',
              n = 3,
              style = 'pretty',
              border.col = 'gray20',
              title = 'Years',
              legend.reverse = TRUE) +
  tm_facets(by = 'year',
            ncol = 2) +
  tm_layout(frame = FALSE,
            earth.boundary = TRUE,
            legend.outside = TRUE,
            legend.outside.position = 'bottom',
            fontfamily = 'OpenSans',
            main.title.size = 1.2,
            main.title = 'Life expectancy at birth',
            legend.bg.color = 'white',
            outer.margins = c(0.02, 0.1, 0.02, 0.02),
            inner.margins = c(0.02, 0.02, 0.07, 0.02))

Created on 2018-11-21 by the reprex package (v0.2.1)
 tsamsonov
on 21 Nov 2018
tsamsonov
on 21 Nov 2018
It is not clear want to achieve. Obviously, you want each country to be drawn in each facet (with NA in countries with missing data for that year). Do you also want a special facet for missing years?
In the raw data, there are only 12 missing values, and for those, the year is also missing:
> countries = ne_countries()@data %>%
+   select(adm0_a3) %>%
+   left_join(lifedf, by = c('adm0_a3' = 'geo'))
> table(countries$year, is.na(countries$lifexp), useNA = "a")

       FALSE TRUE <NA>
  1960   165    0    0
  2010   165    0    0
  <NA>     0   12    0
@mtennekes No, I don't want a special facet for missing years. A specialized facet for missing by's is redundant when by is a time variable. There is no difference between missing year and missing value from a mapping perspective, because both cases just result in missing value for a timestamp. Therefore I want both scenarios to be shown as NA in facets — just like I provided in the example above.
tsamsonov
on 6 Dec 2018
Ah, now I get your point. From a domain knowledge point of view, it is obvious to draw the countries with missing data in each facet. However, from a purely data point of view, it is not. The sf object contains 342 rows, which are to R just simple features. In other worlds, there is no definition of which countries together form the world. Your trick to use replace_na and complete worked well to make the set of countries for each year complete. I do not see a way to do that automatically.
Another trick, which doesn't requite data manupulation is:
countries_sf = ne_countries() %>%
    st_as_sf() %>%
    select(adm0_a3, sovereignt, admin) %>%
    left_join(lifedf, by = c('adm0_a3' = 'geo'))

tm_shape(countries_sf) +
    tm_polygons('grey75') +
tm_shape(countries_sf) +
    tm_polygons('lifexp',
        palette = 'YlGnBu',
        n = 3,
        style = 'pretty',
        border.col = 'gray20',
        title = 'Years',
        legend.reverse = TRUE, showNA = TRUE) +
tm_facets(by = 'year', drop.NA.facets = T, ncol = 2) +
tm_layout(frame = FALSE,
    earth.boundary = TRUE,
    legend.outside = TRUE,
    legend.outside.position = 'bottom',
    fontfamily = 'OpenSans',
    main.title.size = 1.2,
    main.title = 'Life expectancy at birth',
    legend.bg.color = 'white',
    outer.margins = c(0.02, 0.1, 0.02, 0.02),
    inner.margins = c(0.02, 0.02, 0.07, 0.02))
@tsamsonov let us know if the above solution does not work
Nowosad
on 26 Apr 2020
Related issues
 Si-Chong
·
4Comments
Si-Chong
·
4Comments
 prosoitos
·
5Comments
prosoitos
·
5Comments
 marionowak
·
9Comments
Nowosad
·
5Comments
mtennekes
·
8Comments
marionowak
·
9Comments
Nowosad
·
5Comments
mtennekes
·
8Comments
Most helpful comment
It was quite some work, but the implementation is finished. The docs still have to be updated. I also tidied the code of the process_x functions. This should make it easier to implement new aesthetics.