tm1py and powerbi getting started ?
Hi - Tm1py 1.5 looks like a fantastic release, very keen to explore the new features that support PowerBI integration.
Do you have an example that I can use to get started with maybe ?.
KR Nick
 watersnick
All 20 comments
Hi @watersnick,
thanks! It's actually pretty straightforward. Here is what you need to do:
Install PowerBI Desktop
Create a new report / pbix file
In order to bring data into the report, you have to use python scripts as data sources for PowerBI.
So you have to bring in
- Facts (i.e. cell values with coordinates) from a cube view / MDX query
- Elements from dimensions
For every dataset that you want to retrieve you have to go through the below steps:
Go to
Get data->More...->other->python scriptprototype the py script that retrieves the data you need in Jupyter
The two functions that you need are the execute_mdx / execute_view function to retrieve facts from a cube.
with TM1Service(address="localhost", port=12354, user="admin", password="apple", ssl=True) as tm1:
    data = tm1.power_bi.execute_view(cube_name="Sales", view_name="PowerBI", private=False)
| | Time | Industry | Executive | Customer | Business Unit | Product | State | Gross Margin | Revenue | COGS |
|----:|-------:|:-----------------|:---------------|-----------:|----------------:|----------:|:--------|---------------:|-----------:|----------:|
| 0 | 201308 | CPG | Andrew Ma | 10008 | 49 | 30 | TX | -5048.78 | nan | 5048.78 |
| 1 | 201308 | CPG | Andrew Ma | 10017 | 49 | 30 | NY | -5821.12 | nan | 5821.12 |
| 2 | 201308 | Energy | Valery Ushakov | 10035 | 31 | 50 | OH | -60384.4 | nan | 60384.4 |
| 3 | 201308 | Energy | Carlos Grilo | 10026 | 48 | 20 | FL | -24880 | nan | 24880 |
The shape of the cube view / MDX query drives the shape of the data frame. I recommend this approach:
- Position all dimensions that you want to use for slicing/dicing in the rows
- Position the measures on the columns
- Position dimensions that are not relevant for the report in the titles (so they will not be included in the data frame)
The get_member_properties function retrieves a slice of a dimension.
with TM1Service(address="localhost", port=12354, user="admin", password="apple", ssl=True) as tm1:

    customers = tm1.power_bi.get_member_properties(
        dimension_name="Customer",
        hierarchy_name="Customer",
        member_selection="{Tm1SubsetAll([Customer])}",
        skip_consolidations=True,
        attributes=["State", "City"],
        skip_parents=False)
| | Customer | Type | State | City | level000 |
|----:|:-----------|:--------|:--------|:-------------------------|:---------------|
| 0 | 1023 | Numeric | TX | Irving | Total Customer |
| 1 | 10000 | Numeric | IL | Chicago | Total Customer |
| 2 | 10001 | Numeric | IL | Westchester | Total Customer |
| 3 | 10002 | Numeric | TX | Plano | Total Customer |
| 4 | 10003 | Numeric | TX | Fort Worth | Total Customer |
- paste the py script into the editor
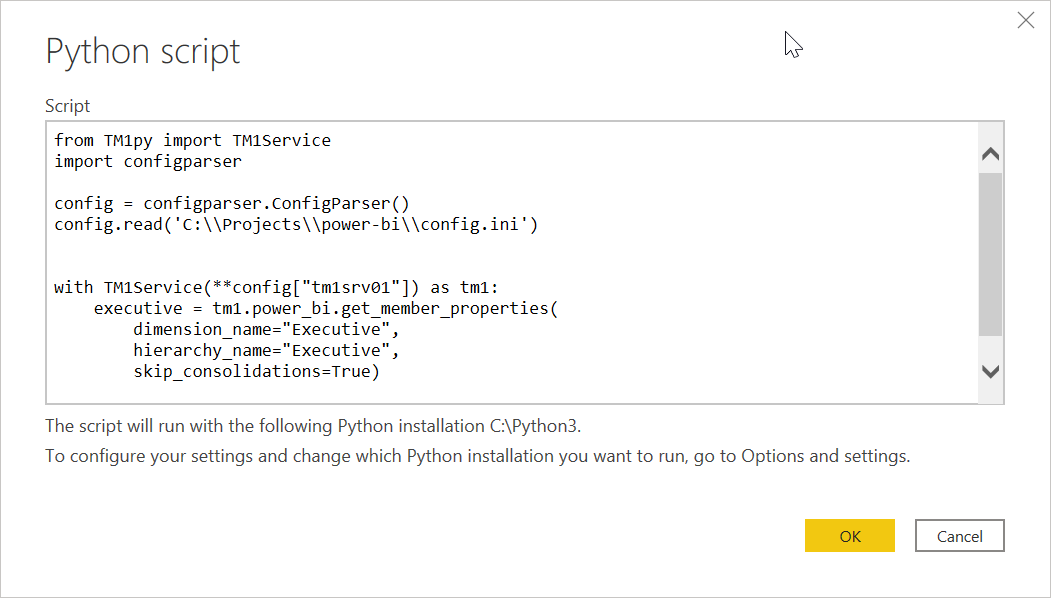
optional: do type conversions by column or add additional logic in PBI to the datasets. You probably want to convert all numbers to decimal numbers. If you have dates as elements make sure to convert them to the type
Date.optional: express side calculations on the data set in the data tab
Once you have the facts that you need and the dimensions that you want to use for slicing and dicing, you can take a look at the model. PowerBI should be able to autodetect all relations.
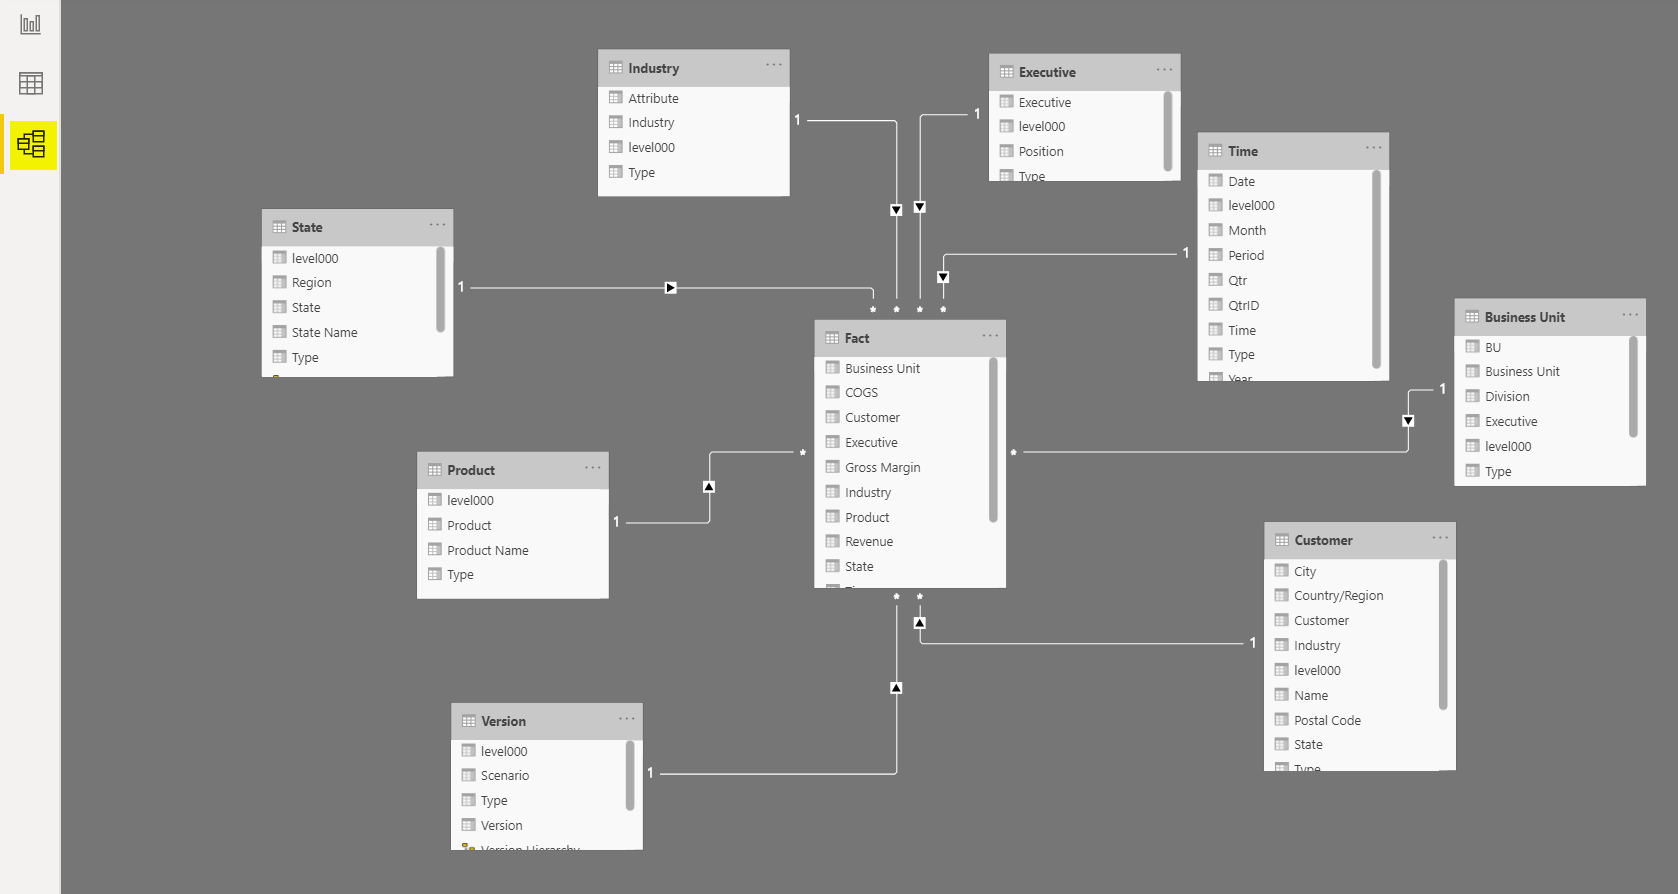
Now you can use the data sets to build a dashboard
You can press the refresh button in the PowerBI ribbon.

Ideally, you are using TM1py with CAM and SSO. Then you don't have to provide a password and the security for your user applies as it is defined in TM1.
When you are done with the dashboard you can publish it.
 MariusWirtz
on 7 Aug 2020
MariusWirtz
on 7 Aug 2020
@MariusWirtz may i ask you a little bit more precisely if this is really a live data connection, which sends a new request every time a filter is applied, or as usual the data is loaded once at the beginning or via refresh?
 gmc-sanko
on 11 Aug 2020
gmc-sanko
on 11 Aug 2020
@gmc-sanko,
PowerBI Desktop has a refresh button in the ribbon. As the name suggests, the data is reloaded every time you press that button.
So in that regard, the python data source behaves like every other data source in PowerBI.
You can see the refresh happening at the beginning of the gif.
MariusWirtz
on 11 Aug 2020
Filtering and aggregations happen inside PowerBI when you click on an element of a chart.
Refreshing a python data source is possible in PowerBI Desktop.
Once the dashboard is hosted in the PBI cloud a data refresh is not possible, just like that.
A simple manual solution to that limitation can be to refresh the dashboard manually and re-upload it.
MariusWirtz
on 11 Aug 2020
@MariusWirtz thank you very much for the quick answer. unfortunately it is not a live data connection in the terms of DirectQuery. Thanks a lot.
gmc-sanko
on 11 Aug 2020
Unfortunately, PowerBI supports DirectQueries only for some data sources. The python data source is currently not one of them.
MariusWirtz
on 11 Aug 2020
Hi @MariusWirtz - this maybe my ignorance and most probably a PowerBI environmental issue, but when I try to execute the following initialisation code...
from TM1py import TM1Service
with TM1Service(address="localhost", port=8014, user="admin", password="apple", ssl=False) as tm1:
data = tm1.power_bi.execute_view(cube_name="Revenue", view_name="Revenue Analysis", private=False)
I get the following error...
Details: "ADO.NET: Python script error.
C:\USERS\XXXX\ANACONDA3\lib\site-packages\numpy__init__.py:140: UserWarning: mkl-service package failed to import, therefore Intel(R) MKL initialization ensuring its correct out-of-the box operation under condition when Gnu OpenMP had already been loaded by Python process is not assured. Please install mkl-service package, see http://github.com/IntelPython/mkl-service
from . import _distributor_init
Traceback (most recent call last):
File "PythonScriptWrapper.PY", line 2, in
import os, pandas, matplotlib
File "C:\USERS\XXXX\ANACONDA3\lib\site-packages\pandas__init__.py", line 16, in
raise ImportError(
ImportError: Unable to import required dependencies:
numpy:
IMPORTANT: PLEASE READ THIS FOR ADVICE ON HOW TO SOLVE THIS ISSUE!
Importing the numpy C-extensions failed. This error can happen for
many reasons, often due to issues with your setup or how NumPy was
installed.
We have compiled some common reasons and troubleshooting tips at:
https://numpy.org/devdocs/user/troubleshooting-importerror.html
Please note and check the following:
- The Python version is: Python3.8 from "C:\USERS\XXXX\ANACONDA3\python.exe"
- The NumPy version is: "1.18.5"
and make sure that they are the versions you expect.
Please carefully study the documentation linked above for further help.
Original error was: DLL load failed while importing _multiarray_umath: The specified module could not be found.
I have been using the samples_for_beginners.ipynb example to ensure that my view is working and connects fine, but in PowerBI Python script editor it doesn't seem to want to play nicely !.
Any ideas on how to troubleshoot this ?.
watersnick
on 11 Aug 2020
Hi @watersnick,
this looks like some dependency/compatibility issue.
Try to install plain python (= not anaconda) v3.6 + TM1py + pandas + matplotlib.
MariusWirtz
on 11 Aug 2020
Thanks @MariusWirtz you are correct it was a dependency issue - installing a new version of Python 3.8 with the required packages fixed the issue - thanks again your guidance ! #noob
watersnick
on 12 Aug 2020
Hi,
I would like to retrieve TM1/PA data via Python scripts in Power BI.
Environment:
Power BI Version: 2.82.5858.641 64-bit (June 2020)
Planning Analytics 2.0
TM1py installed
Pandas installed
Matplotlib installed
Succesvol test with check.py from tm1py-samples (Planning Analytics 'Planning Sample' could be reached)
I was running:
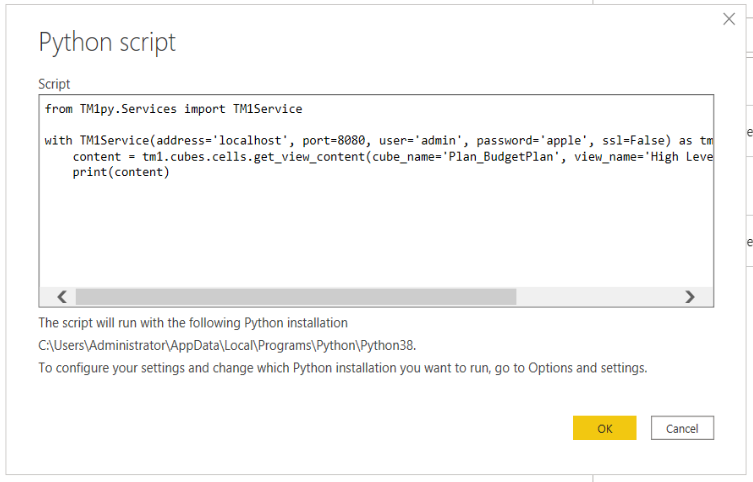
=> There was no error messages, but also no data
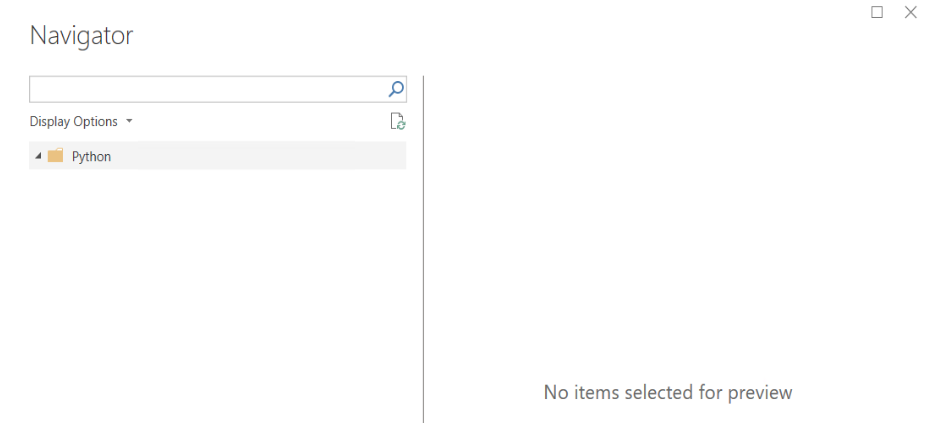
Then I was running:
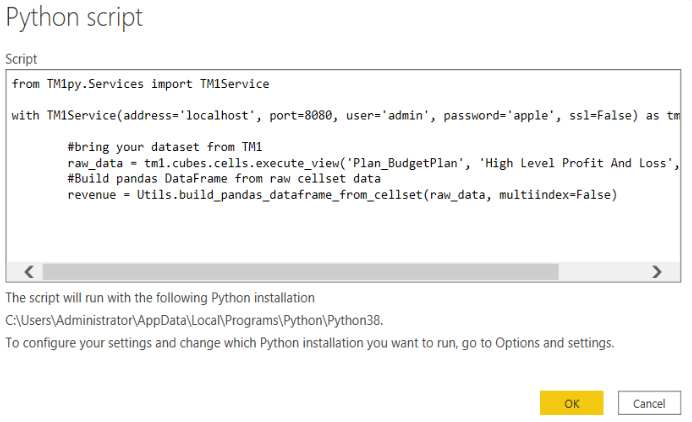
=> Then I got this error message:
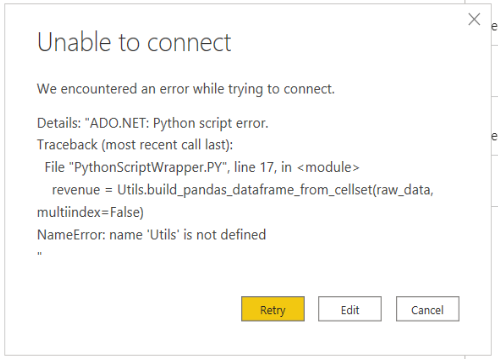
Can someone please help me to create a script to retrieve data from a PA view.
Thanks a lot
 Andy-Hofelmeyer
on 19 Aug 2020
Andy-Hofelmeyer
on 19 Aug 2020
try tm1.power_bi.execute_view instead of tm1.cubes.cell.get_view_content
gmc-sanko
on 19 Aug 2020
Hi gmc-sanko,
you mean in my first try to change tm1.cubes.cells.get_view_content into tm1.power_bi.execute_view?
Like:
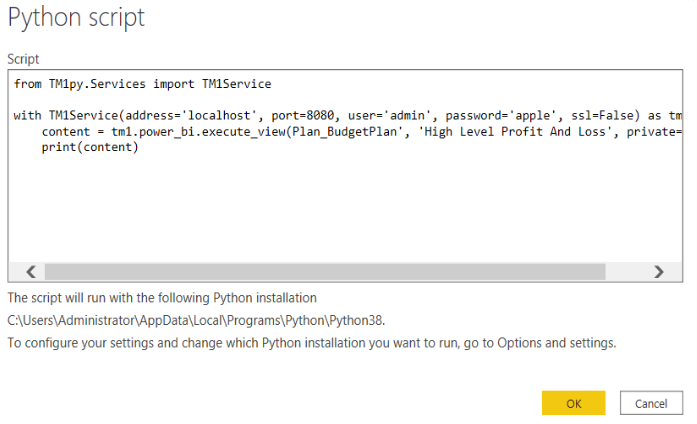
Then I am getting this error message:
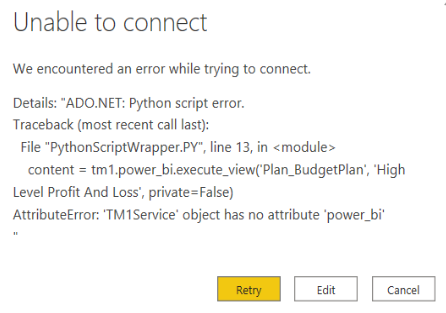
Andy-Hofelmeyer
on 19 Aug 2020
I think you should update TM1py to v1.5
gmc-sanko
on 19 Aug 2020
I think you should update TM1py to v1.5
Yeah. Run pip install tm1py --upgrade
MariusWirtz
on 19 Aug 2020
YYYEESSSS !!!
After updating TM1py it is working:
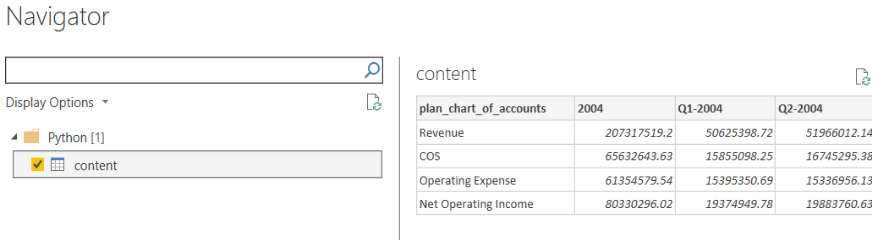
Thanks a lot. Really...
Andy-Hofelmeyer
on 19 Aug 2020
great 👍
gmc-sanko
on 19 Aug 2020
I would recommend putting measures on columns 😉
Good luck!
MariusWirtz
on 19 Aug 2020
Hi,
I'm getting below error while using tm1 connection via Power BI
Unable to connect
Details: "ADO.NET: Python script error.
Traceback (most recent call last):
File "PythonScriptWrapper.PY", line 10, in
from TM1py.Services import TM1Services
ImportError: cannot import name 'TM1Services'
Please help me on this issue
 rajatm1
on 31 Aug 2020
rajatm1
on 31 Aug 2020
import TM1Service not TM1Services
from TM1py.Services import TM1Service
if you use Pycharm (or any good IDE) it will tell you these differences.
 rkvinoth
on 31 Aug 2020
rkvinoth
on 31 Aug 2020
The approach is now discussed in more depth on the cubewise code blog:
https://code.cubewise.com/tm1py-help-content/getting-tm1-data-into-power-bi
MariusWirtz
on 3 Sep 2020
Related issues
 scrambldchannel
·
6Comments
scrambldchannel
·
6Comments
 cubewise-gng
·
5Comments
cubewise-gng
·
5Comments
 user1493
·
3Comments
user1493
·
3Comments
 rclapp
·
6Comments
rclapp
·
6Comments
 hermie64
·
3Comments
hermie64
·
3Comments
Most helpful comment
Hi @watersnick,
thanks! It's actually pretty straightforward. Here is what you need to do:
Install PowerBI Desktop
Create a new report / pbix file
In order to bring data into the report, you have to use python scripts as data sources for PowerBI.
So you have to bring in
For every dataset that you want to retrieve you have to go through the below steps:
Go to
Get data->More...->other->python scriptprototype the py script that retrieves the data you need in Jupyter
The two functions that you need are the
execute_mdx/execute_viewfunction to retrieve facts from a cube.| | Time | Industry | Executive | Customer | Business Unit | Product | State | Gross Margin | Revenue | COGS |
|----:|-------:|:-----------------|:---------------|-----------:|----------------:|----------:|:--------|---------------:|-----------:|----------:|
| 0 | 201308 | CPG | Andrew Ma | 10008 | 49 | 30 | TX | -5048.78 | nan | 5048.78 |
| 1 | 201308 | CPG | Andrew Ma | 10017 | 49 | 30 | NY | -5821.12 | nan | 5821.12 |
| 2 | 201308 | Energy | Valery Ushakov | 10035 | 31 | 50 | OH | -60384.4 | nan | 60384.4 |
| 3 | 201308 | Energy | Carlos Grilo | 10026 | 48 | 20 | FL | -24880 | nan | 24880 |
The shape of the cube view / MDX query drives the shape of the data frame. I recommend this approach:
The
get_member_propertiesfunction retrieves a slice of a dimension.| | Customer | Type | State | City | level000 |
|----:|:-----------|:--------|:--------|:-------------------------|:---------------|
| 0 | 1023 | Numeric | TX | Irving | Total Customer |
| 1 | 10000 | Numeric | IL | Chicago | Total Customer |
| 2 | 10001 | Numeric | IL | Westchester | Total Customer |
| 3 | 10002 | Numeric | TX | Plano | Total Customer |
| 4 | 10003 | Numeric | TX | Fort Worth | Total Customer |
optional: do type conversions by column or add additional logic in PBI to the datasets. You probably want to convert all numbers to decimal numbers. If you have dates as elements make sure to convert them to the type
Date.optional: express side calculations on the data set in the data tab
Once you have the facts that you need and the dimensions that you want to use for slicing and dicing, you can take a look at the model. PowerBI should be able to autodetect all relations.
Now you can use the data sets to build a dashboard
You can press the refresh button in the PowerBI ribbon.
Ideally, you are using TM1py with CAM and SSO. Then you don't have to provide a password and the security for your user applies as it is defined in TM1.
When you are done with the dashboard you can publish it.