Timescaledb: Huge memory usage from Background Worker Scheduler
Relevant system information:
- OS: Ubuntu 20.04
- PostgreSQL version (output of
postgres --version): 12 - TimescaleDB version (output of
\dxinpsql): 1.7.2 - Installation method: using Docker
Describe the bug
I have a database where I do a lot of selects from my application that read a big number of rows (10k+) from different tables.
I noticed that a Background Worker Scheduler will consume a huge amount of memory and never release it, even if I close my application, as shown in this image:
My postgresql.conf is the default from the docker, but here are some of the possible relevant values:
shared_buffers = 2GB
work_mem = 1747kB
maintenance_work_mem = 1GB
max_wal_size = 1GB
effective_cache_size = 6GB
timescaledb.max_background_workers = 8
If I try to limit the memory available to the Docker container, The worker will be killed after some time probably due to OOM and the database will go to recovery mode:
my_postgres | 2020-07-24 00:10:42.114 UTC [1] LOG:  background worker "TimescaleDB Background Worker Scheduler" (PID 29) was terminated by signal 9: Killed
my_postgres | 2020-07-24 00:10:42.114 UTC [1] LOG:  terminating any other active server processes
my_postgres | 2020-07-24 00:10:42.114 UTC [5209] WARNING:  terminating connection because of crash of another server process
my_postgres | 2020-07-24 00:10:42.114 UTC [5209] DETAIL:  The postmaster has commanded this server process to roll back the current transaction and exit, because another server process exited abnormally and possibly corrupted shared memory.
my_postgres | 2020-07-24 00:10:42.114 UTC [5209] HINT:  In a moment you should be able to reconnect to the database and repeat your command.
To Reproduce
I'm not so sure how to explain how to reproduce since this would need basically my application running, but I will try to pinpoint some important things.
My system needs to read a lot of rows (more than 10k+ lines normally) from each table from my database during a load procedure. This will be done in parallel 10 at a time.
So basically the system chooses 10 tables, read the rows, do some computation with it then choose another 10 tables and do the same until it read all the tables in the database.
This database has 12945 tables, maybe this has some influence on the worker memory usage?
Expected behavior
Background Worker Scheduler would use way less ram following the config parameters and then releasing it when not needed anymore.
Actual behavior
Background Worker Scheduler increases ram consumption infinitely until OOM, never releasing it.
 sezaru
All 5 comments
Just as an update, I'm currently isolating every part of my backend that does something to the database so I can test it in isolation so we can easily close the scope of what really is triggering it.
I do suspect it is when I run the selects described in the post above, but I want to try that so I'm 100% sure it is that and avoid giving you guys wrong information.
I will update here with my findings when I finish that.
sezaru
on 24 Jul 2020
I think I found the culprit.
I did a test where I was able to reproduce the issue in a controlled manner, basically, I did the following steps:
First I created the 12945 tables and populated each one with 1000 rows with a timestamp that would force this data to be stored in chunks that need to be compressed via options chunk_time_interval and add_compress_chunk_policy.
After that, for each table I ran the following queries:
Disable the table job:
select alter_job_schedule($1, next_start => $2)
where$1is the job_id of the table and$2is a timestamp 10 years ahead.Decompress the table chunks:
select decompress_chunk(c.chunk_name)
from (select show_chunks($1::text) as chunk_name
      except (select show_chunks($1::text, older_than => $2::timestamp))) as c
inner join timescaledb_information.compressed_chunk_stats i on i.chunk_name = c.chunk_name
where i.compression_status = 'Compressed'
Where $1 is the table name and $2 is a timestamp 10 years old.
- Re-enable the table job:
select alter_job_schedule($1, next_start => now())``
Where
$1` is the job id.
What this do is basically add a lot of chunks to be compressed jobs to the Background Worker Scheduler.
I can confirm this via log since I start to get a lot of WARNING: failed to launch job <num> "Compress Chunk Background Job": out of background workers.
This will start to make Background Worker Scheduler use more and more memory, it will stop when all the jobs finished, but it will never release the memory already used.
Also, If I do the above queries again, disabling the job again, decompressing chunks and then reenabling the job, Background Worker Scheduler will get these new jobs, will run then and will keep growing in memory.
If I repeat the queries more times it will grow the memory until OOM.
Now, with that said, what I don't get is why Background Worker Scheduler doesn't release the memory used by the job after the job is finished. Do you have any suggestions?
sezaru
on 24 Jul 2020
I found similar issue.
we use this image: docker pull timescale/timescaledb:1.7.2-pg11
we just use caggr, did not use compression.
timescaledb.max_background_workers = 8
max_worker_processes=19
max_parallel_workers=8
we created about 800 caggr view for 800 tables, each table just have one caggr view.
40 out of 800 caggr view will rollup to one hour from 30 seconds or 1 minutes.
and rest of it will rollup to 10 minutes from 30 seconds.
we found that the Background Worker Scheduler memory keep increasing.
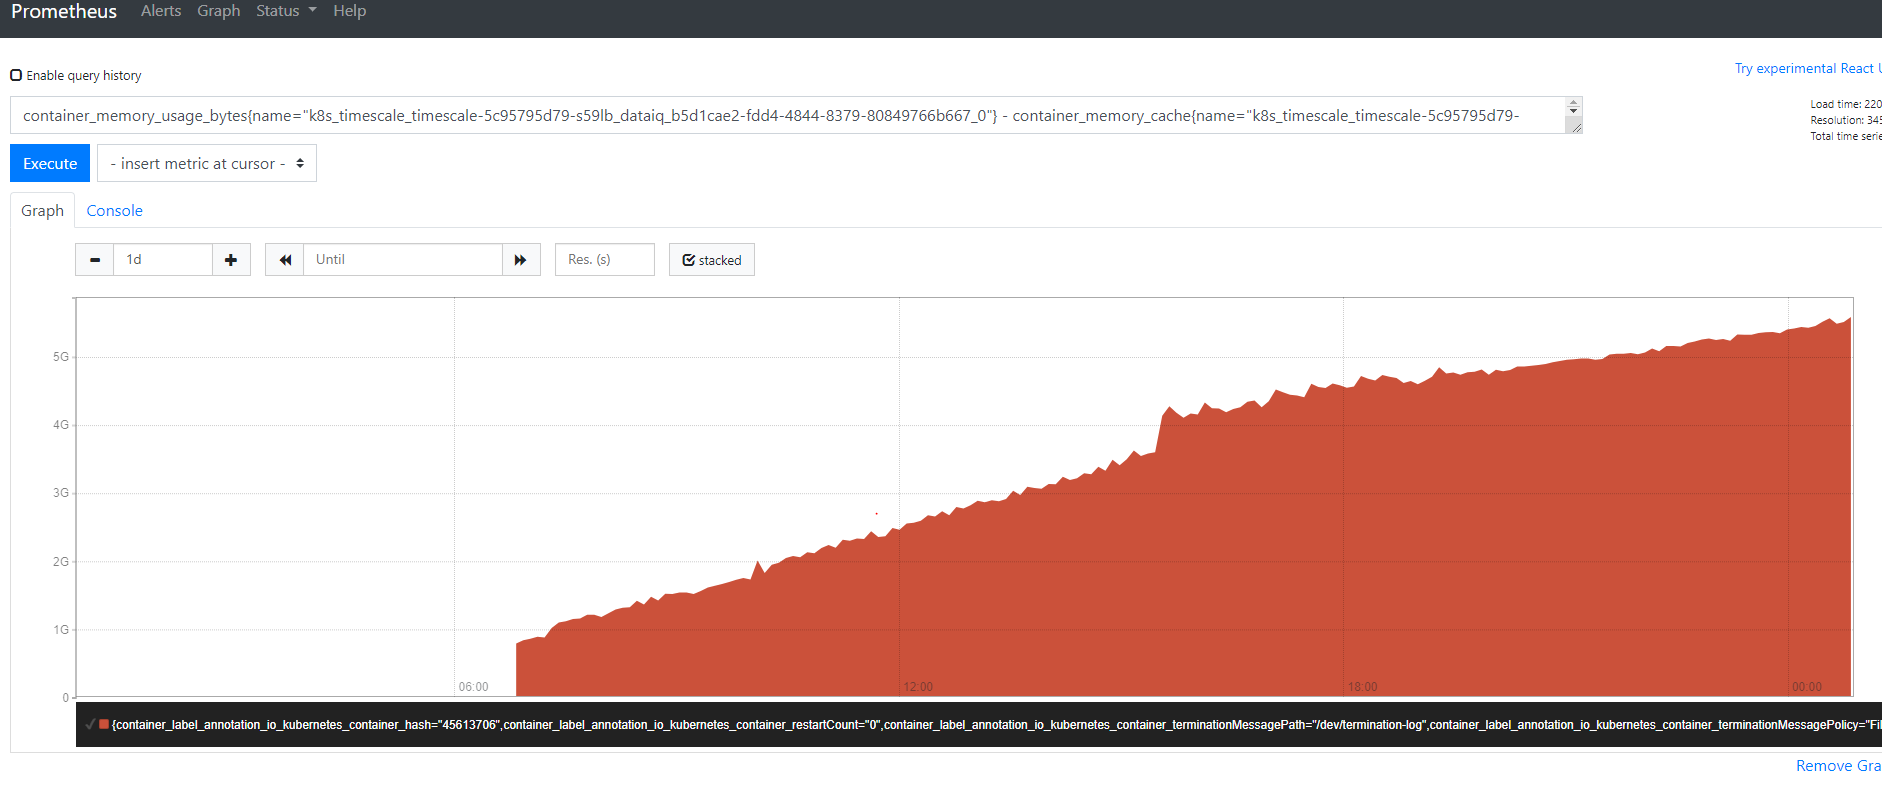
this is the overall container memory monitoring.
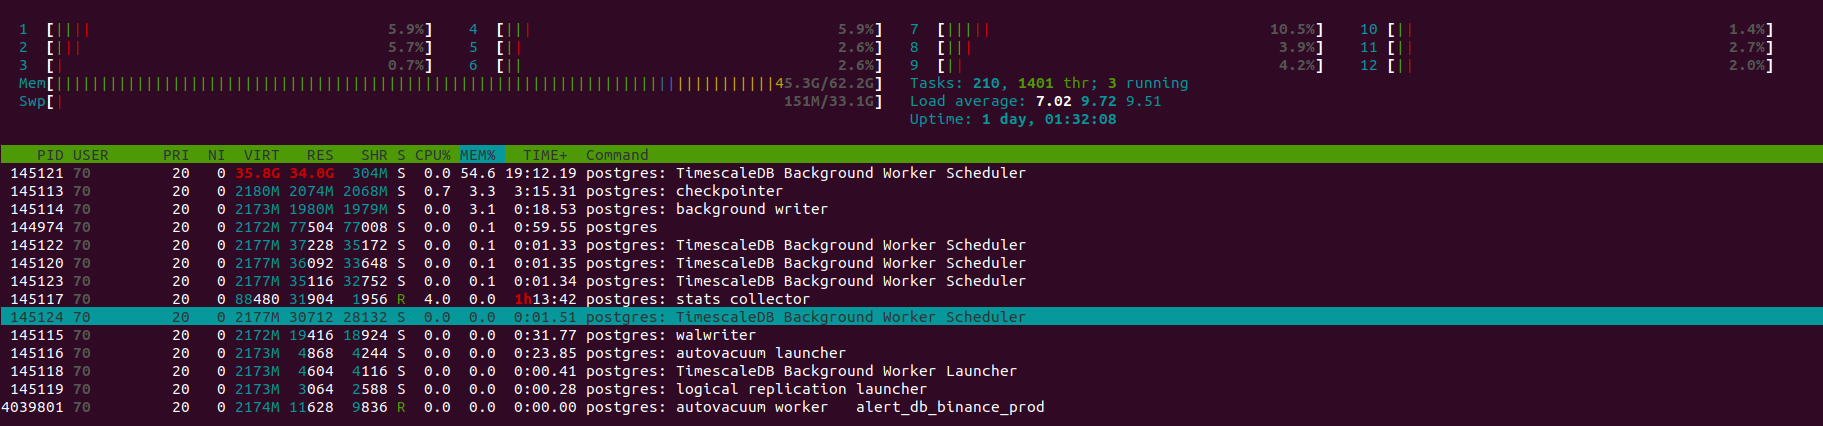
From top cli, we also found that the Background Worker Scheduler memory keep increasing.
 ehaizha
on 29 Jul 2020
ehaizha
on 29 Jul 2020
I believe @ehaizha was also seeing a lot of "failed to launch bgw worker" errors in logs:
2020-07-27 10:48:32.753 UTC [31] WARNING: failed to launch job 1643 "Continuous Aggregate Background Job": out of background workers
2020-07-27 10:48:32.753 UTC [31] WARNING: failed to launch job 1497 "Continuous Aggregate Background Job": out of background workers
 mfreed
on 29 Jul 2020
mfreed
on 29 Jul 2020
@mfreed yes, there a lot of "failed to launch bgw worker" errors in logs.
and I found that there 2 TimescaleDB Background Worker Scheduler process:

not sure it is expected or not.
ehaizha
on 29 Jul 2020
Related issues
 Manjureka
·
4Comments
Manjureka
·
4Comments
 jthornhill
·
4Comments
jthornhill
·
4Comments
 tkurki
·
3Comments
tkurki
·
3Comments
 sanpa1977
·
5Comments
sanpa1977
·
5Comments
 ya-jeks
·
3Comments
ya-jeks
·
3Comments
Most helpful comment
Just as an update, I'm currently isolating every part of my backend that does something to the database so I can test it in isolation so we can easily close the scope of what really is triggering it.
I do suspect it is when I run the selects described in the post above, but I want to try that so I'm 100% sure it is that and avoid giving you guys wrong information.
I will update here with my findings when I finish that.