Bug Report
What version of TiKV are you using?
Versions that I know of: 4.0.10, 5.0.0-rc
What operating system and CPU are you using?
Steps to reproduce
What did you expect?
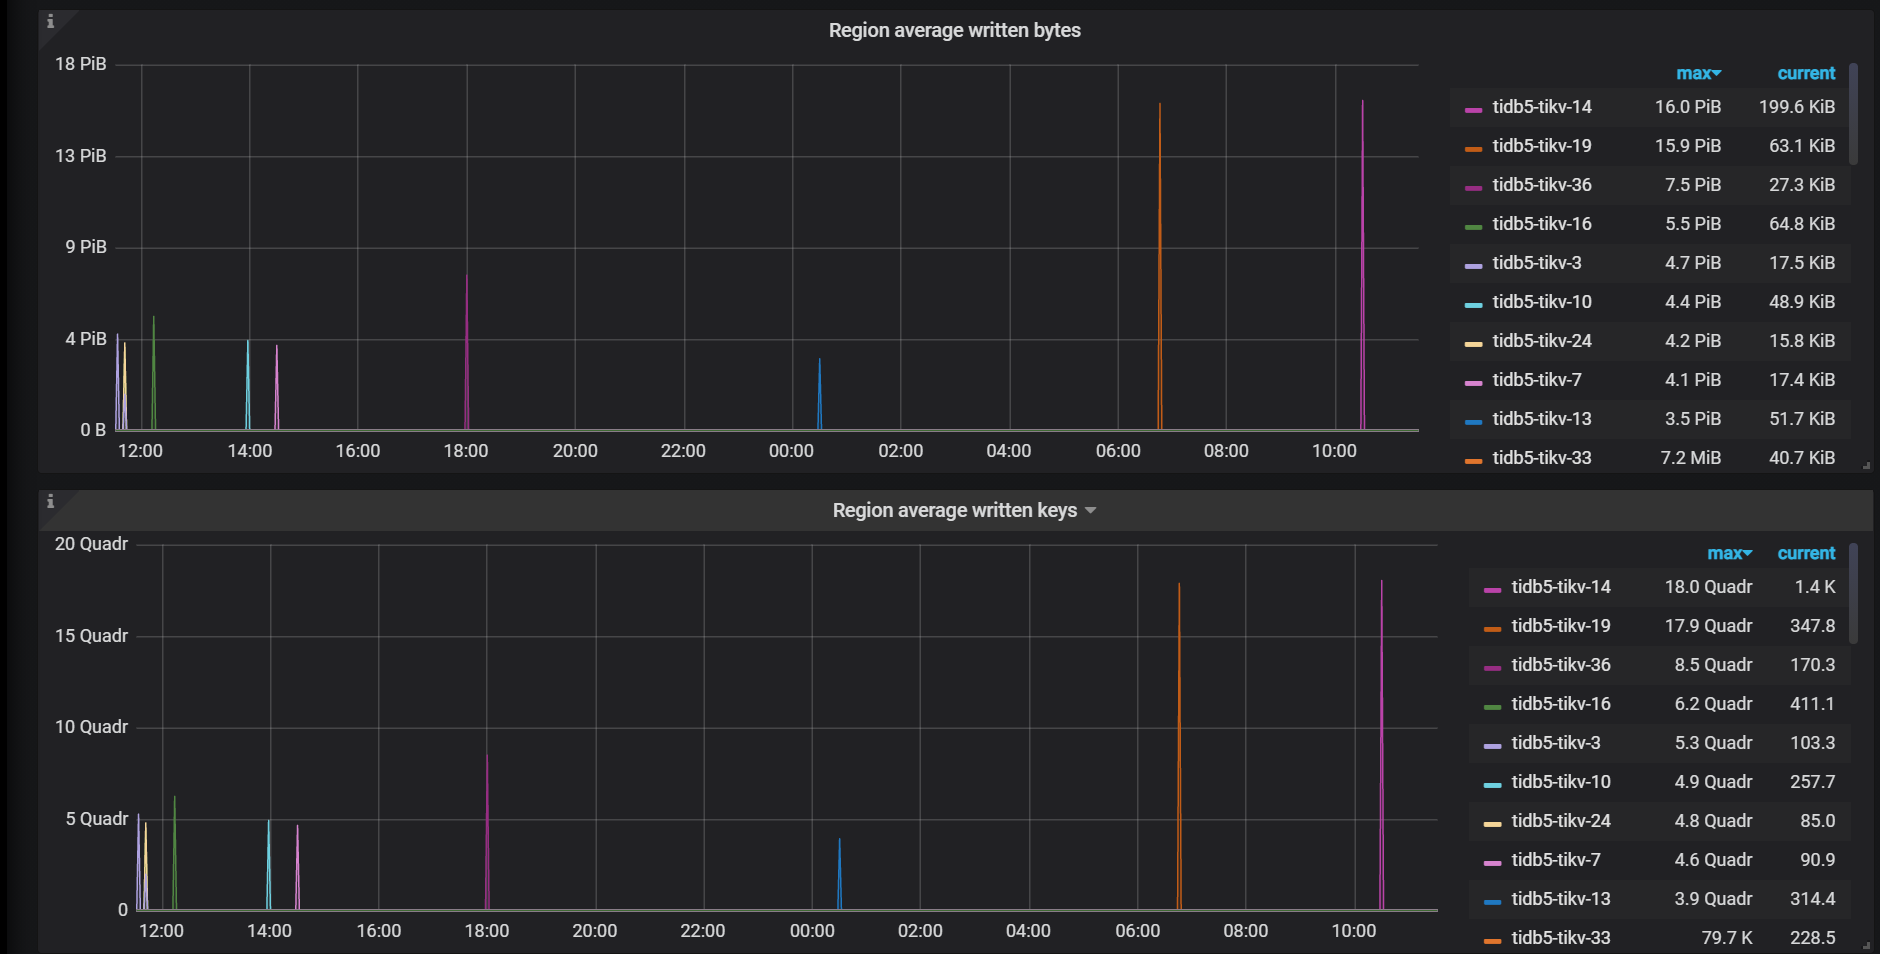
Value of region written bytes make sense, and is relatively stable.
What did happened?
In this case (5.0.0-rc), service is running normally, but region written bytes reach multiple PBs
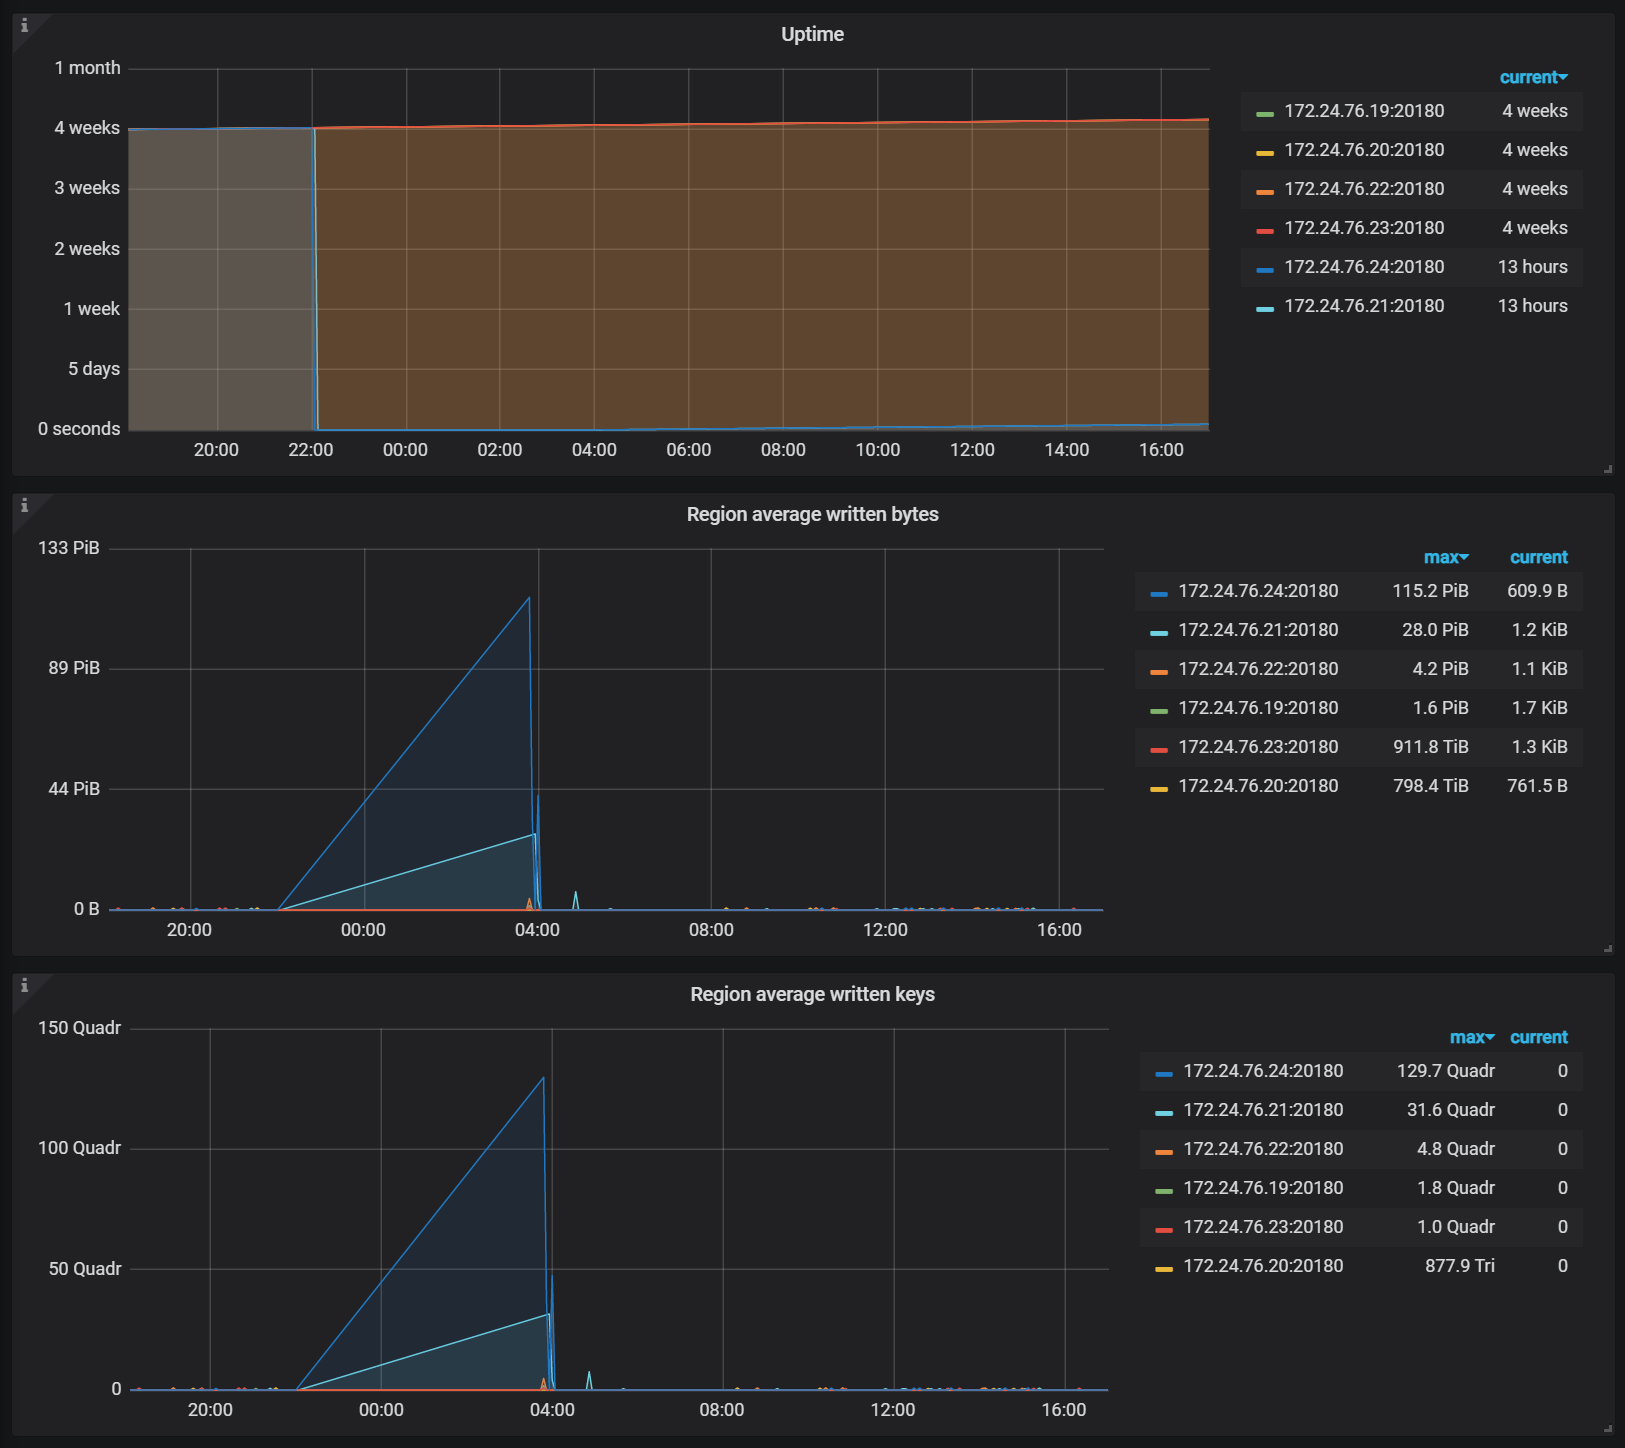
In this case (4.0.10), two down servers worsen the abnormal state
 tabokie
All 7 comments
In one of the cases, the tikv_region_written_bytes_sum value is 1.8e19, it's likely a u64 overflow, possibly caused by written_bytes_delta calculation during heartbeat task.
tabokie
on 12 Mar 2021
Because the average written bytes keeps growing, and it's calculated by
let written_bytes = current_written_bytes - last_written_bytes;
last_written_bytes = current_written_bytes;
. If it's underflow, then current_written_bytes keeps decreasing for more than 5 hours, which doesn't seem reasonable.
 BusyJay
on 10 May 2021
BusyJay
on 10 May 2021
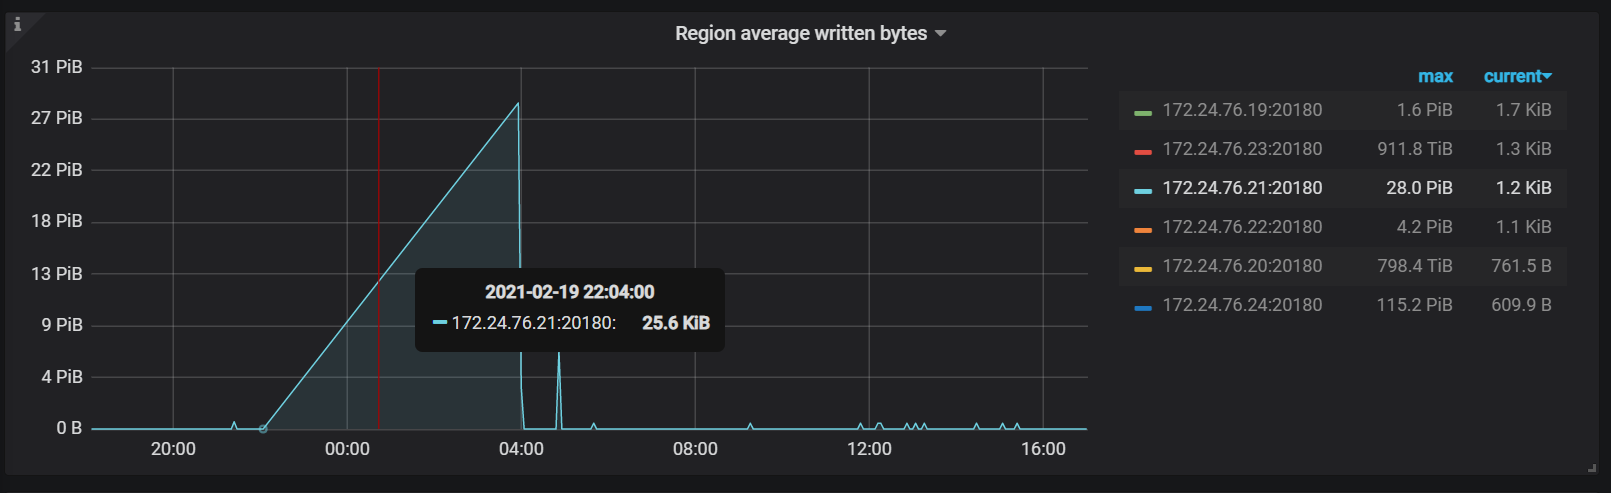
@BusyJay Are you referring to the second screenshot? I recheck the metrics, it seems like something wrong with grafana, the linear graph is a display error:
tabokie
on 10 May 2021
So it seems like the metrics is not updated for 5 hours, and then hit underflow?
BusyJay
on 10 May 2021
Is the region scheduling affected by these stats?
/severity moderate
 cosven
on 11 May 2021
cosven
on 11 May 2021
If metrics is not updated for 5 hours, then either the clock of the prometheus machine jumps or tikv/pd thread is stuck for 5 hours. If the latter is the case, and only pd thread is stuck, then scheduling will not work for the time; if tikv is stuck, then it should be completely out of service.
BusyJay
on 11 May 2021
If metrics is not updated for 5 hours, then either the clock of the prometheus machine jumps or tikv/pd thread is stuck for 5 hours. If the latter is the case, and only pd thread is stuck, then scheduling will not work for the time; if tikv is stuck, then it should be completely out of service.
I think during this 5 hours the two problematic servers stayed down, thus no metrics reporting.
tabokie
on 12 May 2021
Related issues
 elimist3
·
3Comments
elimist3
·
3Comments
 AndreMouche
·
8Comments
AndreMouche
·
8Comments
 hicqu
·
5Comments
hicqu
·
5Comments
 fredchenbj
·
8Comments
fredchenbj
·
8Comments
 abo
·
8Comments
abo
·
8Comments