Tidb: The query is too slow,How to optimize performance?

 Lyle-liang
All 24 comments
Hi, @Lyle-liang . Please use the default template to summit an issue.
BTW: the first plot was not uploaded successful.
 jackysp
on 13 Oct 2018
jackysp
on 13 Oct 2018
@jackysp
- What did you do?
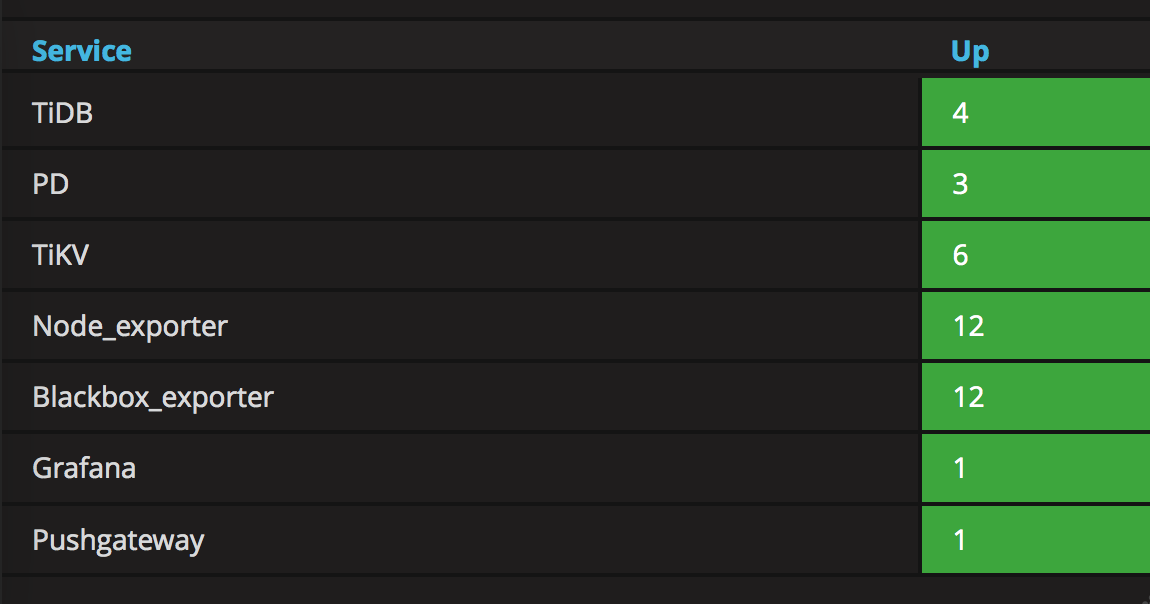
Cluster information:
TiDB: 3 mem:120G cpu:8
PD: 3 mem:120G cpu:16
TiKV: 6 mem:120G cpu:16
Tide-ansible v2.6.5
- What did you expect to see?
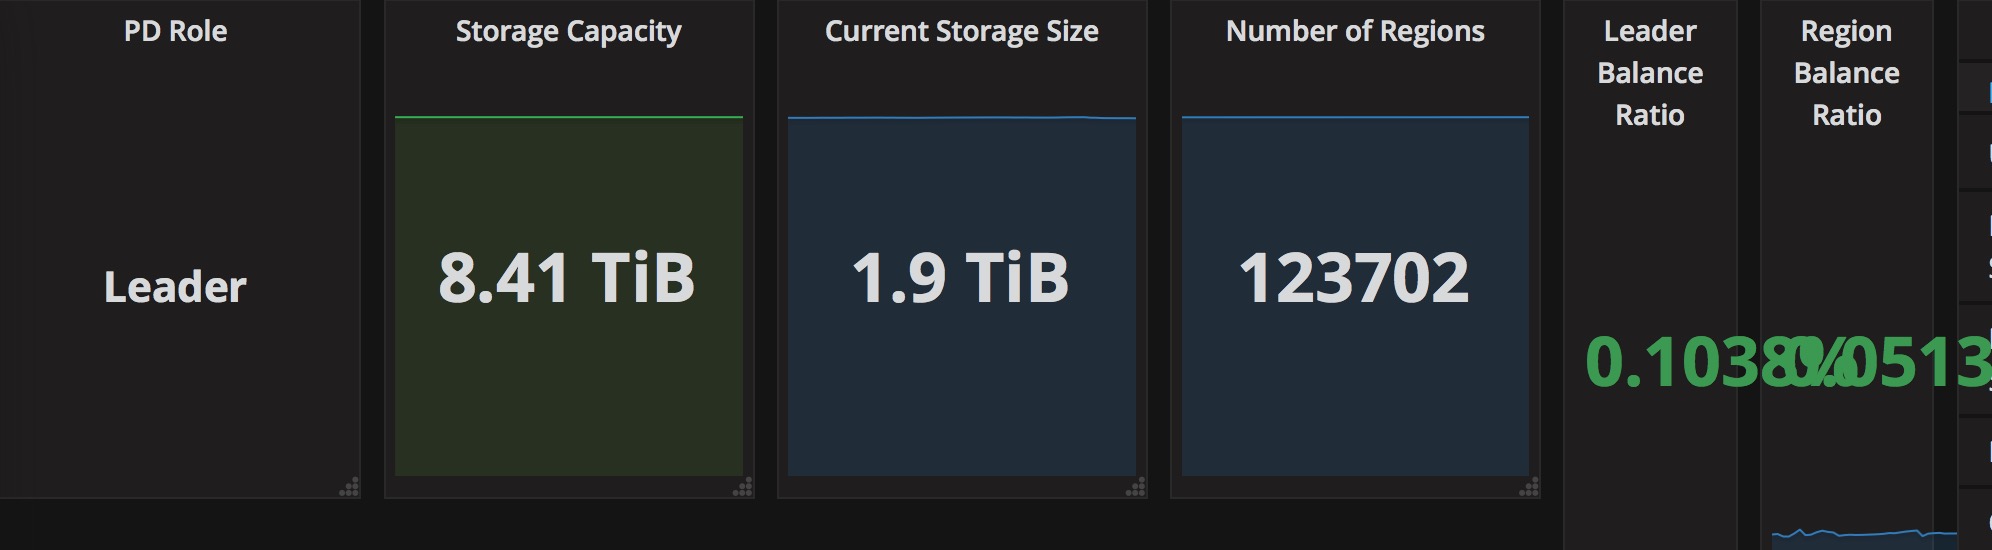
Current Data Storage : 2T ,Continuous writing
execute SQL time: about 10s
- What version of TiDB are you using (
tidb-server -Vor runselect tidb_version();on TiDB)?
TiDB version 2.1.0-rc.2
- What can I do for it? What are the optimization suggestions?
Thanks.
Lyle-liang
on 13 Oct 2018
Thanks for your providing these detail information, @Lyle-liang !
I have one question for you. What does "Continuous writing"? Or what's the workload of your cluster?
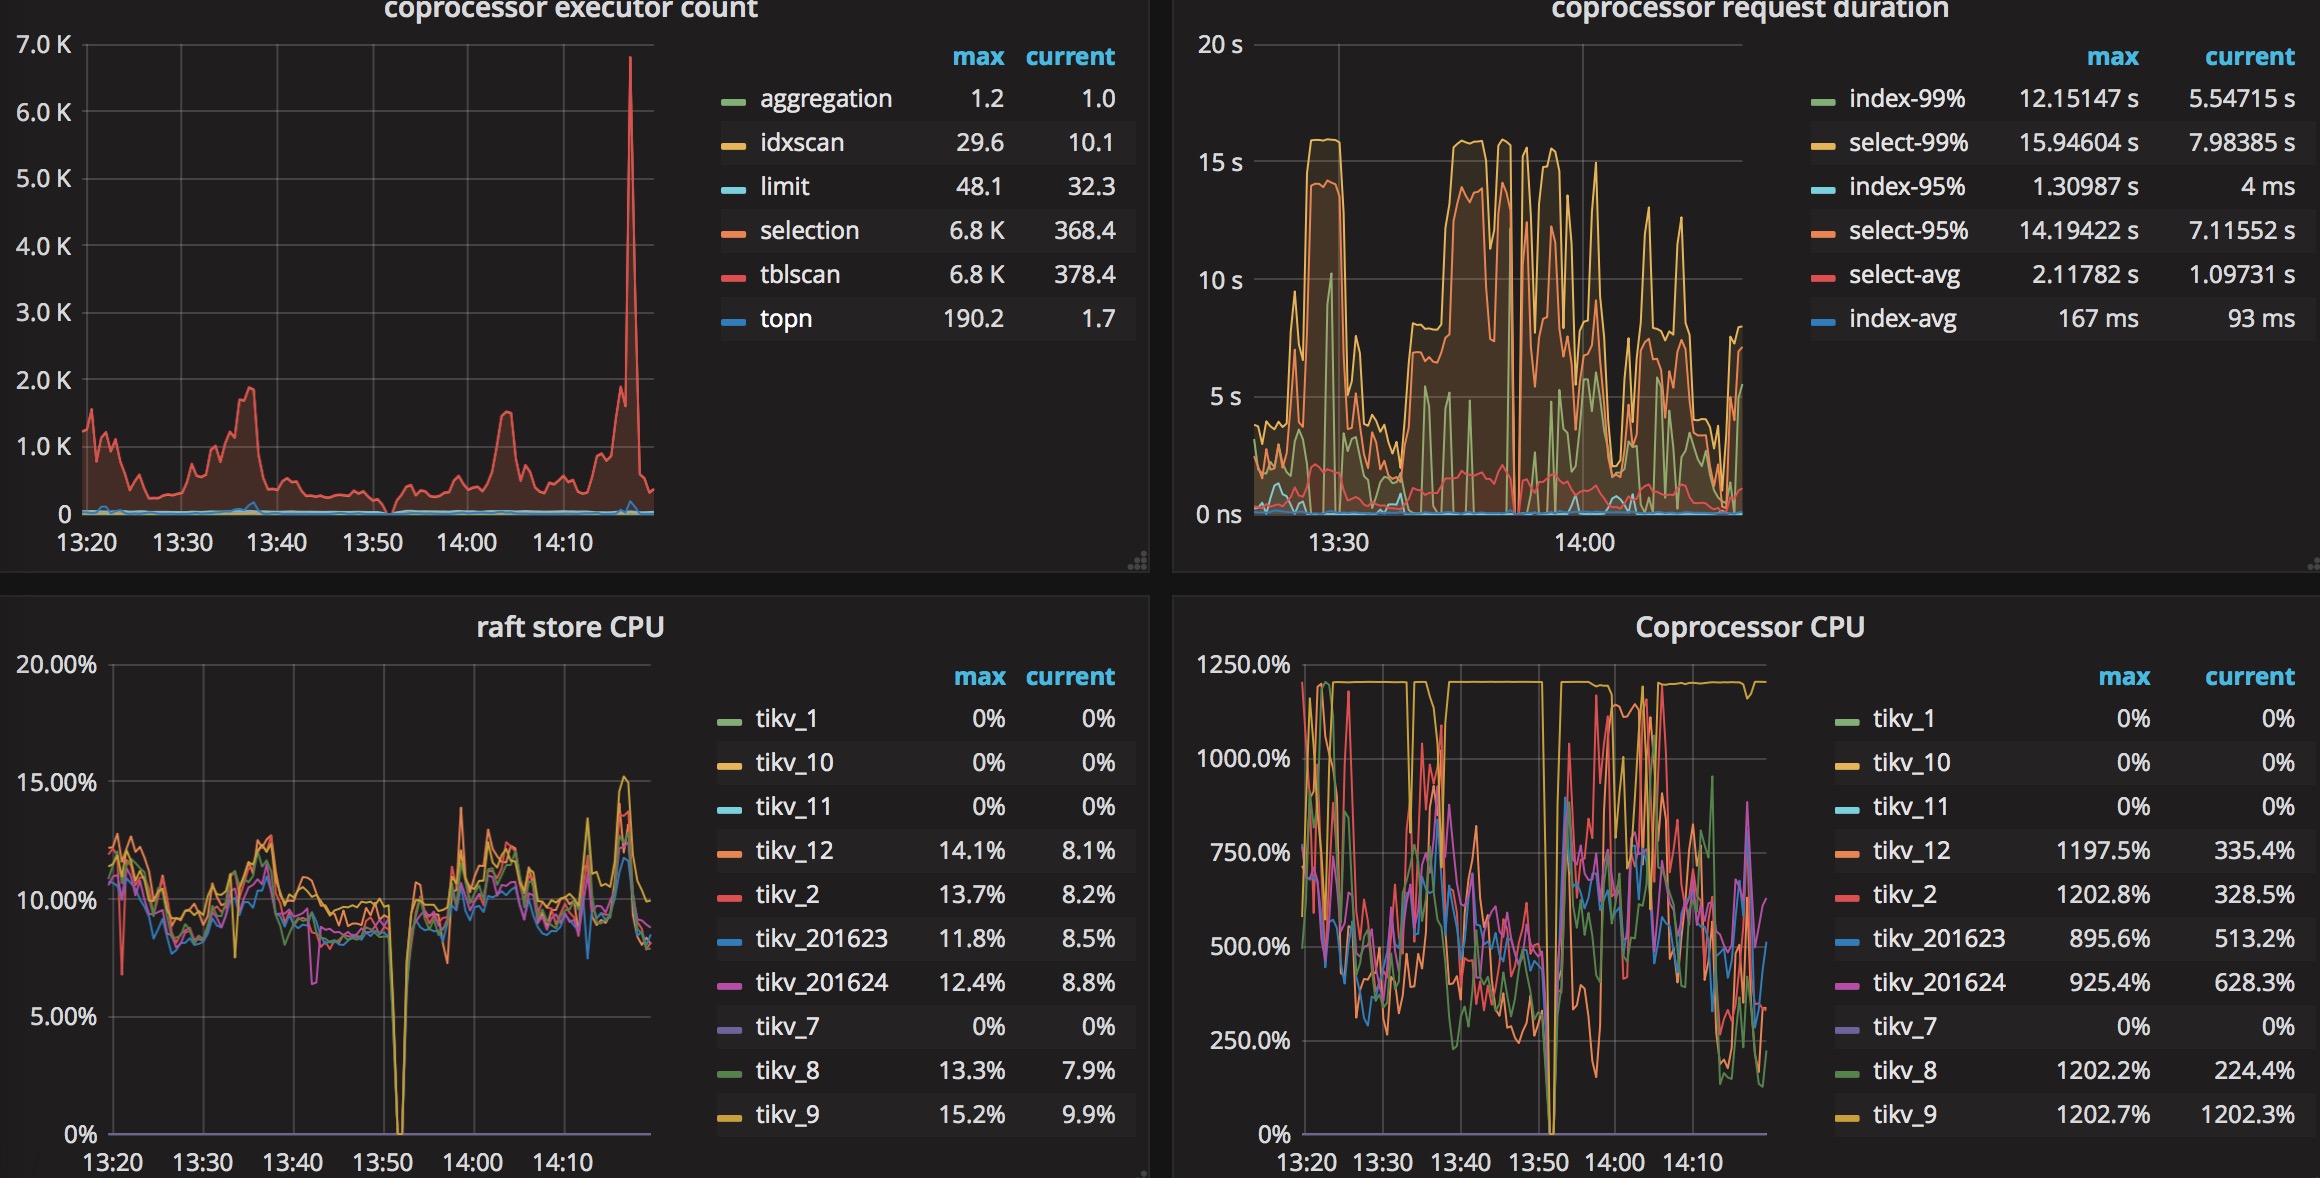
It seems your coprocessor CPU goes to very high but the raft store is very slow. It could be some heavy reading workload instead of writing ones. Only one TiKV reach the CPU uplimit, I think there are some hot region in your workload.
For the cluster deployment, I have one suggestion that it will waste some resources if you deploy the PD server to a Hi-end machine. It could be deployed on the TiDB/TiKV server.
jackysp
on 13 Oct 2018
@jackysp
This is the last 4 hours of query time between TiDB and mysql . (unit: ms)
Purple:TiDB
Blue:mysql

Lyle-liang
on 13 Oct 2018
@jackysp
Don't care about "Continuous writing". I want to tune cluster parameters for better performance. Thanks.
Lyle-liang
on 13 Oct 2018
@Lyle-liang without the detail workload, I cannot give my suggestion for tuning the performance. Please follow our tuning guide yourself https://github.com/pingcap/docs/blob/master/op-guide/tune-tikv.md
jackysp
on 14 Oct 2018
@jackysp I plan to use TIDB as an archive database. Max statement ops is 100. Now write performance is good and read performance is poor. So can you give me some good suggestions?
Lyle-liang
on 14 Oct 2018
@jackysp I have read Official document and optimized the parameters of tikv, but read performance is the same before.
Lyle-liang
on 14 Oct 2018
It's glad to see more details of your workload, @Lyle-liang !
Could you provide us the following information to help to locate why the SQL runs slow:
- the execution plan of this SQL in TiDB
explain format="dot" select ...
explain select ...
- TiDB version and the exact git commit hash value.
select tidb_version()\G
- the
create tablestatement for the involved tables
show create table ${involved_table_1}\G
show create table ${involved_table_2}\G
...
- the statistics data of the involved tables
curl -G "http://${tidb-server-ip}:${tidb-server-status-port}/stats/dump/${db_name}/${table_name}" > ${table_name}_stats.json
- is the query always slow, or just occasionally
jackysp
on 14 Oct 2018
@jackysp Thanks very much. But because of security, I can only give you results.
1.
explain format="dot" select ...
digraph Projection_7 {
subgraph cluster7{
node [style=filled, color=lightgrey]
color=black
label = "root"
"Projection_7" -> "TopN_10"
"TopN_10" -> "IndexLookUp_34"
}
subgraph cluster33{
node [style=filled, color=lightgrey]
color=black
label = "cop"
"Selection_33" -> "TableScan_32"
}
subgraph cluster31{
node [style=filled, color=lightgrey]
color=black
label = "cop"
"IndexScan_31"
}
"IndexLookUp_34" -> "Selection_33"
"IndexLookUp_34" -> "IndexScan_31"
}
2.
select tidb_version()
Release Version: v2.1.0-rc.2-48-g6a1e94f
Git Commit Hash: 6a1e94ffa6a7d7cd66d1c433d29e358e07c4498b
Git Branch: release-2.1
UTC Build Time: 2018-09-29 02:54:08
GoVersion: go version go1.11 linux/amd64
Race Enabled: false
TiKV Min Version: 2.1.0-alpha.1-ff3dd160846b7d1aed9079c389fc188f7f5ea13e
Check Table Before Drop: false
3.
CREATE TABLE
t_test(
idbigint(20) unsigned NOT NULL AUTO_INCREMENT,
versionbigint(20) unsigned NOT NULL DEFAULT '1',
_idbigint(20) unsigned NOT NULL,
r_idbigint(20) unsigned NOT NULL,
er_idbigint(20) unsigned NOT NULL,
f_r_idbigint(20) unsigned NOT NULL DEFAULT '0' ,
f_er_idbigint(20) unsigned NOT NULL DEFAULT '0',
slvarchar(20) NOT NULL COMMENT '交易对',
tptinyint(3) unsigned NOT NULL,
setinyint(3) unsigned NOT NULL,
fttinyint(3) unsigned NOT NULL DEFAULT '0',
f_stinyint(3) unsigned NOT NULL DEFAULT '0',
rotinyint(3) unsigned NOT NULL,
prdecimal(36,18) unsigned NOT NULL DEFAULT '0.000000000000000000',
f_atdecimal(36,18) unsigned NOT NULL DEFAULT '0.000000000000000000',
uf_atdecimal(36,18) unsigned NOT NULL DEFAULT '0.000000000000000000',
fc_atdecimal(36,18) unsigned NOT NULL DEFAULT '0.000000000000000000',
fd_fdecimal(36,18) unsigned NOT NULL DEFAULT '0.000000000000000000',
fd_f_fdecimal(36,18) unsigned NOT NULL DEFAULT '0.000000000000000000',
created_atbigint(20) unsigned NOT NULL,
updated_atbigint(20) unsigned NOT NULL,
PRIMARY KEY (id),
UNIQUE KEYuniq_of(er_id,_id,f_er_id) USING BTREE,
KEYidx_symbol_userid(sl(6),er_id),
KEYidx_userid_created_at(f_user_id,f_created_at)
) ENGINE=InnoDB AUTO_INCREMENT=701042 DEFAULT CHARSET=utf8 ROW_FORMAT=DYNAMIC;
How can I analysis the json of statistics data?
90% of the query is always slow.
Lyle-liang
on 14 Oct 2018
Thanks, @Lyle-liang ! PTAL @zz-jason .
jackysp
on 14 Oct 2018
@Lyle-liang
According to the result of explain format="dot", the execution plan of the query is:
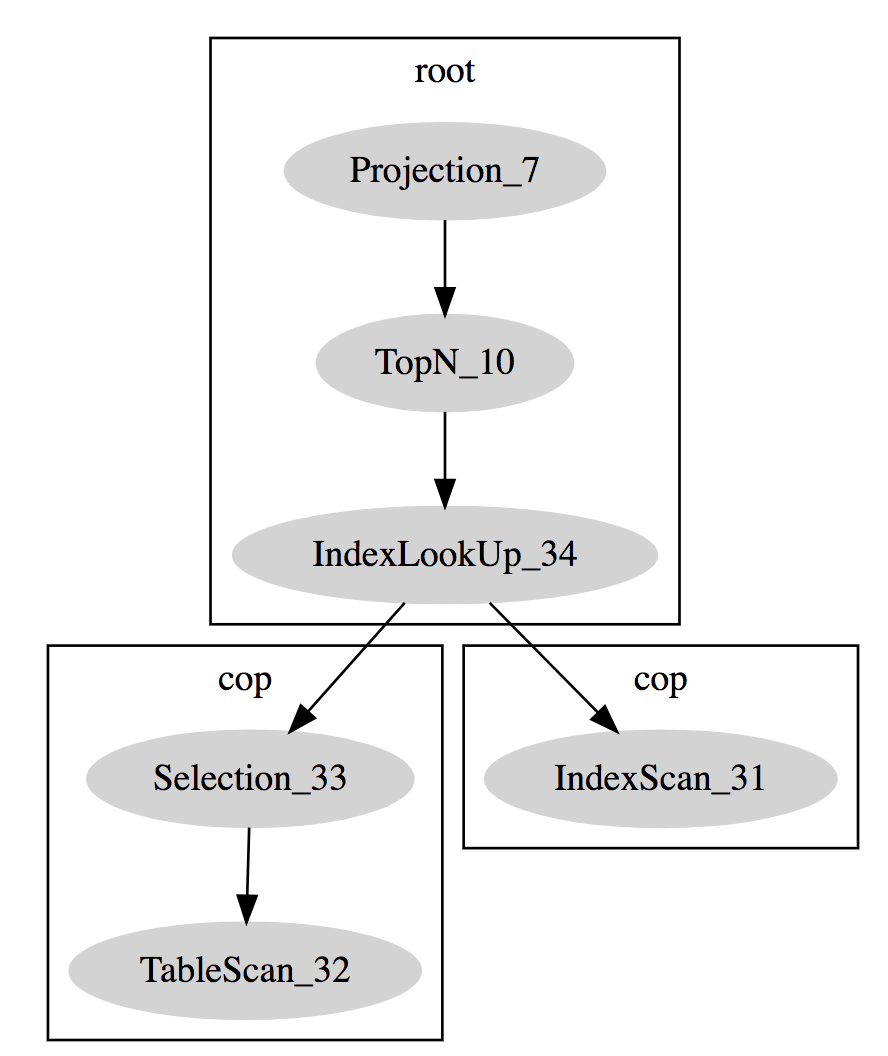
There is a full range index scan, which can cause the tikv cluster busy if the data size of the queried table is too large.
- Could you please provide the exact query so that we can help you improve the performance of the query?
- Could you please provide the detailed execution plan of the query by executing the command
explain ${query}
 zz-jason
on 14 Oct 2018
zz-jason
on 14 Oct 2018
@zz-jason Thanks. I hope the information is useful for you.
create table sql:
CREATE TABLE
t_test(
idbigint(20) unsigned NOT NULL AUTO_INCREMENT,
versionbigint(20) unsigned NOT NULL DEFAULT '1',
avarchar(20) NOT NULL,
bvarchar(10) NOT NULL,
cvarchar(10) NOT NULL,
dbigint(20) unsigned NOT NULL,
edecimal(36,18) unsigned NOT NULL,
fdecimal(36,18) unsigned NOT NULL DEFAULT '0.000000000000000000',
gfloat unsigned NOT NULL DEFAULT '0',
hdecimal(36,18) unsigned NOT NULL DEFAULT '0.000000000000000000',
created_timebigint(20) unsigned NOT NULL,
jtinyint(3) unsigned NOT NULL,
kdecimal(36,18) unsigned NOT NULL DEFAULT '0.000000000000000000',
ldecimal(36,18) unsigned NOT NULL DEFAULT '0.000000000000000000',
mdecimal(36,18) unsigned NOT NULL DEFAULT '0.000000000000000000',
finished_timebigint(20) unsigned NOT NULL DEFAULT '0',
nbigint(20) unsigned NOT NULL,
otinyint(3) unsigned NOT NULL,
ptinyint(3) unsigned NOT NULL,
canceled_timebigint(20) unsigned NOT NULL DEFAULT '0',
updated_timebigint(20) unsigned NOT NULL,
rvarchar(20) NOT NULL DEFAULT '',
svarchar(20) NOT NULL DEFAULT '',
PRIMARY KEY (id),
KEYidx_user_state(n,p),
KEYidx_symbol_account(a(6),d) USING BTREE,
KEYidx_user(n) USING BTREE
) ENGINE=InnoDB AUTO_INCREMENT=443829 DEFAULT CHARSET=utf8 ROW_FORMAT=DYNAMIC;sql:
explain SELECT 'false' AS QUERYID, id,version,a,b,c,d,e,f,g,h,created_time,j,k,l,m, f_finished_at, n,o,p, canceled_time,updated_time, r, s FROM proarcdb.t_test WHERE b = 123456789 AND p IN ( 5,6,7 ) AND created_time > 1522556131460 AND created_time < 1538150399000 ORDER BY id DESC LIMIT 20;
explain ${query}
+--------------------------+-------+------+-----------------------------------------------------------------------------------------------------------------------+
| id | count | task | operator info |
+--------------------------+-------+------+-----------------------------------------------------------------------------------------------------------------------+
| Projection_7 | 0.00 | root | "false", proarcdb.t_test.id,... |
| └─TopN_10 | 0.00 | root | proarcdb.t_test.id:desc, offset:0, count:20 |
| └─IndexLookUp_34 | 0.00 | root | |
| ├─IndexScan_31 | 0.00 | cop | table:t_test, index:n, p, range:[1339248 5,1339248 5], [1339248 6,1339248 6], [1339248 7,1339248 7], keep order:false |
| └─Selection_33 | 0.00 | cop | gt(proarcdb.t_test.created_time, 1522556131460), lt(proarcdb.t_test.created_time, 1538150399000) |
| └─TableScan_32 | 0.00 | cop | table:t_test, keep order:false |
+--------------------------+-------+------+-----------------------------------------------------------------------------------------------------------------------+
Lyle-liang
on 14 Oct 2018
@Lyle-liang
- The
${query}and the result ofexplain ${query}is not match.
The used index is `(n, p)` and the range calculated is: `[1339248 5,1339248 5], [1339248 6,1339248 6], [1339248 7,1339248 7]`

But in the query, the filter is `b = 123456789 AND p IN ( 5,6,7 ) AND created_time > 1522556131460 AND created_time < 1538150399000`. As you can see, there is no filter on column `n`
- The row count estimated is
0.00. Have you analyzed the tableproarcdb.t_test? If not, please analyze the table and check the query plan again:
-- analyze table:
analyze table proarcdb.t_test;

-- check the query plan:
explain select 'false' as queryid, id, version, a, b, c, d, e, f, g, h, created_time, j, k, l, m, f_finished_at, n, o, p, canceled_time, updated_time, r, s
from proarcdb.t_test
where   b = 123456789 and
        p in (5,6,7) and
        created_time > 1522556131460 and
        created_time < 1538150399000
order by id desc
limit 20;

-- it's better to provide the result of the following queries:
select count(*) from proarcdb.t_test where b = 123456789 and p in (5,6,7);
select count(*) from proarcdb.t_test where b = 123456789 and p in (5,6,7) and created_time > 1522556131460 and created_time < 1538150399000;
@zz-jason
show stats_healthy;
proarcdb.t_test | 80
analyze operation is auto.
select count(1) from proarcdb.t_test where n = 123456789 and p in (5,6,7);
985
select count(1) from proarcdb.t_test where n = 123456789 and p in (5,6,7) and created_time > 1522556131460 and created_time < 1538150399000;
821
sorry,sql like that:
explain SELECT 'false' AS QUERYID, id,version,a,b,c,d,e,f,g,h,created_time,j,k,l,m, f_finished_at, n,o,p, canceled_time,updated_time, r, s FROM proarcdb.t_test WHERE n = 123456789 AND p IN ( 5,6,7 ) AND created_time > 1522556131460 AND created_time < 1538150399000 ORDER BY id DESC LIMIT 20;
Lyle-liang
on 15 Oct 2018
@Lyle-liang It seems that the query plan for this sql is correct. Is the query always slow, or just occasionally?
zz-jason
on 15 Oct 2018
@zz-jason The query always show slow query。
Lyle-liang
on 15 Oct 2018
@zz-jason
Lyle-liang
on 15 Oct 2018
@Lyle-liang The image can not be loaded. How long does it take to run the query when the cluster is not busy?
zz-jason
on 15 Oct 2018
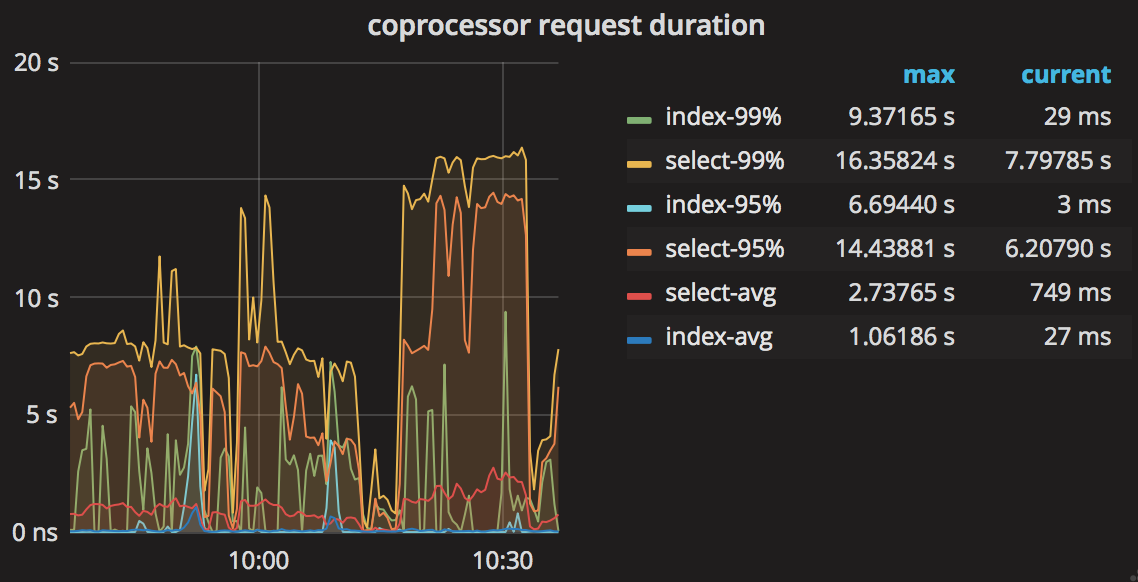
@zz-jason
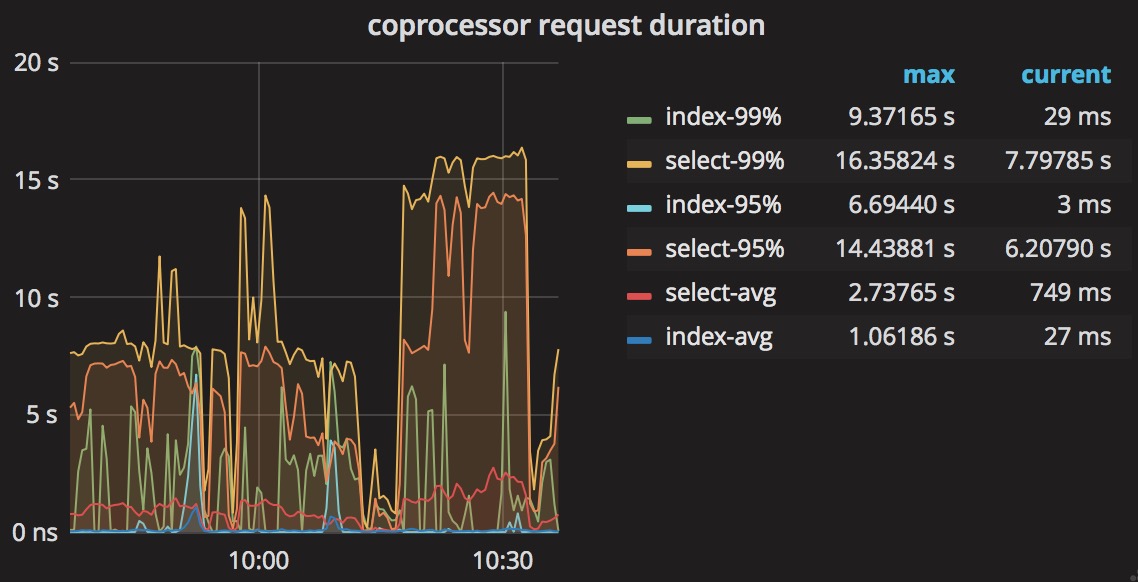
The picture show coprocessor request duration.
The sql costs 500-900ms.
Lyle-liang
on 15 Oct 2018
@Lyle-liang the coprocessor request duration can be affected by other queries, I think this query maybe is not the root cause which slows down the TPS/QPS/OPS, is there any other slow queries? Could you provide us the tidb log?
zz-jason
on 15 Oct 2018
@Lyle-liang can we get access to the TiDB Grafana Monitor?
zz-jason
on 15 Oct 2018
@zz-jason
Can we communicate through WeChat?
WeChat ID:13609827103
Lyle-liang
on 15 Oct 2018
I am going to close this issue as stale. Please feel free to re-open if you have additional questions. Thanks!
 nullnotnil
on 23 Jul 2020
nullnotnil
on 23 Jul 2020
Related issues
 breeswish
·
3Comments
breeswish
·
3Comments
 ekexium
·
3Comments
ekexium
·
3Comments
 wwar
·
3Comments
wwar
·
3Comments
 tennix
·
3Comments
tennix
·
3Comments
 francis0407
·
3Comments
francis0407
·
3Comments