Three.js: Rendering stops when tab becomes invisible for a while.
Description of the problem
When a tab containing a three.js renderer loses visibility for about a minute (but sometimes longer). The renderer stops working and renders just a single color.
The bug is reproducible in the editor with an empty scene, where the rendered part of the page becomes white. In our game the renderer becomes dark grey. I'm not sure what determines the color.
When I add some of our assets to the editor, instead of becoming white, I see a white bar at the top with the rest becoming grey. This is the same color as what I'm seeing in the build of our game.
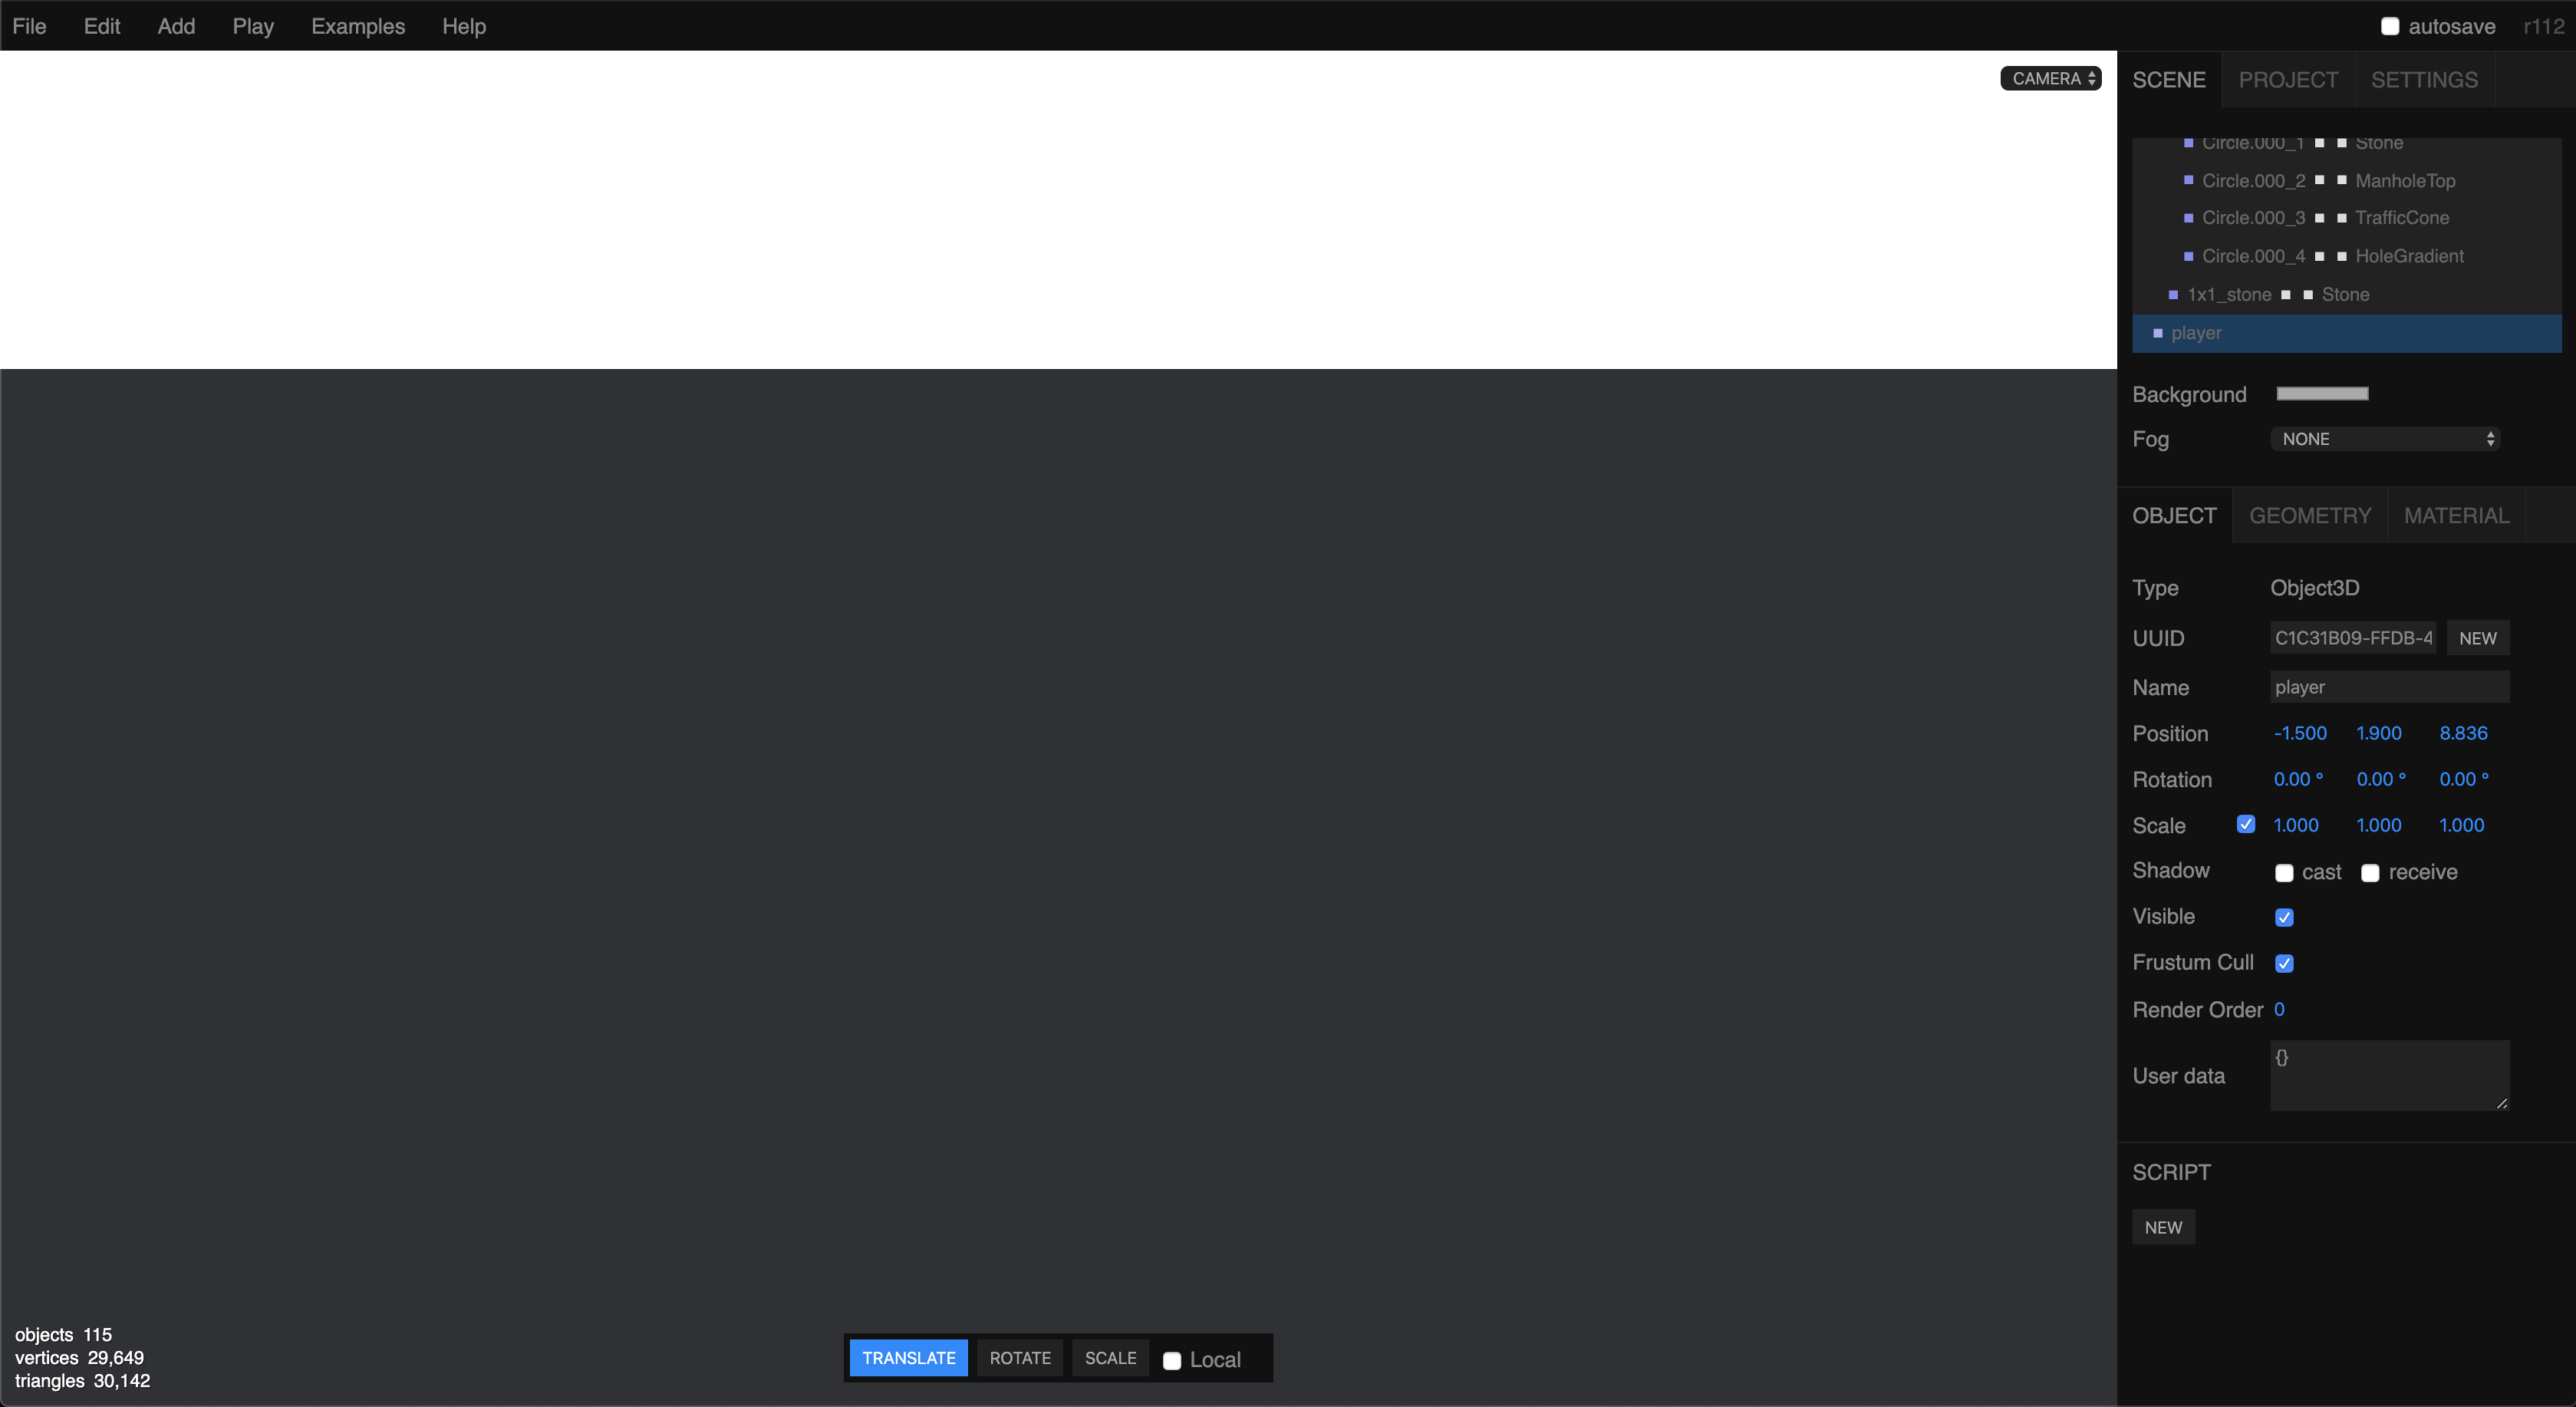
Though I've seen a similar bar at the top of our build with two different shades of grey as well.
Resizing the renderer seems to resolve the issue. So I think a temporary workaround could be to resize the renderer by one pixel in the visibilitychange event, but I haven't tested this yet.
It seems like this is only happening on macOS. I've confirmed it doesn't happen on a Windows computer with an Nvidia card. I'm running macOS 10.15.2 Catalina. I haven't tried it on other versions of macOS.
I'm running threejs r112. And it seems to not be happening on r105. I'll try other versions to figure out where exactly the issue started happening.
Three.js version
- [ ] Dev
- [x] r112
Browser
- [ ] All of them
- [x] Chrome
- [ ] Firefox
- [ ] Internet Explorer
OS
- [ ] All of them
- [ ] Windows
- [x] macOS
- [ ] Linux
- [ ] Android
- [ ] iOS
 jespertheend
All 12 comments
I'm starting to believe this is an issue with chrome. Often multiple tabs crash like this at once, and when our page is embedded in an iframe. It actually renders the entire WebGL canvas as transparent. Showing the content that is behind the iframe.
Furthermore, I just had the same thing happen in the r105 editor.
jespertheend
on 24 Jan 2020
I've tested this today several times and I'm unable to reproduce this issue on my system: iMac with macOS 10.15.2 and Chrome 79.0.3945.130. Tested with the editor and the examples.
Do you see any error messages in the browser console when this problem occurs?
 Mugen87
on 24 Jan 2020
Mugen87
on 24 Jan 2020
I was seeing the same issue in the past couple weeks (macOS Catalina, 2012 Macbook Pro). Inclined to guess it's a browser or OS issue, but I don't remember seeing any error messages.
 donmccurdy
on 24 Jan 2020
donmccurdy
on 24 Jan 2020
@Mugen87 I have access to two MacBooks and I can reproduce the issue on both systems. It could be related to the video card perhaps. That would explain why it might not be reproducible on your iMac. I'm on Chrome 79.0.3945.130 as well. No error messages unfortunately.
@donmccurdy ah good to know I'm not the only one. I have also only been seeing this issue in the past couple of weeks. We updated to r112 a few weeks ago so that's why I thought it was a regression in three.js. But now it's starting to look like it's an issue with Chrome. I'll try out more WebGL pages that don't use three.js. Perhaps they are having the same issue.
jespertheend
on 24 Jan 2020
We updated to r112 a few weeks ago so that's why I thought it was a regression in three.js.
If the issue can be produced with an empty scene in the editor and only with Chrome, I doubt that there is a regression in the library. Consider to file a bug at https://bugs.chromium.org/p/chromium/issues/list
Mugen87
on 24 Jan 2020
I just tried it in firefox and the issue doesn't seem to be happening there. So yeah most likely an issue with Chrome.
jespertheend
on 24 Jan 2020
could it be context loss?
 makc
on 26 Jan 2020
makc
on 26 Jan 2020
@makc I don't think so. I believe context loss spews a whole bunch of errors and warnings in the console. And when I resize the renderer, it starts rendering again.
jespertheend
on 26 Jan 2020
Anything in the Log Messages part of chrome://gpu/?
Also some of the command line switches could be worth a try, maybe
--disable-renderer-backgrounding
Prevent renderer process backgrounding when set
or --max-active-webgl-contexts if it affects multiple tabs at once.
 moraxy
on 26 Jan 2020
moraxy
on 26 Jan 2020
I believe context loss spews a whole bunch of errors and warnings in the console.
Yes, a context loss is logged in the browser console as a warning.
Mugen87
on 27 Jan 2020
@jespertheend @Mugen87 Indeed it is an issue with Chrome, as we finally discovered here. Good news is it's already fixed and should roll out shortly.
 elalish
on 30 Jan 2020
elalish
on 30 Jan 2020
 mrdoob
on 30 Jan 2020
mrdoob
on 30 Jan 2020
Related issues
 jlaquinte
·
3Comments
jlaquinte
·
3Comments
 jack-jun
·
3Comments
jack-jun
·
3Comments
 Horray
·
3Comments
Horray
·
3Comments
 fuzihaofzh
·
3Comments
fuzihaofzh
·
3Comments
 boyravikumar
·
3Comments
boyravikumar
·
3Comments
Most helpful comment
@jespertheend @Mugen87 Indeed it is an issue with Chrome, as we finally discovered here. Good news is it's already fixed and should roll out shortly.