Three.js: example animate loop floods call stack in developer console
from the "creating a scene" page in the manual:
If you're new to writing games in the browser, you might say "why don't we just create a setInterval ?" The thing is - we could, but requestAnimationFrame has a number of advantages. Perhaps the most important one is that it pauses when the user navigates to another browser tab, hence not wasting their precious processing power and battery life.
this is true, but when you call the requestAnimationFrame inside the callback this causes a new entry in the call stack in the developer console, after a little while of using the developer console it slows to a crawl and eventually crashes the page.
i suggest changing:
function animate() {
    requestAnimationFrame( animate );
    renderer.render( scene, camera );
}
animate();
to
function animate() {
    renderer.render( scene, camera );
}
setInterval(function(){requestAnimationFrame( animate )},1000/60);
this gives the advantage of requestAnimationFrame (that it won't call the animate function if not in the current tab) but with the advantage of not calling it recursively and filling in the call stack.
also it seems the code in renderer.setAnimationLoop does this same recursive call.
All 15 comments
but when you call the requestAnimationFrame inside the callback this causes a new entry in the call stack in the developer console, after a little while of using the developer console it slows to a crawl and eventually crashes the page.
I've never experienced this. What do I have to do in order to reproduce this issue?
Notice that using requestAnimationLoop like in the docs and our examples is the recommended way of implementing an animation loop.
@tuseroni what browser are you using? And can you confirm that the page crashes when debugging some official examples on the threejs site? As @Mugen87 says, this is the correct way of using requestAnimationFrame, and if the browser is crashing that suggests (a) a bug in the browser or (b) a bug in your app.
while a bug in my app is pretty probable, the call stack explosion does happen on the official examples, i haven't used them long enough and debugged them enough to see if it would eventually cause a crash, but to reproduce do as follows (chrome 75.0.3770.100, i will try again after updating to see that it still happens):
go to any example, i picked the webgl cloth animation bring up the developer console, and press pause. you should see something like the following on the right if you expand "call stack"

this continues down for quite some distance, every one of those has a copy of the stack.
in my app i used setinterval as i showed and that stack only has 2 entries.
i can try and get you more info on if the cpu chugging and app crashing happen when debugging the example apps too, my change hasn't fixed that problem so it might be unrelated, but all the same the stack exploding is probably a problem that should be considered.
I can see these entries on my system, too. But even so, they don't seem to cause any problems.
If you think the problem on your device is related to those logs, please file a browser bug here:
https://bugs.chromium.org/p/chromium/issues/list
Closing this issue since it is clearly unrelated to the engine.
it kinda IS related to the engine, those only show up BECAUSE you call the render call back recursively inside the render callback. it does NOT happen if you call it as i included in the OP.
and i can't think of too many ways whereby having thousands upon thousands of copies of the stack at various stages wouldn't cause problems.
the problem here isn't with chrome, that correct behaviour when someone is calling a function recursively, even if doing it asynchronously, and this is exactly the kind of thing setinterval is made for.
Sorry, but this is the textbook usage of requestAnimationFrame, and setInterval cannot be used instead — you'd need to know the preferred framerate of the device, which depends on all sorts of things that the application cannot know.
Refer to the link @Mugen87 provides above, or to the MDN docs, or to this SO answer, or a Chrome dev's blog.
If the browser's developer tools are failing with correct usage of requestAnimationFrame, that suggests either (a) browser bug, or (b) a Chrome extension creating a memory leak. Testing in an incognito window would prove or disprove the latter, I think.
setinterval isn't being used instead, it's being used in conjunction. requestanimationframe is still setting the framerate setinterval sets the maximum framerate.
the call stack is operating as intending when you have debug async turned on (which it is by default, i just found the option to disable it, though i'd prefer not to, aync debugging is really good, i'd rather not have a huge number of frames pushed onto the stack to begin with.)
for some perspective:
roughly 60 frames are pushed onto the call stack every second, in one minute there are 3,600, in one hour that's 216,000...216,000 copies of the current memory stack of that program....somewhere (i don't know if it's in ram or in a temp file) i often have my app open for hours on end
In your example usage...
setInterval(function(){requestAnimationFrame( animate )},1000/60);
... there are at least three problems:
(1) The timer will continue to pile up animate requests, at roughly 60fps, even when the device falls behind.
(2) The timer will never fire faster than 60fps, even on devices that support or require higher framerates.
(3) requestAnimationFrame fires at a very specific time in the compositing process, and by driving it with setInterval (which does not), the application is liable to miss some frames even with an efficiently-written render loop.
It's possible to create a more elaborate solution that fixes at least (1), but it really comes down to this — requestAnimationFrame is a browser API designed to be used exactly as we are using it.
I don't know why your browser's dev tools are breaking, sorry: none of us have experienced that in many, many hours of debugging WebGL applications. Please use the available channels to report a problem to the browser.
i haven't used them long enough and debugged them enough to see if it would eventually cause a crash
Try leaving the example open for a whole weekend. If it produces a crash report the issue here.
^using an incognito tab with no extensions, ideally. 🙂
i'm not sure the first one is an issue, javascript isn't known for it's threading i'm pretty sure the interval blocks until the calling code resolves. 2 is easy to adjust for by lowering the interval, i can't speak to 3 though, you might have a good point there.
i'll try your suggestion and leave it running over the weekend, hopefully locking the account and minimizing the vm won't interfere with anything. we'll see how it acts on monday
/me adds a bitcoin miner to the example 😁
@donmccurdy
The timer will continue to pile up animate requests
does not have to be so, just do
var id;
setInterval(function(){
    cancelAnimationFrame( id );
    id = requestAnimationFrame( animate );
},
// now this could be anything at all:
1
);
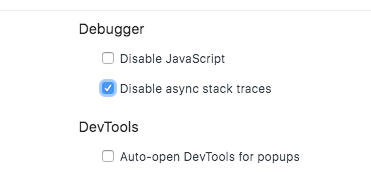
@tuseroni If you check this checkbox in chrome console settings:

your call stack is going to look like this:

Using THREE v 112, this disable async stack traces setting does the trick in Chrome v81. Brilliant! jb
Most helpful comment
@tuseroni If you check this checkbox in chrome console settings:


your call stack is going to look like this: