Three.js: Poor performance on Pixel XL & Daydream
Description of the problem
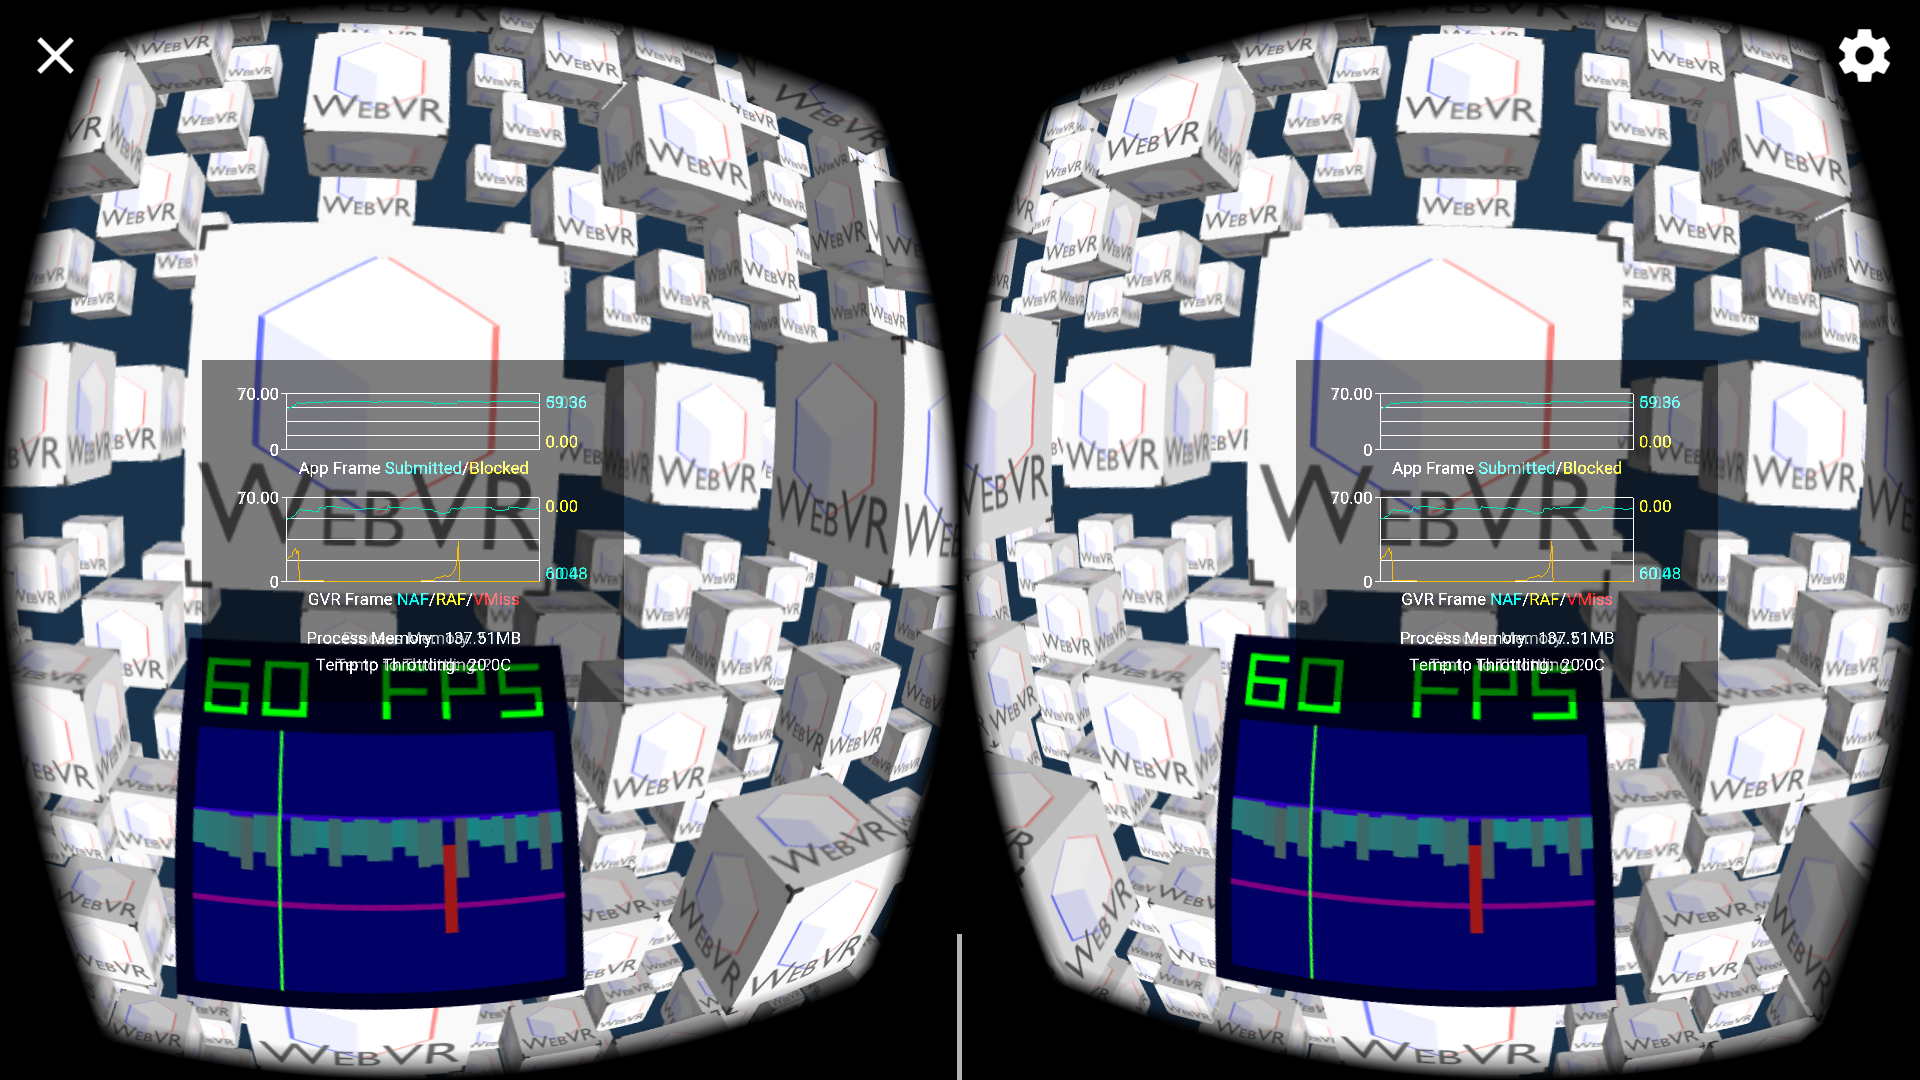
Trying any simple webvr example (eg: https://developers.google.com/vr/tools/perfhud) on a Pixel XL with performance HUD active (https://developers.google.com/vr/tools/perfhud) shows lots of reprojection (RAF) that should be 0:

Three.js version
- [x] Dev
Browser
- [ ] All of them
- [x] Chrome
- [ ] Firefox
- [ ] Internet Explorer
OS
- [ ] All of them
- [ ] Windows
- [ ] macOS
- [ ] Linux
- [x] Android
- [ ] iOS
Hardware Requirements (graphics card, VR Device, ...)
Daydream
 fernandojsg
All 17 comments
For comparison, here's @toji's https://webvr.info/samples/03-vr-presentation.html
 mrdoob
on 19 Sep 2017
mrdoob
on 19 Sep 2017
From the Google VR docs:
Reused App Frames (RAF): The number of times per second that the display reprojection pipeline did not have a new frame from the application, and had to reproject a previously provided frame. A non-zero value here represents increased input to photon latency, and a constantly changing re-used app frame value can lead to animation and motion discontinuities.
Does this basically mean three.js submits new frames not fast enough? Because no frames are blocked, it does not look like the application is GPU bound. So is this a problem on the CPU side?
 Mugen87
on 19 Sep 2017
Mugen87
on 19 Sep 2017
Does this basically mean three.js submits new frames not fast enough? Because no frames are blocked, it does not look like the application is GPU bound. So is this a problem on the CPU side?
Yes, that means that some frames are taking longer than 16ms. it seems a problem on the CPU/JS side. Does the three.js demo batch all the cubes? @toji's demo batches all the vertices into the same buffer so all of them are rendered at once.
But even if cubes are rendered separately a powerful device like Pixel should be fast enough to render all of them at stable 60fps.
 MortimerGoro
on 19 Sep 2017
MortimerGoro
on 19 Sep 2017
Does the three.js demo batch all the cubes?
Nope.
But even if cubes are rendered separately a powerful device like Pixel should be fast enough to render all of them at stable 60fps.
That's what I think too.
mrdoob
on 19 Sep 2017
But even if cubes are rendered separately a powerful device like Pixel should be fast enough to render all of them at stable 60fps.
That's what I think too.
Yep, having just few cubes with basic material it shouldn't be a problem for such a powerful device.
fernandojsg
on 19 Sep 2017
Was the Pixel running on Android 7 Nougat or 8 Oreo?
 dustinkerstein
on 11 Oct 2017
dustinkerstein
on 11 Oct 2017
I had the same result with Oreo.
Mugen87
on 11 Oct 2017
@Mugen87 K. I'm curious if it happens on Nougat as well.
dustinkerstein
on 11 Oct 2017
@dustinkerstein I've tried also on oreo, I don't have a device with nougat around :\
fernandojsg
on 11 Oct 2017
I have the same problem on my Pixel XL, tested on Nougat and Oreo. Performance is really not up to what it should be giving me some nausea cause of the lag.
 kmare
on 11 Oct 2017
kmare
on 11 Oct 2017
@kmare yah I feel the same way. I've been testing a Moto Z vs. Pixel XL and the former is significantly better performing for Daydream. I know the cpu in the Pixel is underclocked, but I really would have expected better performance.
dustinkerstein
on 11 Oct 2017
FYI - I just gave https://webvr.info/samples/03-vr-presentation.html a quick try on my Moto Z (Android 7.1.1) and it's rock solid at 60fps with 0 RAF. My Pixel XL (Android 8.0) hovers between 3-10 RAF and around 52-55 submitted FPS, and sometimes dips much worse.
dustinkerstein
on 12 Oct 2017
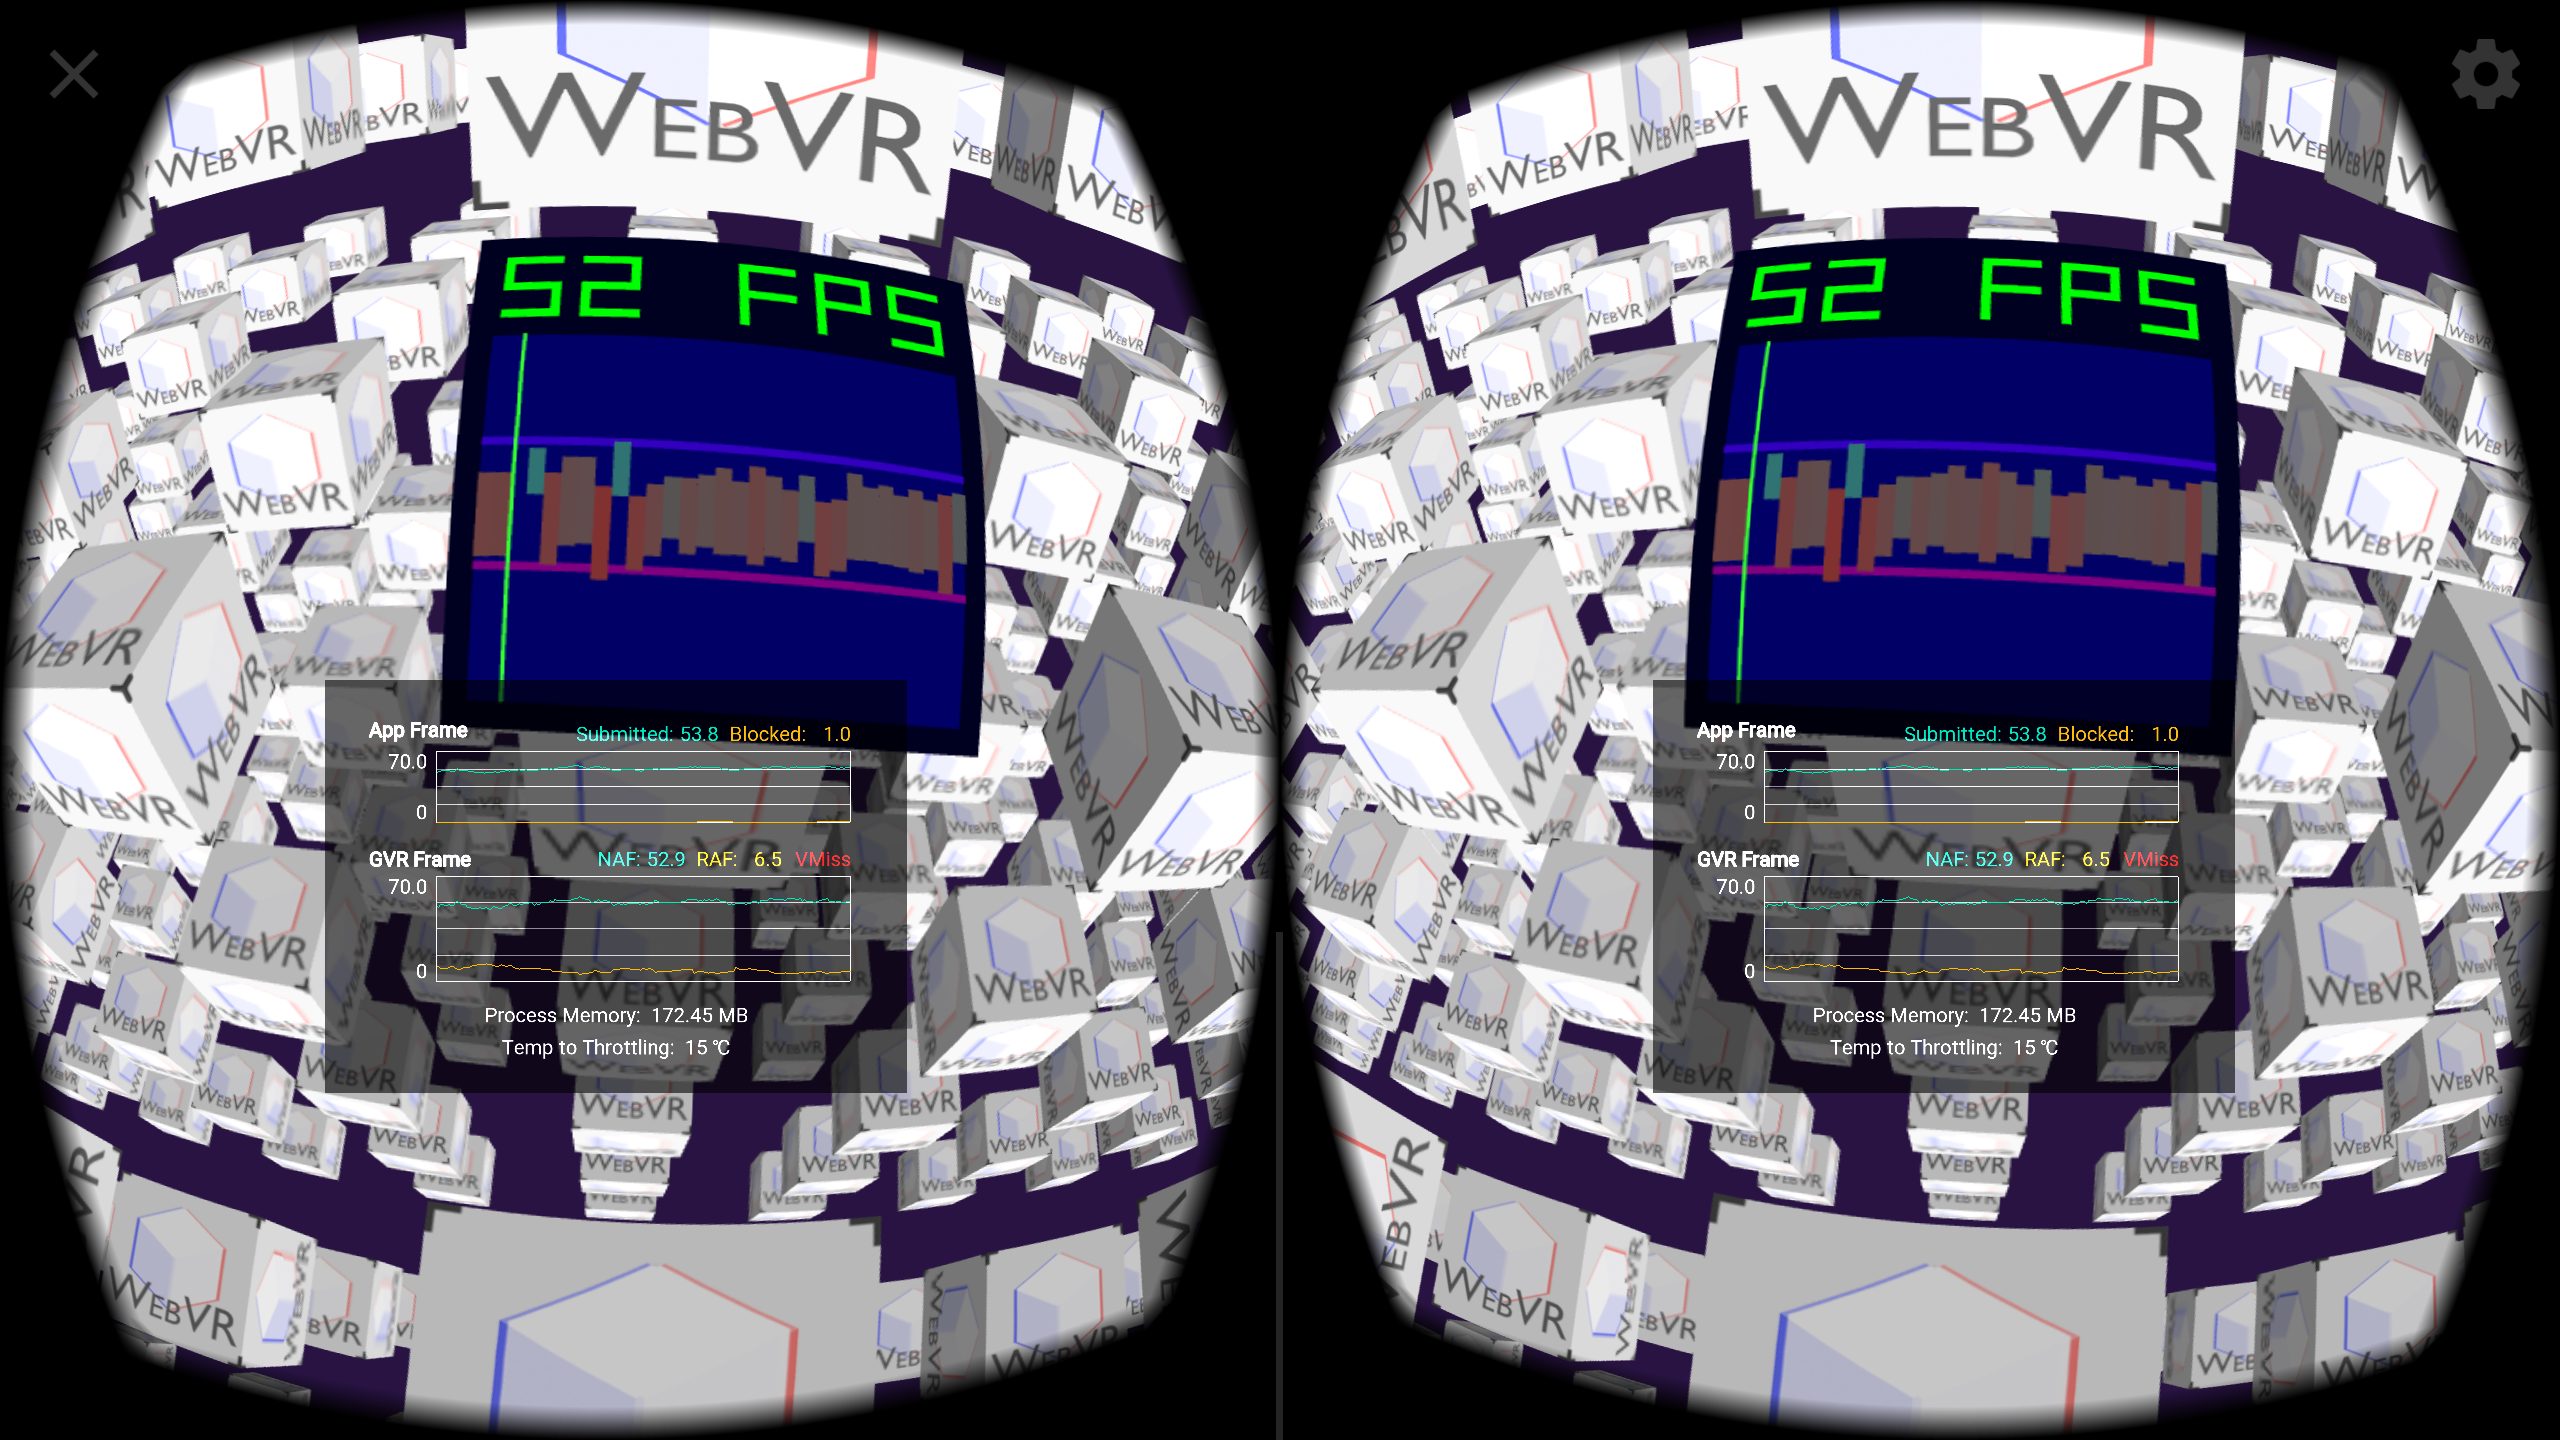
@mrdoob Were you testing on a Pixel in the screenshot you posted? Here is what my Pixel looks like:
dustinkerstein
on 12 Oct 2017
First of all, the Android WebVR implementation unfortunately still has known performance issues, mostly this is due to the presentation pipeline copying pixels which adds fill rate overhead. I'm working on improving that, but this has been taking longer than anticipated.
But even with that known overhead, simple WebVR applications should still be able to reach 60fps.
A few things to look out for:
The performance overlay costs some performance itself, translucent overlays aren't cheap to render. This may be enough to cause some dropped frames by itself if the app has tight performance margins.
By default, WebVR uses VSync-aligned timing, so if you miss a submission deadline it'll skip a frame. This generally makes animations smoother, but reduces the framerate and correspondingly increases the reused frame count. As an extreme example, if you consistently need slightly more than 1/60s to render, you'll drop to 30fps. For performance testing, you can force as-fast-as-possible rendering by setting chrome://flags#webvr-vsync-align to disabled.
Performance is highly dependent on rendered resolution, and also somewhat influenced by the field of view. For example, a Pixel XL needs to render more than the non-XL Pixel due to its higher resolution and larger FOV. Applications can override the recommended render resolution to influence this. For example, the https://webvr.info/samples/test-slow-render.html?heavyGpu=1&cubeScale=0.3&workTime=12&standardSize=true&renderScale=1.0 test page sets standardSize=true to choose a base 1024x1024 per eye resolution, independent of device or viewer characteristics, and then applies the renderScale multiplier on top of that. So renderScale=2.0 would draw 2048x2048 pixels per eye for 4x the render cost. (These aren't standard parameters, this is just an example for comparison purposes.)
You can use chrome://inspect/?tracing#devices to collect a realtime trace which includes wait times, this can help identify where the bottlenecks are. Here's a trace of the three.js cubes demo on a Pixel XL using current Chrome Canary:

Note the "WebVR FPS" metric showing 59fps, and the GVR frame acquire/submit times are low which generally indicates it's not bottlenecked on rendering, and the "WebVR frame time" for "rendering" is around 13ms, so this should be within the 16ms per-frame render budget.
If you run into performance issues, such a trace can be helpful in identifying what's going on.
 klausw
on 29 Jan 2018
klausw
on 29 Jan 2018
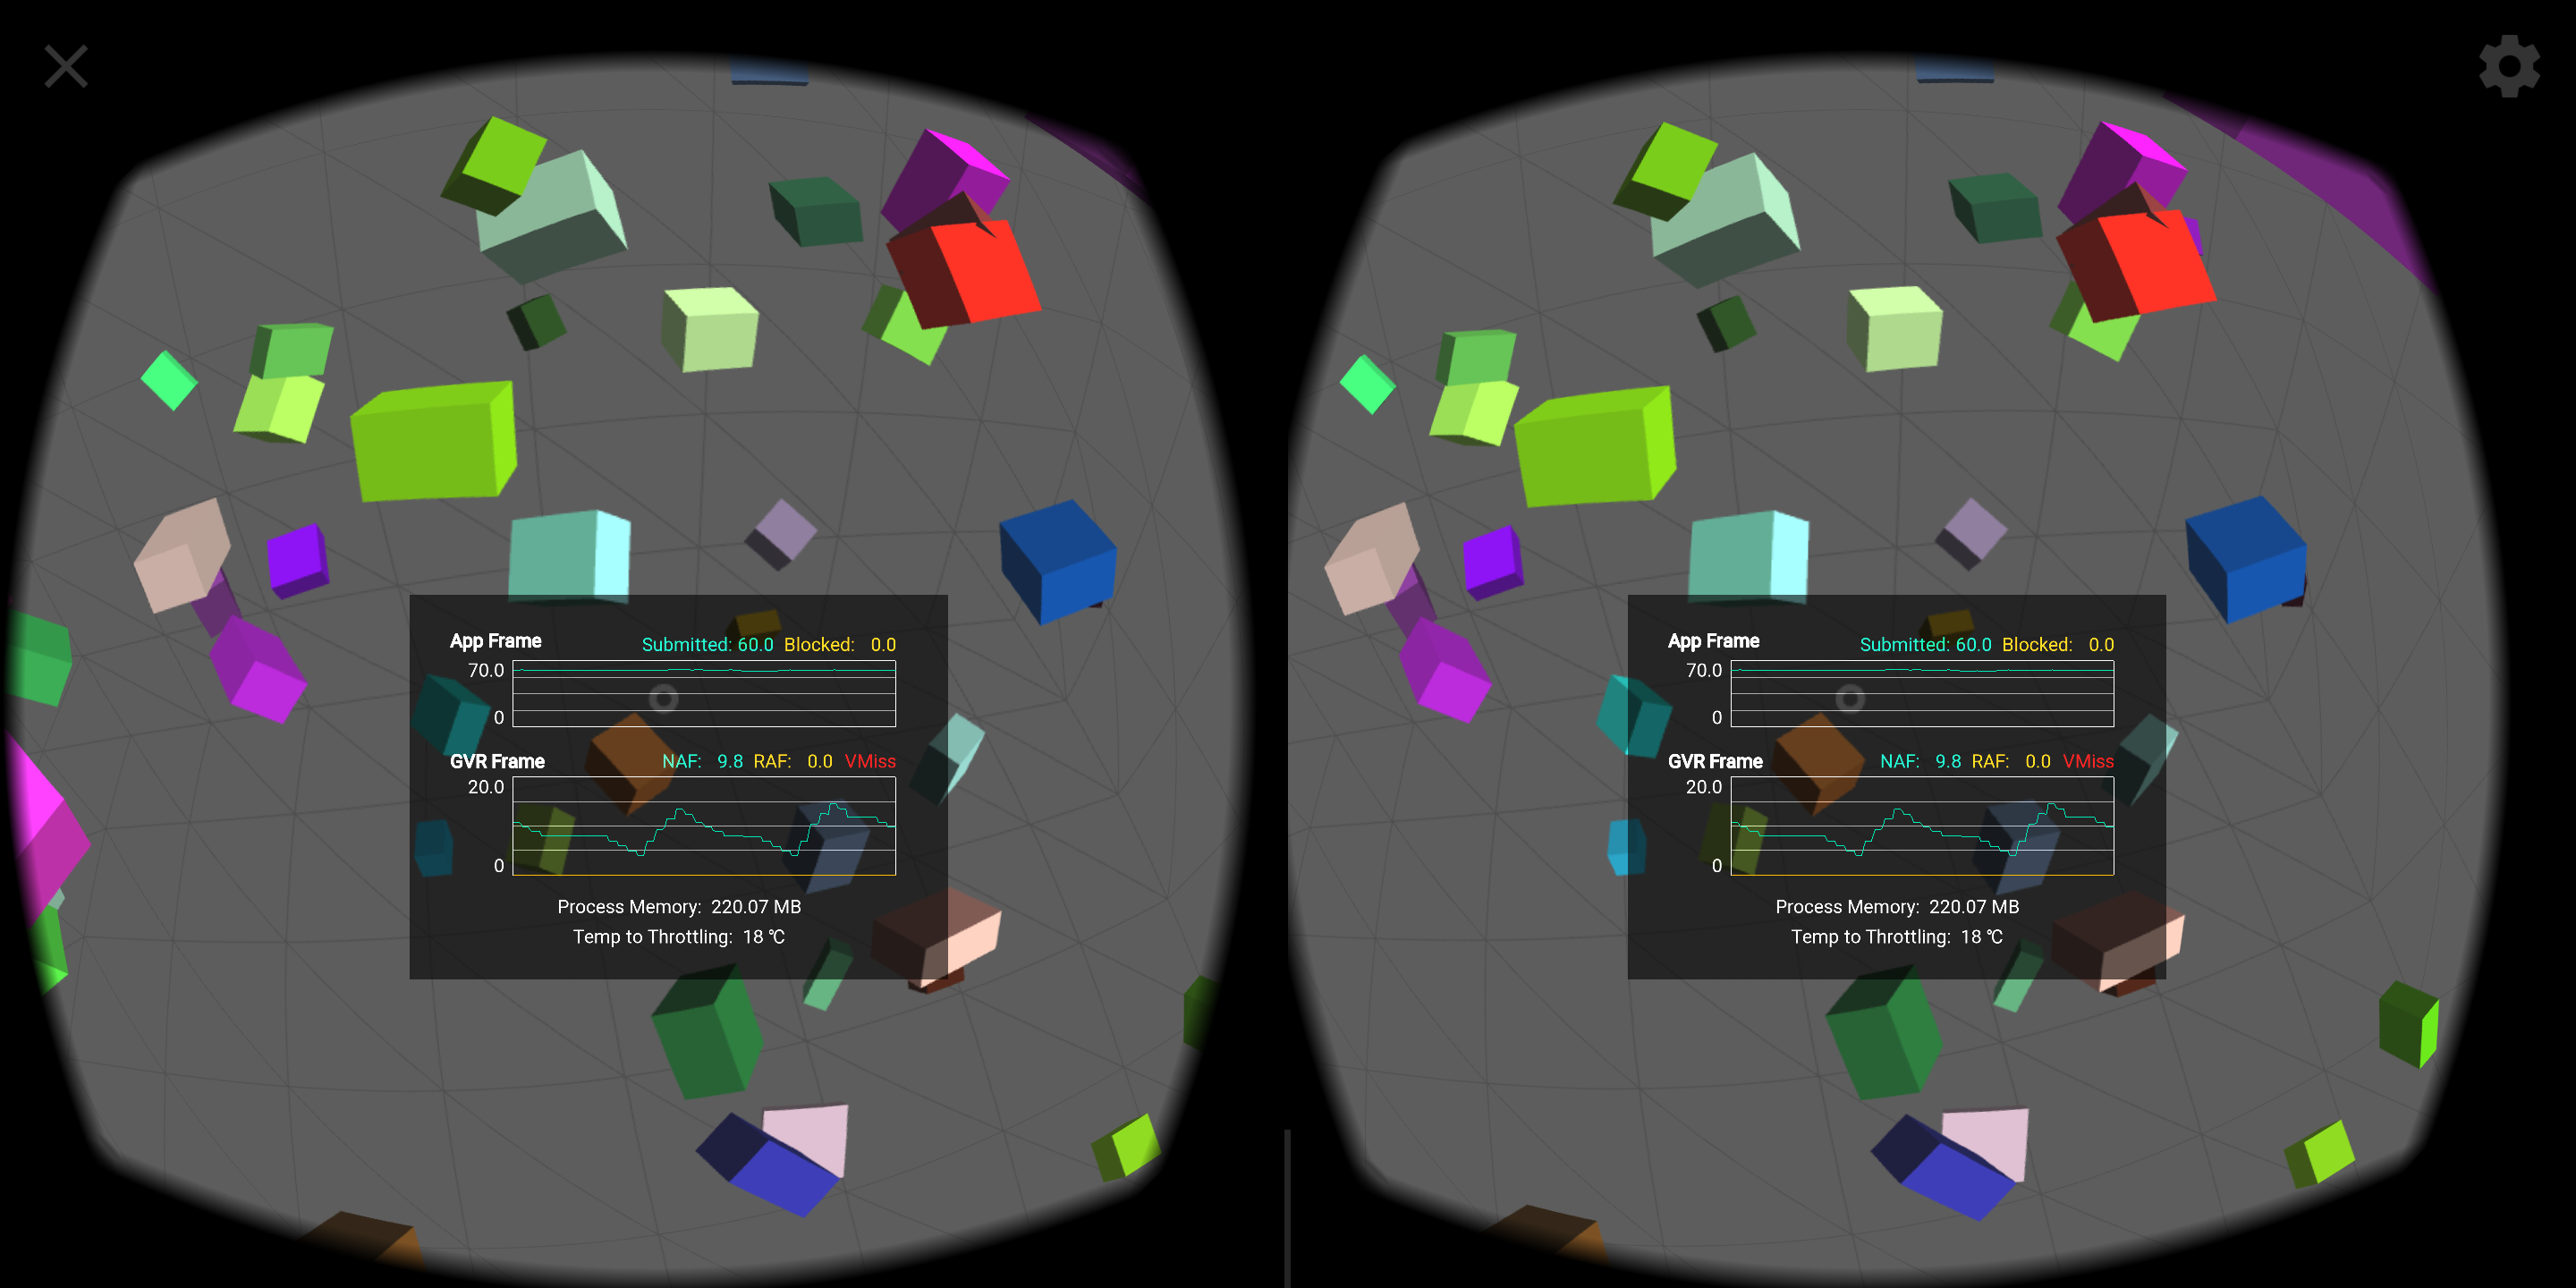
Today's Chrome Canary 66.0.3342.0 uses a new render path by default for Android which should improve performance a bit (5-10%) and reduce dropped frames. Here's what it looks like on a Pixel 2 XL:
If you've been seeing perfomance issues, can you give that a try? You can revert back to the previous path for comparison by setting chrome://flags#webxr-render-path to ClientWait. (Please change it back to Default after testing, the default path is going to change again in the future.)
Edit: please ignore the NAF (new application frame) counter in this image, that doesn't seem to be working right for me. The "Blocked" count is expected to be close to zero, WebVR detects when a frame submission would block and defers submitting in that case. So you may still be GPU bound even though that counter is showing as zero.
klausw
on 7 Feb 2018
I just gave this a quick try on my Pixel XL and I wasn't able to detect any clear change between current Chrome 64 and Canary 66.0.3342.0 - However, even Chrome 64 seems to be a little better than the earlier test I ran a few months ago. Maybe an updated VR services also had some impact.
dustinkerstein
on 8 Feb 2018
Let's revisit XR performance of three.js when WebXR is enabled by default (starting from Chrome 79). Closing for now.
Mugen87
on 23 Nov 2019
Related issues
 ghost
·
3Comments
ghost
·
3Comments
 danieljack
·
3Comments
danieljack
·
3Comments
 Bandit
·
3Comments
Bandit
·
3Comments
 makc
·
3Comments
makc
·
3Comments
 clawconduce
·
3Comments
clawconduce
·
3Comments
Most helpful comment
First of all, the Android WebVR implementation unfortunately still has known performance issues, mostly this is due to the presentation pipeline copying pixels which adds fill rate overhead. I'm working on improving that, but this has been taking longer than anticipated.
But even with that known overhead, simple WebVR applications should still be able to reach 60fps.
A few things to look out for:
The performance overlay costs some performance itself, translucent overlays aren't cheap to render. This may be enough to cause some dropped frames by itself if the app has tight performance margins.
By default, WebVR uses VSync-aligned timing, so if you miss a submission deadline it'll skip a frame. This generally makes animations smoother, but reduces the framerate and correspondingly increases the reused frame count. As an extreme example, if you consistently need slightly more than 1/60s to render, you'll drop to 30fps. For performance testing, you can force as-fast-as-possible rendering by setting chrome://flags#webvr-vsync-align to disabled.
Performance is highly dependent on rendered resolution, and also somewhat influenced by the field of view. For example, a Pixel XL needs to render more than the non-XL Pixel due to its higher resolution and larger FOV. Applications can override the recommended render resolution to influence this. For example, the https://webvr.info/samples/test-slow-render.html?heavyGpu=1&cubeScale=0.3&workTime=12&standardSize=true&renderScale=1.0 test page sets standardSize=true to choose a base 1024x1024 per eye resolution, independent of device or viewer characteristics, and then applies the renderScale multiplier on top of that. So renderScale=2.0 would draw 2048x2048 pixels per eye for 4x the render cost. (These aren't standard parameters, this is just an example for comparison purposes.)
You can use chrome://inspect/?tracing#devices to collect a realtime trace which includes wait times, this can help identify where the bottlenecks are. Here's a trace of the three.js cubes demo on a Pixel XL using current Chrome Canary:
Note the "WebVR FPS" metric showing 59fps, and the GVR frame acquire/submit times are low which generally indicates it's not bottlenecked on rendering, and the "WebVR frame time" for "rendering" is around 13ms, so this should be within the 16ms per-frame render budget.
If you run into performance issues, such a trace can be helpful in identifying what's going on.