The-seo-framework: The SEO Framework hangs in Safari with ACF Pro
Follow up: https://github.com/sybrew/the-seo-framework/issues/18#issuecomment-404038769
Using Safari (Chrome is fine) with ACF Pro 5.6.10 and TSF 3.0.6. When I have a Page with ACF's Flexible Content areas and with TSF enabled, Safari gives me a spinning wheel and hangs for about 10-15 seconds before finalising the page
Edit: added detailed information from the original report
 LucidNinja
All 19 comments
Additional info:
- Page: ~WooCommerce product~ any page @
../post.php - ACF field property: "Flexible Content"
 sybrew
on 11 Jul 2018
sybrew
on 11 Jul 2018
Ah, sorry, to clarify @sybrew - my difference - no WooCommerce involved.
LucidNinja
on 11 Jul 2018
And post type is standard Page.
LucidNinja
on 11 Jul 2018
If any developer knows how to use the Timeline interface in Safari, and is also experiencing this issue, please help us by providing detailed information. I'm most curious about the offending function call.
@LucidNinja
Unfortunately, I was unable to reproduce this issue. There might be stale cache conflicting in your browser. I suggest clearing the browser cache.
Only removing the data should be sufficient, the cookies may stay:
https://support.apple.com/guide/safari/manage-cookies-and-website-data-sfri11471/11.0/mac/10.13
When that doesn't work, then try clearing your browser history, too:
https://support.apple.com/guide/safari/clear-your-browsing-history-sfri47acf5d6/mac
sybrew
on 30 Jul 2018
I am closing this as the JS API will be overhauled with the v3.3.0 release. If this is still an issue, let me know!
sybrew
on 1 Jul 2019
I might be experiencing this. With TSF 4.1 and ACF Pro 5.9, in my last timeline, Safari takes 222 seconds to complete a single call. We all use Firefox or Chrome on the admin side and only test frontend with Safari so we missed this completely.
document.body.dispatchEvent(new CustomEvent("tsf-ready"))
I can try to test the flexible content field in a simple configuration sometime this week.
Timeline recording was 543MB if it is of any use.
 HoyryH
on 17 Aug 2020
HoyryH
on 17 Aug 2020
Hi @HoyryH
I'm happy to see you're a JS savant! Could you profile this for me? You might find a call that loops indefinitely. See https://support.apple.com/guide/safari-developer/improve-slow-function-executions-dev4fed6a0dc/11.0/mac/10.13.
Could you send a screenshot with the "total time" descending, with the largest offenders expanded?
If you could also share the version number of TSF, that'd be very helpful; we can then quickly find out what the minified names h() and j:x (or whatever else) mean. 😄
In all these years, we've had numerous reports (it's related to flexible fields in ACF Pro), but we have yet been unable to find the cause since we could never replicate it. Thank you so much!! 🙏
sybrew
on 17 Aug 2020
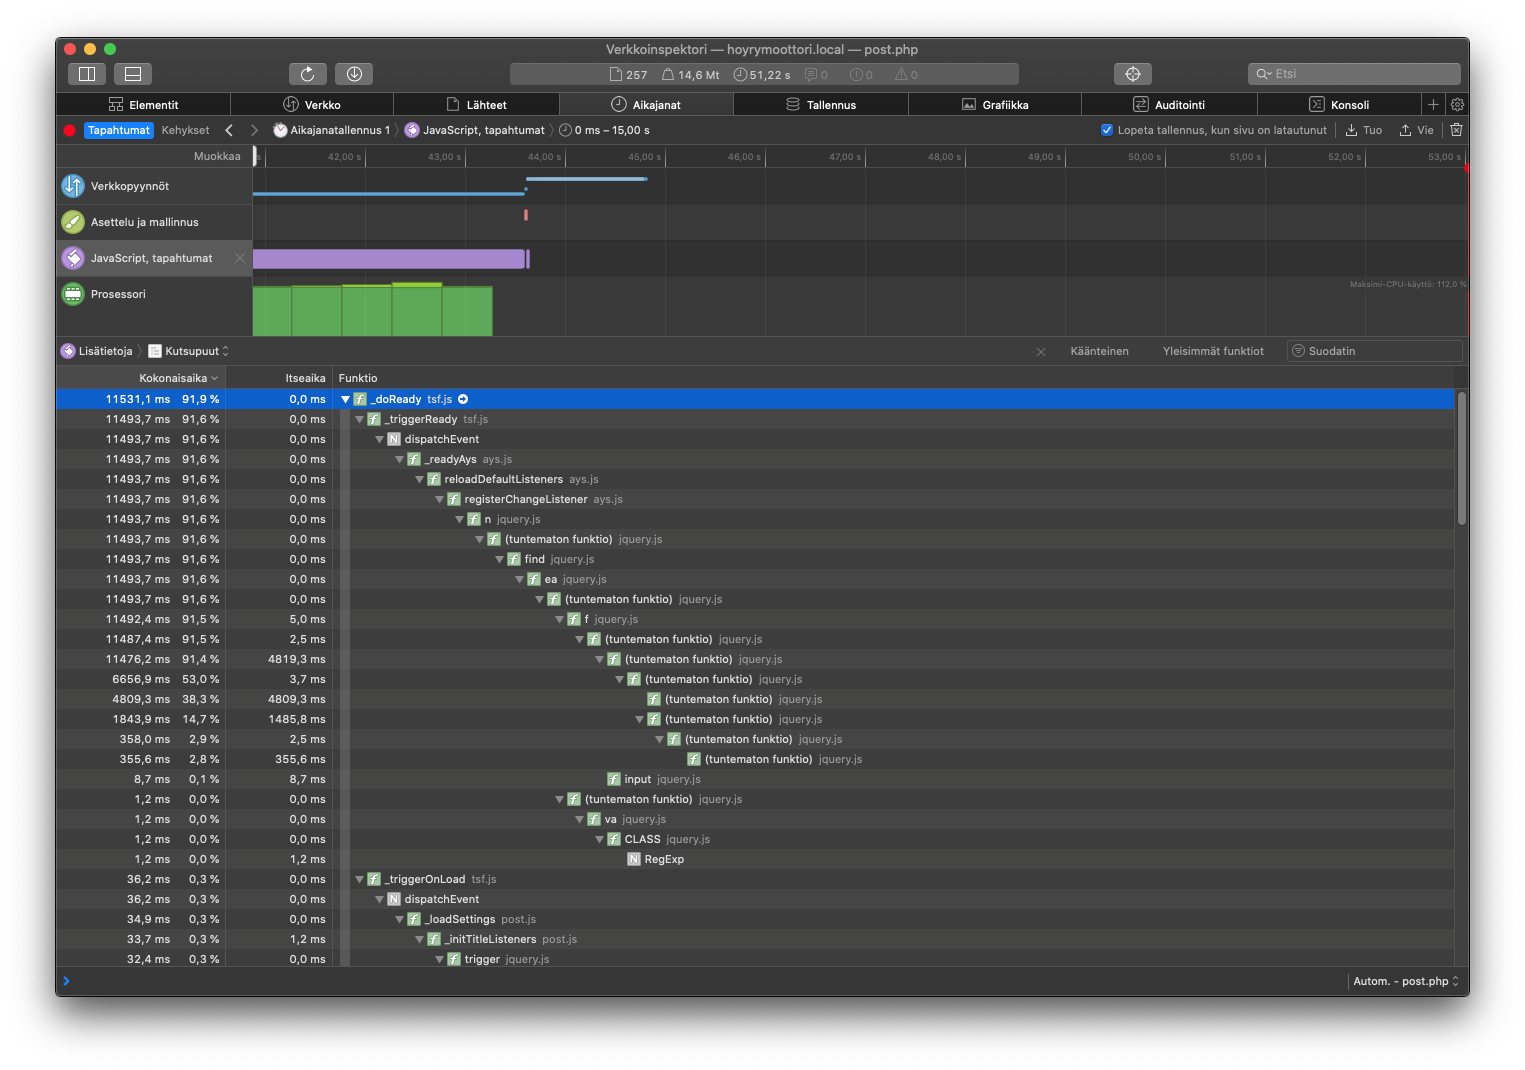
With script_debug, got this. WP 5.5, ACF Pro 5.9.0 and TSF 4.1.0.
HoyryH
on 18 Aug 2020
Okay, I managed to get a simple flexible content field in a test custom post type and it seems that by having multiple instances of a field has something to do with it.
We have modules which all share a cloned settings tab. If I remove all the fields from that settings tab, page loads quicker.
40 seconds instead of 300+ seconds.
When I created a simple FC layout and kept adding one layout that only had a text field, each instance kept increasing that _doReady call tree little by little.
HoyryH
on 18 Aug 2020
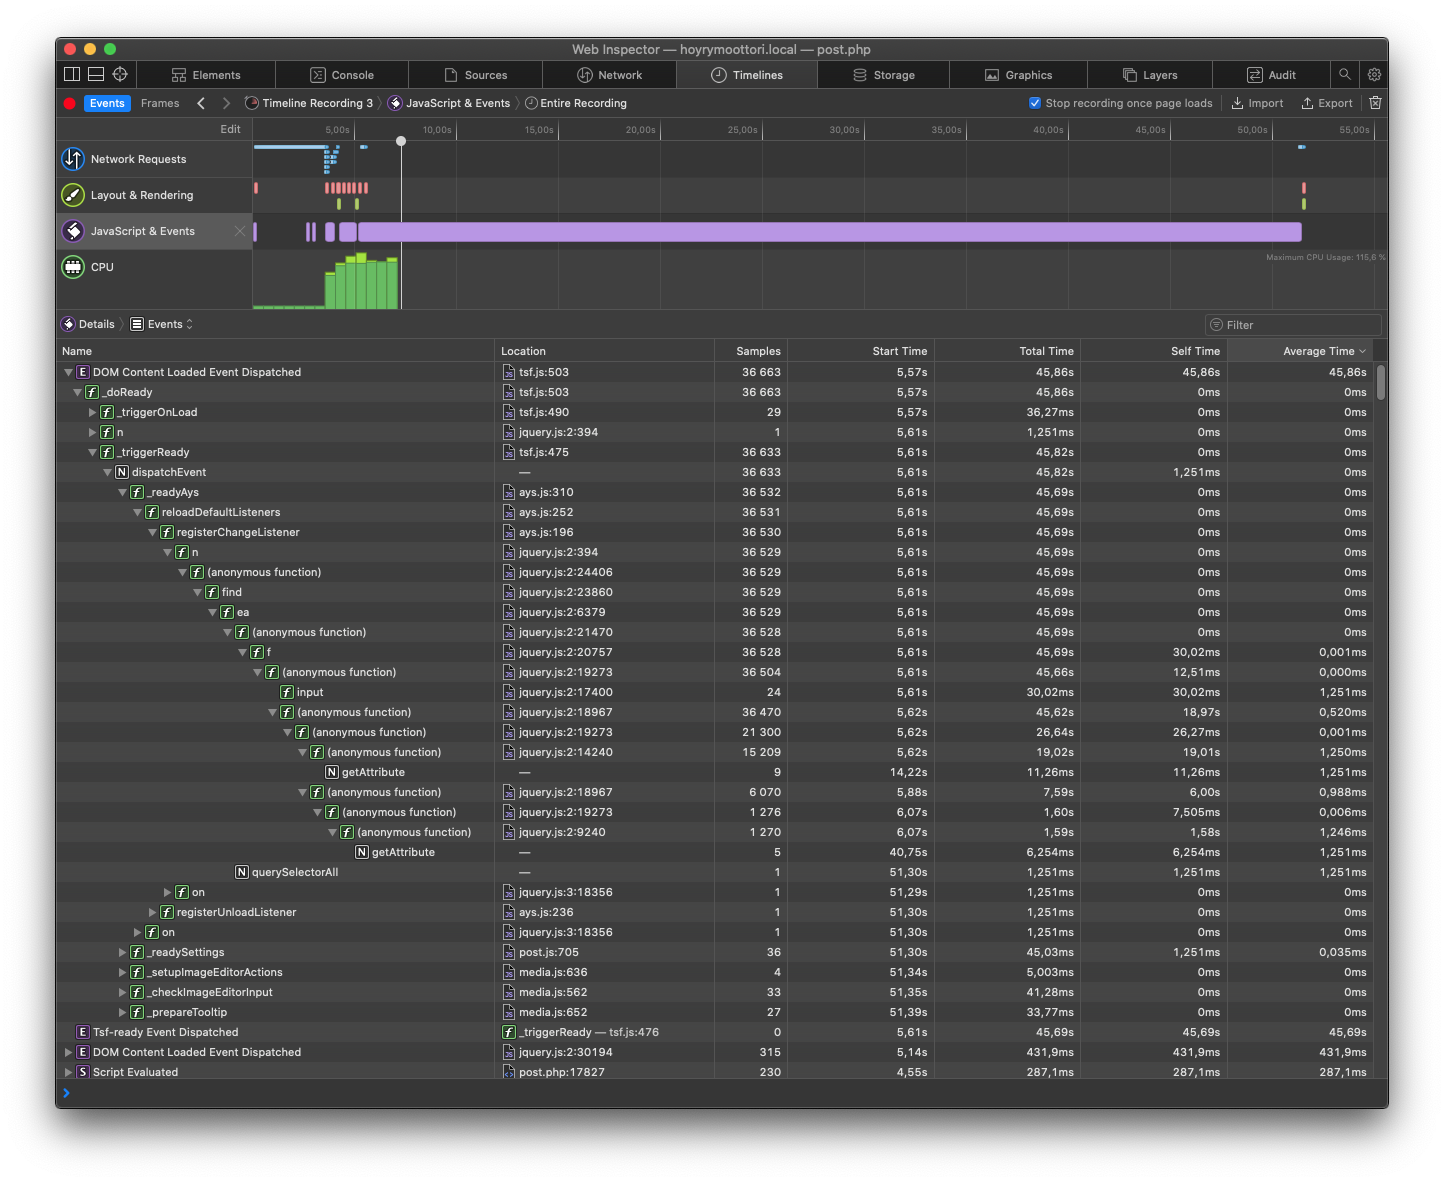
Just a few samples
HoyryH
on 21 Aug 2020
Thank you so much @HoyryH for providing these invaluable details!
I believe jQuery performs some expensive regex as we want it to filter the selectors. I suspect ACF adds something via flexible content that causes jQuery to pollute its cache. Subsequently, it'll have to parse thousands of elements (evident from the "Samples"). jQuery has proven to be inefficient for many things.
But, that's mere suspicion.
Nevertheless, I'm going to rewrite the AYS event handler so that it can only parse elements registered by TSF (i.e., we're going to move away from jQuery), and I'll attach a commit to this issue. @HoyryH are you free to test the updated script once it's ready?
sybrew
on 21 Aug 2020
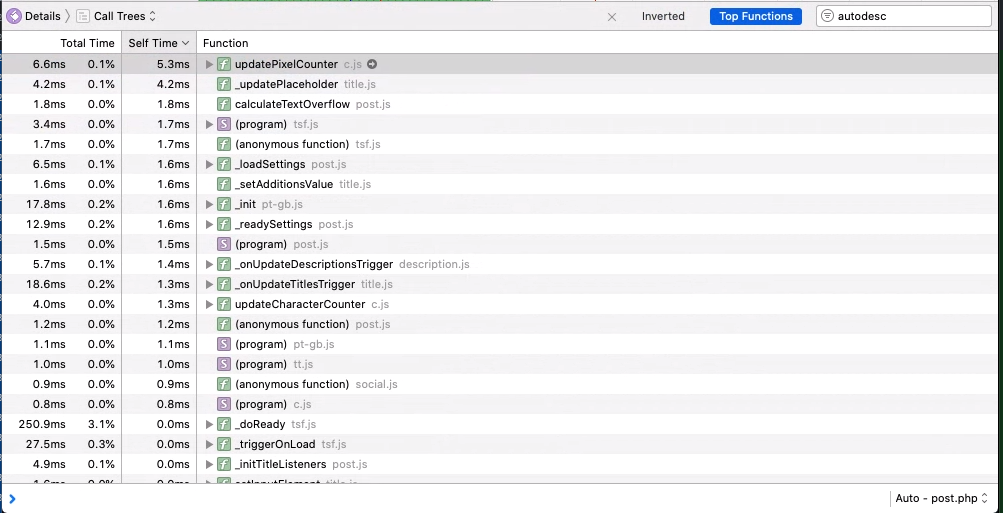
I managed to get it down to 2.2ms from 36.3ms! That's a near 94% performance improvement thanks to removing jQuery--this is based on a single test, however.

We'll be seeing many more improvements like these in the future. 😄 The commit will follow soon.
Update: Tested on Safari 13.1 with the finished commit; no longer should we face 30,000+ queries. Instead, just a few.
Please note that I moved the event handler to a different location because I had to make some changes at lower levels as I faced race conditions and other bugs revolving around chronology while making these changes.

TSF's scripts should henceforth take no longer than 50ms to fully load on most configurations. I dare say even 20ms.
When you filter for "autodescription" on the right side using "call trees" on the left side, you should find everything TSF does.
sybrew
on 21 Aug 2020
@HoyryH Thank you so much for your much-required expertise!
I believe I've resolved the issue with the attached commit. If you want to affirm that it fixed this for you, please test its generated plugin ZIP archive on your local environment:
https://github.com/sybrew/the-seo-framework/archive/15946a4a740318dbb3b2658647a745193641c338.zip
You can upload its contents to /wp-content/plugins/autodescription/. The file structure must match what you see there. There are no backward or forward compatible breaking changes in the update thus far. The public release of TSF v4.1.1 will honor intermediate development installations.
I also believe that, since WP 5.5, you can simply use the plugin uploader screen, and drop the ZIP file there.
sybrew
on 22 Aug 2020
With TSF 4.1.1-dev-7, the page that used to take 300+ seconds on Safari, now loads just as fast as Firefox or Chrome.
HoyryH
on 24 Aug 2020
I believe that's a good sign? 😃
Do you think it should (or could) be any faster?
sybrew
on 24 Aug 2020
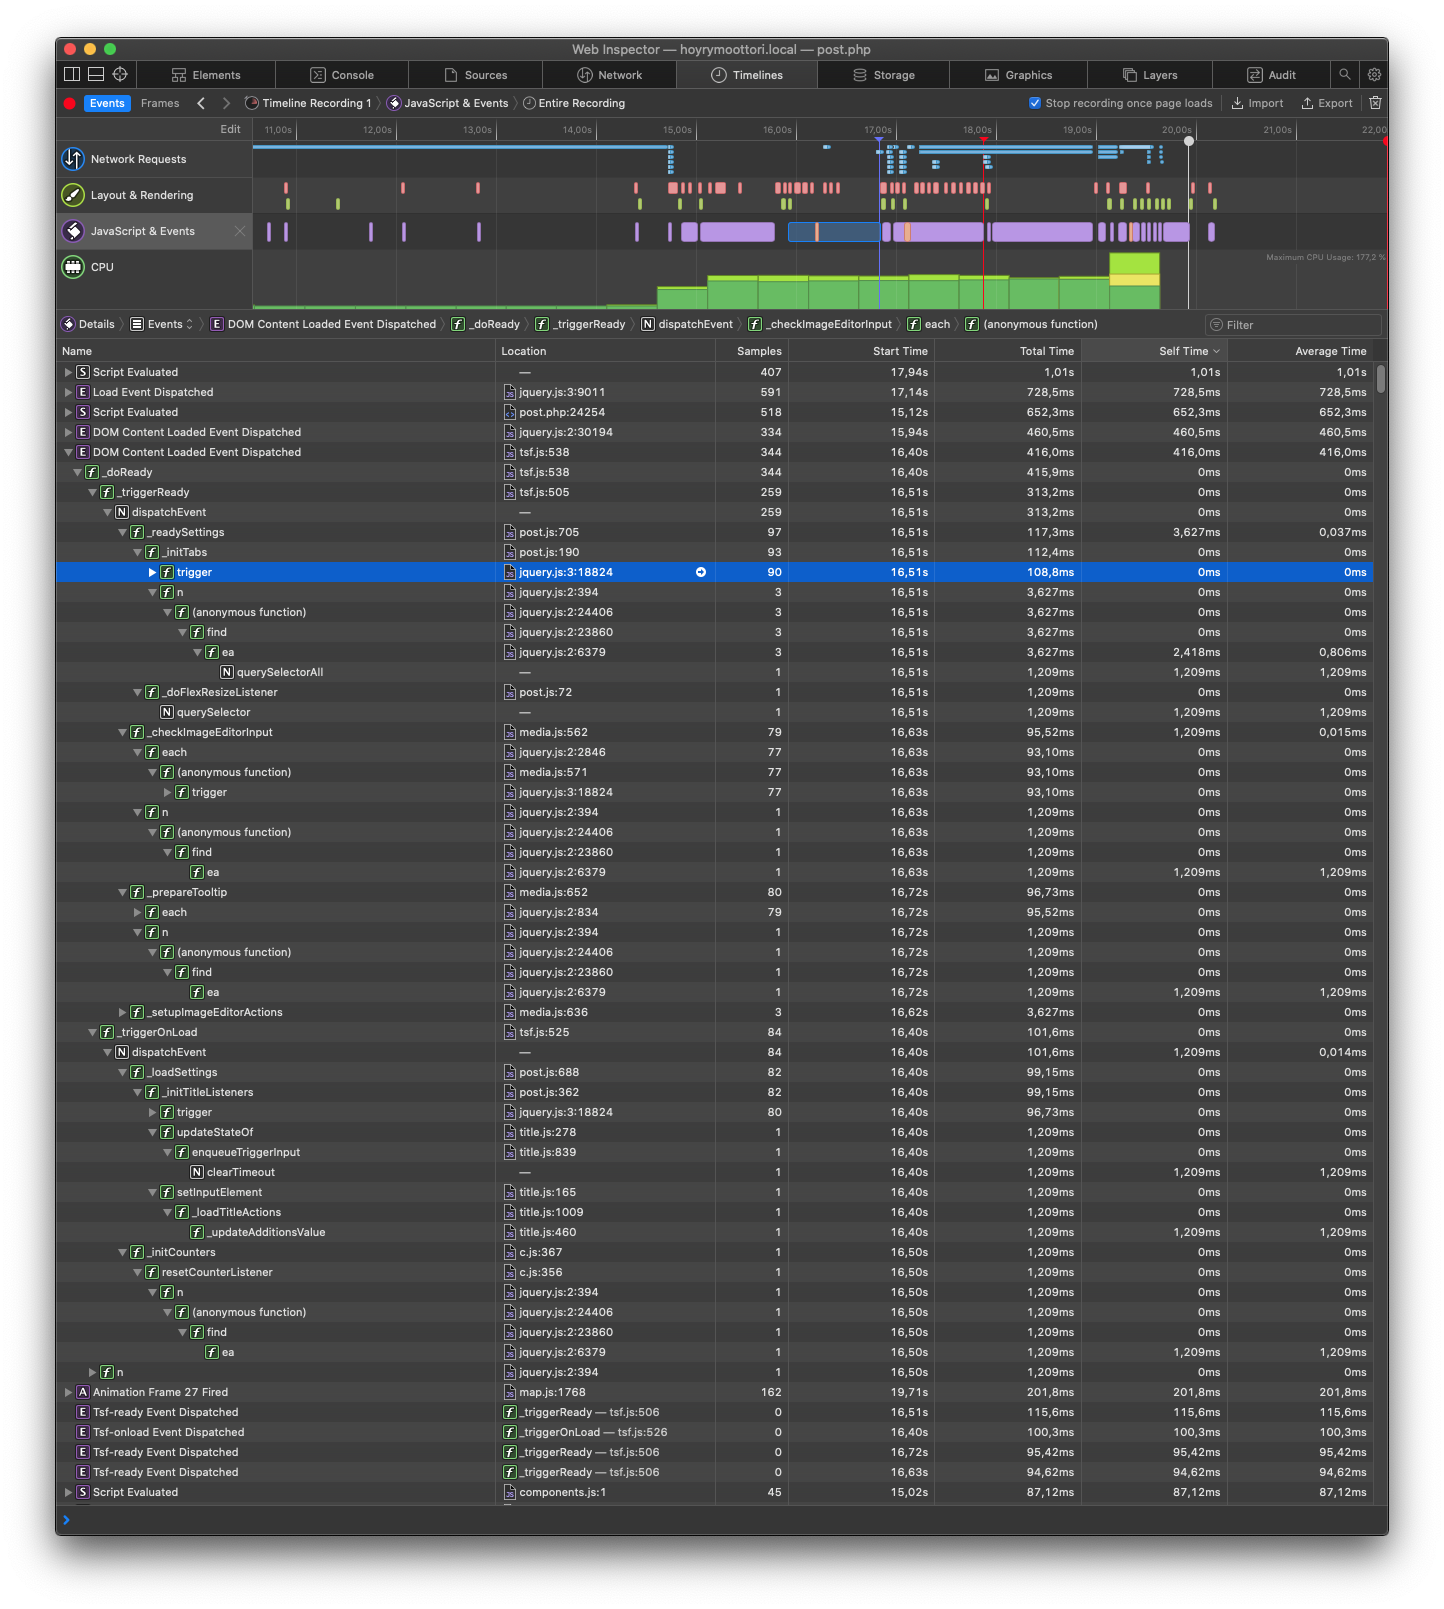
Seems like jQuery stumbles a bit, maybe thanks to ACF, in a couple places?
HoyryH
on 25 Aug 2020
So, we must abandon jQuery even further. Sounds good to me 😄
sybrew
on 25 Aug 2020
In the upcoming commit, I managed to push TSF all the way down the list of "slow scripts"--it's about 5~10x faster than the previous iteration, making it about 99.9% faster now compared to TSF v4.1.0? 😄
I removed jQuery from wherever I could without breaking the API. All other pages should be notably swifter to interact with, too: SEO Settings page, list edit, term edit, etc. I also found and fixed a few bugs while I was at it.
Here's a screenshot from a rented Mac, where you can see just one TSF script annotated at the bottom with a red dot.
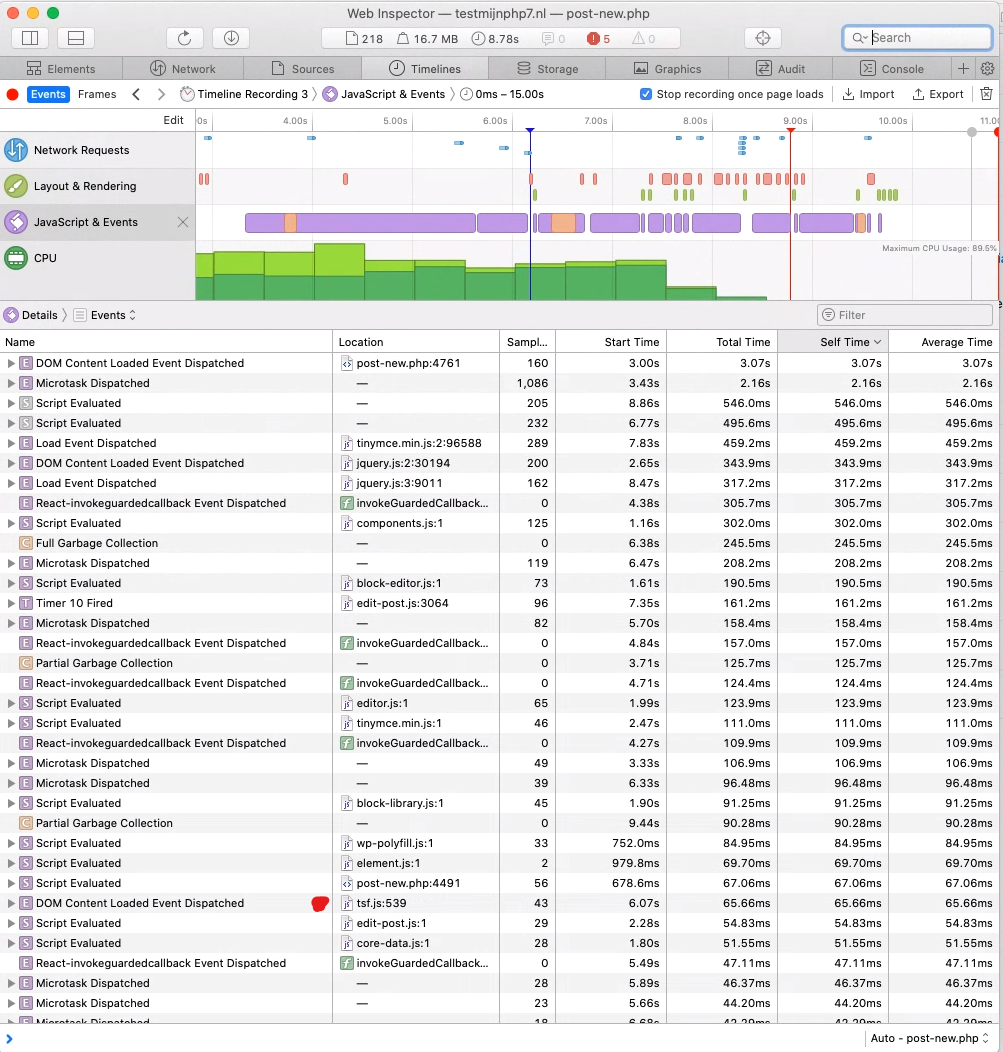
Now, I could go out of my way as I do with PHP, by optimizing all the loops (use for...of instead of forEach with closures, etc.), but relatively to the rest of WordPress, I think we're already at the <0.5% margin now. I think that's enough... for now.
@HoyryH would you like to test dev-10, and see if everything's according to spec? 😃
sybrew
on 27 Aug 2020
dev-10 seems to work as normal, the part that previously was 416ms, is now just 25ms.
Quite happy how this all turned out.
HoyryH
on 28 Aug 2020
Related issues
 samburgers
·
6Comments
samburgers
·
6Comments
 Hube2
·
3Comments
Hube2
·
3Comments
 themightyant
·
4Comments
themightyant
·
4Comments
 Ciantic
·
5Comments
Ciantic
·
5Comments
 LeBaux
·
6Comments
LeBaux
·
6Comments
Most helpful comment
dev-10 seems to work as normal, the part that previously was 416ms, is now just 25ms.
Quite happy how this all turned out.