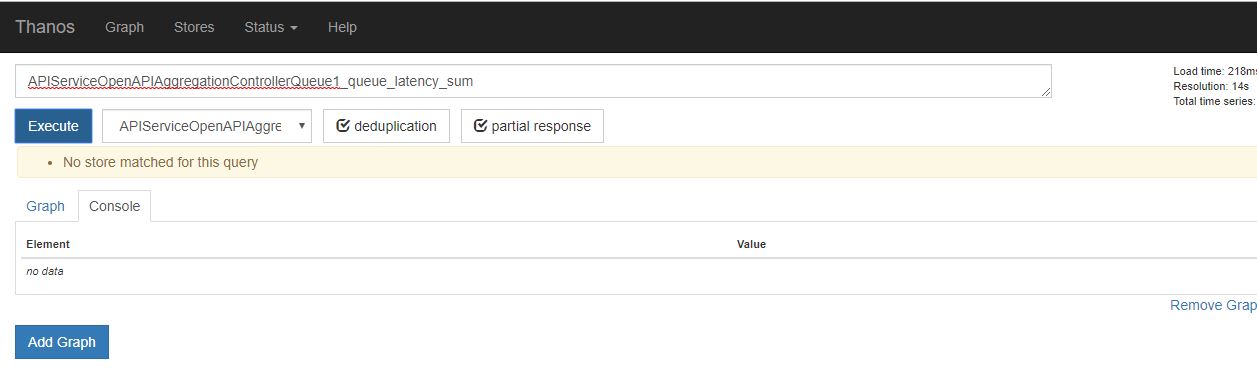
Thanos: No store matched for this query
Thanos, Prometheus and Golang version used
What happened
Unable to retrieve metrics data from the Store API on Store node that in turn retrieves data from the S3 bucket.
Also, the log message "query command failed: parse federation labels: unrecognized label "federated"" pops up when I try to use the --selector-label config.
What you expected to happen
How to reproduce it (as minimally and precisely as possible):
./thanos query --log.level=debug --http-address="0.0.0.0:19192" --grpc-address="0.0.0.0:10902" --cluster.address="0.0.0.0:10999" --store="localhost:10903"
Full logs to relevant components
level=warn ts=2018-12-06T12:50:00.354332319Z caller=proxy.go:136 err="No store matched for this query" stores="store Addr: localhost:10903 Labels: [] Mint: 1544004000000 Maxt: 1544090400000 filtered out"
When the --selector-label config is used:
level=debug ts=2018-12-06T12:49:49.207772384Z caller=cluster.go:143 component=cluster msg="resolved peers to following addresses" peers=
query command failed: parse federation labels: unrecognized label "federated"
Anything else we need to know
 sagaranand015
All 5 comments
Looks like you are just querying for time range outside of what store has: Mint: 1544004000000 Maxt: 1544090400000
Why using selector label? I think you are missing what's the purpose. Selector label is not really useful until you go into more advanced logic (like potential circular query federation). So just don't use. The error is just selector label requries label name and label value.
 bwplotka
on 7 Dec 2018
bwplotka
on 7 Dec 2018
@bwplotka: Thanks for the revert. However, the S3 data in our case has the indices made within this time range. I can see the meta files within the indices and validate that the data in S3 exists for mint and maxt parameters of the query.
Can there be any other problem during this query?
I can even see the following while starting the thanos query component:
level=info ts=2018-12-11T05:47:44.380919743Z caller=storeset.go:227 component=storeset msg="adding new store to query storeset" address=10.100.214.175:10903
sagaranand015
on 11 Dec 2018
@bwplotka : Did some digging into the code and found that the real problem was actually the time range. The Query component was connecting only to the S3 store and S3 did not have the latest 2 hours data. Instead, data in S3 was available only till (NOW-2 hours).
Since there was no data, the default timerange did not return any result. If a larger time range is specified in the promQL query, the results are returned.
Maybe, there can be a better warn message if the queried timestamp is outside the timerange of the store. Closing the issue, thanks!
sagaranand015
on 14 Dec 2018
Hi
I am facing the same issue. Is there a way to specify the time range. I keep getting these error logs continuously.
Error Logs:
: 1557813600000 Maxt: 1557820800000 queried"
level=debug ts=2019-05-14T09:58:38.255088693Z caller=proxy.go:176 msg="store Addr: thanos-store-gateway.istio-system.svc.cluster.local.:10901 Labels: [] Mint: 1557813600000 Maxt: 1557820800000 queried"
level=debug ts=2019-05-14T09:58:38.255344845Z caller=proxy.go:176 msg="store Addr: thanos-store-gateway.istio-system.svc.cluster.local.:10901 Labels: [] Mint: 1557813600000 Maxt: 1557820800000 queried"
level=debug ts=2019-05-14T09:58:38.255665034Z caller=proxy.go:176 msg="store Addr: thanos-store-gateway.istio-system.svc.cluster.local.:10901 Labels: [] Mint: 1557813600000 Maxt: 1557820800000 queried"
 boyka2405
on 14 May 2019
boyka2405
on 14 May 2019
@boyka2405 : As mentioned in the comment above, the query component goes only to S3 in the default state and the UI you see(in the default config of query component) has less than 2 hours range of minT and maxT. So, the query component is unable to get the data in S3 since the time range is never satisfied.
Two options here:
- Check the PromQL HTTP API and specify a bigger time range. (Dirty way: Right click the browser, go to the network tab of browser console and click "Execute". You'll get the HTTP Call, copy that and change the time range)
- Run your query component to read data from the local store too. As far as I remember, the query component stores 2 hours of data within the local store and then syncs it with S3.
I'm not sure of [2], but please check with the above options.
sagaranand015
on 14 May 2019
Related issues
 paulcdejean
·
4Comments
paulcdejean
·
4Comments
 barryib
·
4Comments
barryib
·
4Comments
 sepich
·
4Comments
sepich
·
4Comments
 sbocz
·
4Comments
sbocz
·
4Comments
 asudhakarreddy
·
3Comments
asudhakarreddy
·
3Comments
Most helpful comment
@bwplotka : Did some digging into the code and found that the real problem was actually the time range. The Query component was connecting only to the S3 store and S3 did not have the latest 2 hours data. Instead, data in S3 was available only till (NOW-2 hours).
Since there was no data, the default timerange did not return any result. If a larger time range is specified in the promQL query, the results are returned.
Maybe, there can be a better warn message if the queried timestamp is outside the timerange of the store. Closing the issue, thanks!