Test-infra: scalability jobs are sometimes evicted causing lost runs
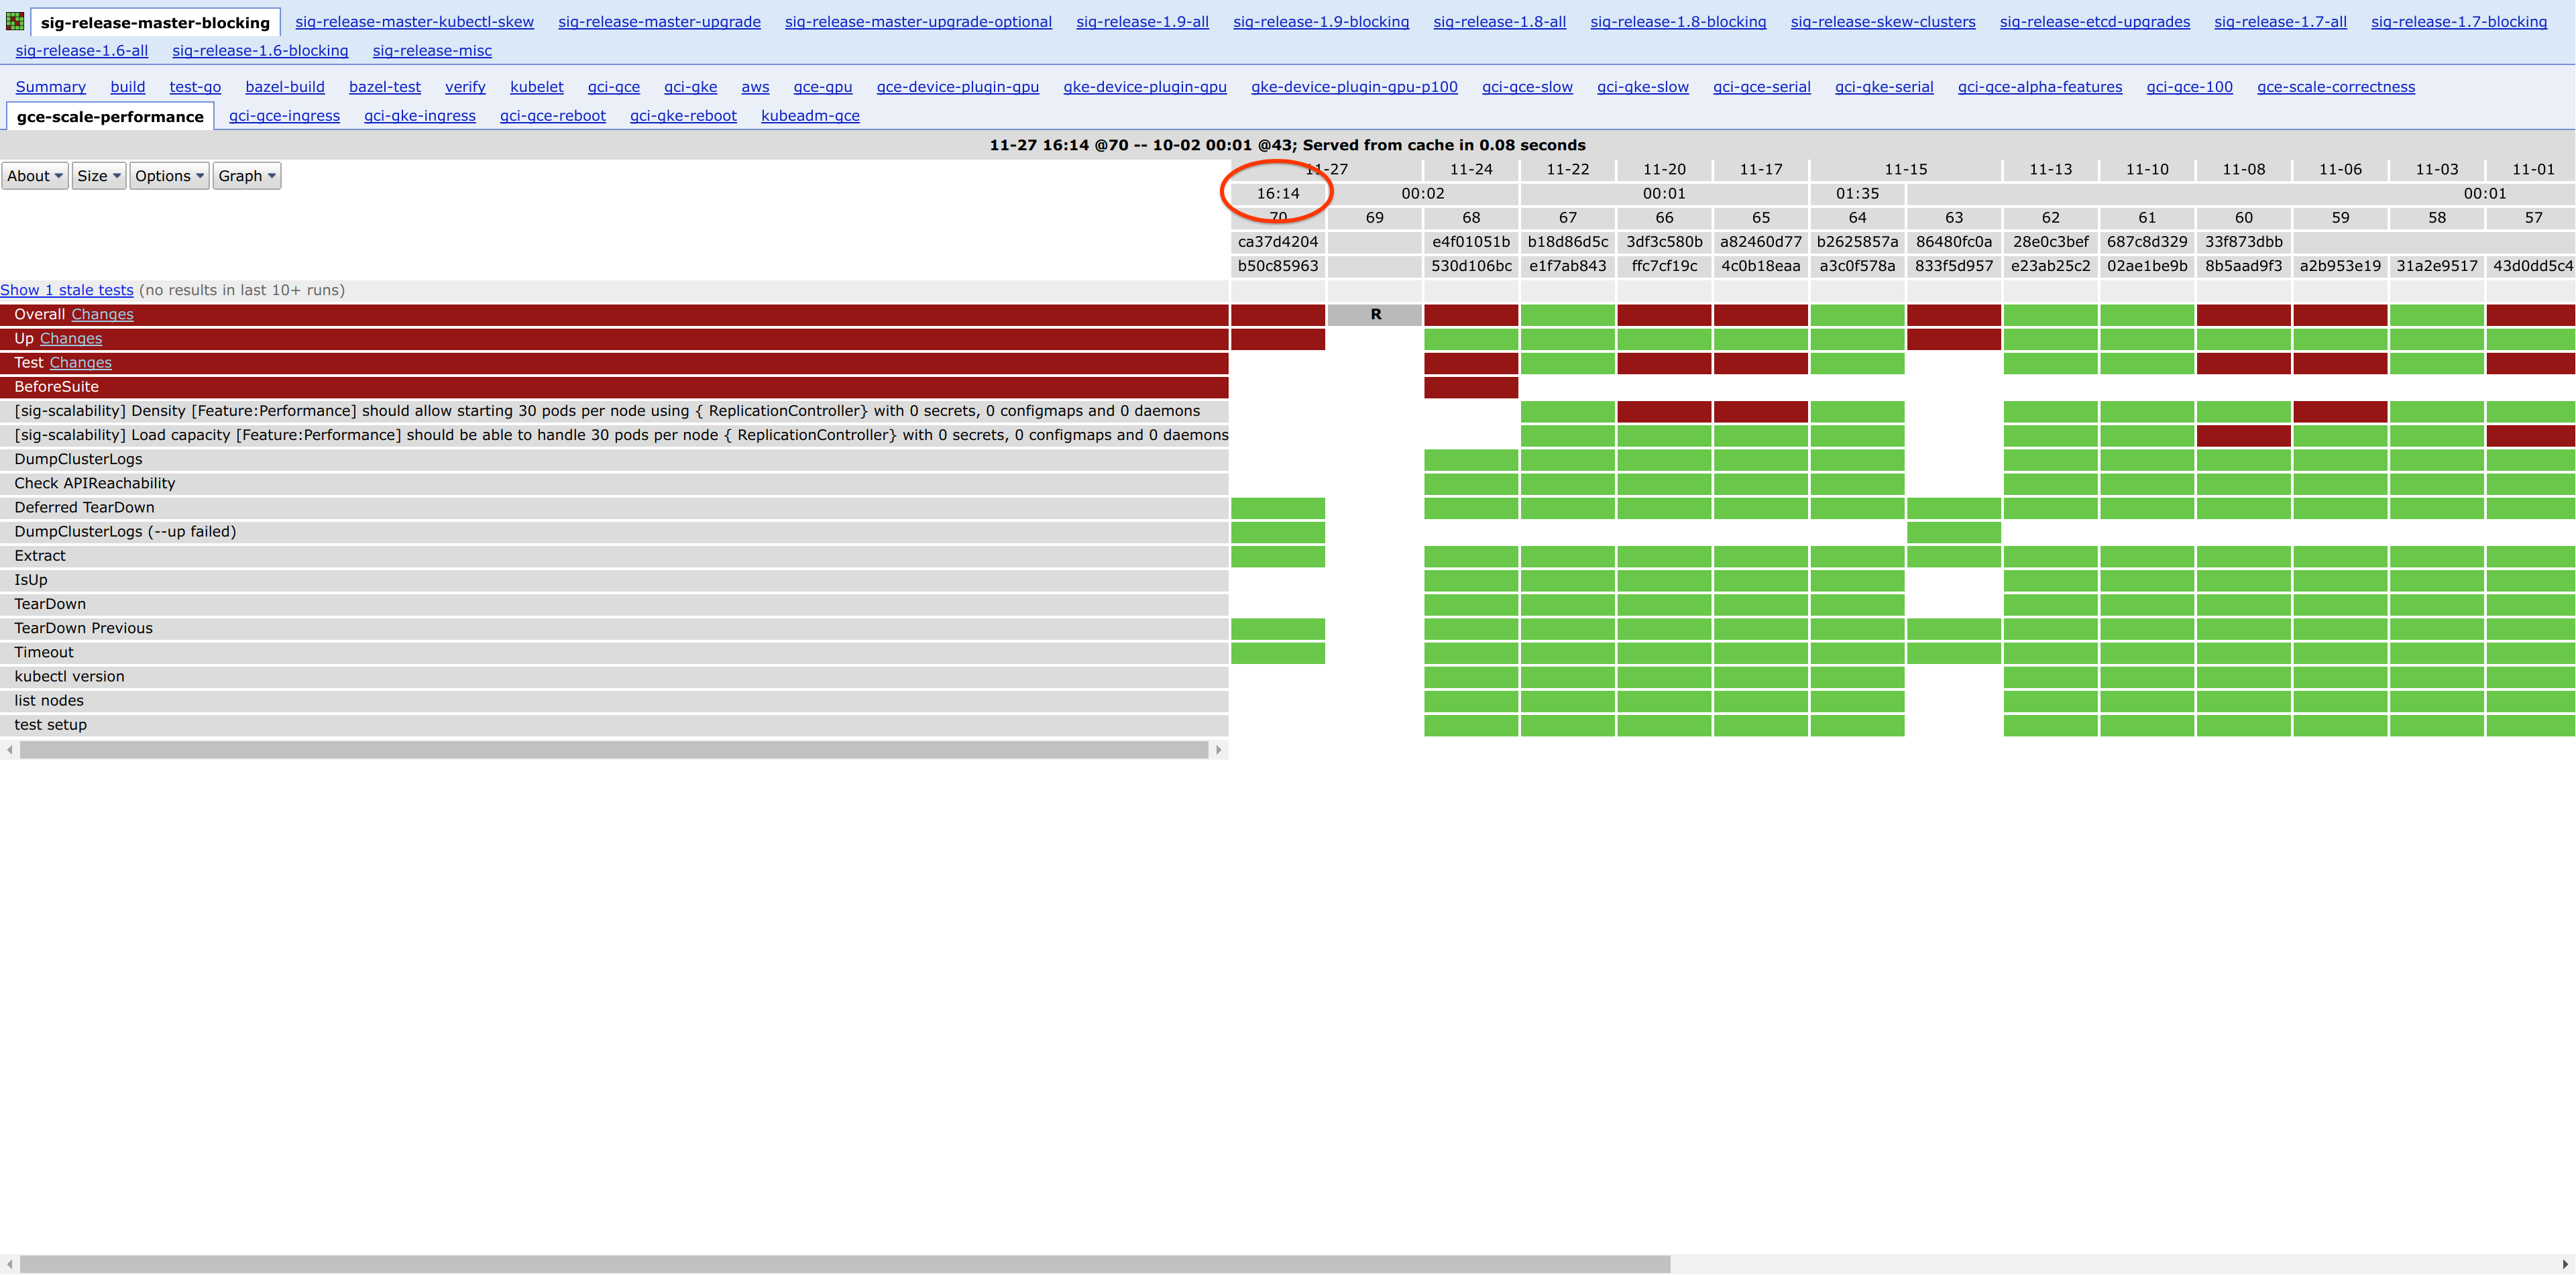
Run 17 of https://k8s-testgrid.appspot.com/sig-scalability-gce#gce-scale-performance ran at 16:14 while it should have been triggered around ~00:01.
This can be dangerous for other jobs as it can interfere and fail them too.
/assign @krzyzacy
Could you PTAL? This is a bit high priority.
cc @kubernetes/sig-scalability-misc
 shyamjvs
All 48 comments
The run itself seems to have failed due to a different reason - https://github.com/kubernetes/kubernetes/issues/55777
But we need to ensure that jobs are being triggered at the right times.
shyamjvs
on 28 Nov 2017
it looks to me like it did trigger at ~00:01 but got rescheduled by kubernetes somehow, testgrid has a "running" entry hung at 00:02, which suggests to me that the pod never managed to upload logs.
 BenTheElder
on 29 Nov 2017
BenTheElder
on 29 Nov 2017
I'm assuming @shyamjvs meant run 70, not 17: https://k8s-gubernator.appspot.com/build/kubernetes-jenkins/logs/ci-kubernetes-e2e-gce-scale-performance/70
@BenTheElder the one you refer to is 69. So something else must have triggered 70.
 porridge
on 29 Nov 2017
porridge
on 29 Nov 2017
The started time is misleading, look at https://k8s-gubernator.appspot.com/build/kubernetes-jenkins/logs/ci-kubernetes-e2e-gce-scale-performance/70?log#log
I1128 00:14:46.792] Bootstrap ci-kubernetes-e2e-gce-scale-performance...
00:14:46.792 is certainly not 16:14 even with UTC <-> PST
BenTheElder
on 29 Nov 2017
AFAICT #70 did run at 00:14 UTC, which is reasonable for triggering at ~00:01 since kubernetes must still schedule the job pod onto a node.
BenTheElder
on 29 Nov 2017
Right. So where on earth is testgrid getting this number from?
porridge
on 29 Nov 2017
It's not the timestamp in either started.json nor finished.json...
porridge
on 29 Nov 2017
run 70's started.json has 1511828086 or Tuesday, November 28, 2017 12:14:46 AM which is 16:14 PST
run 69's started.json has 1511769740 or Monday, November 27, 2017 8:02:20 AM, which is 00:02 PST
I'm not sure how those numbers came about though. Also if you look in the artifacts:
http://gcsweb.k8s.io/gcs/kubernetes-jenkins/logs/ci-kubernetes-e2e-gce-scale-performance/69/artifacts/
http://gcsweb.k8s.io/gcs/kubernetes-jenkins/logs/ci-kubernetes-e2e-gce-scale-performance/70/artifacts/
69 seems to have cluster minion data while 70 has master data and the junit output.
BenTheElder
on 29 Nov 2017
@porridge @shyamjvs My theory: the pod got rescheduled again by kubernetes, potentially it was OOMKilled - do you want to add a resource request for those scalability jobs?
edit: or there's something we can add to podspec to tell kubernetes don't reschedule the pod?
 krzyzacy
on 29 Nov 2017
krzyzacy
on 29 Nov 2017
Let's try doing that.
On Wed, Nov 29, 2017 at 7:09 PM Sen Lu notifications@github.com wrote:
My theory: the pod got rescheduled again by kubernetes, potentially it was
OOMKilled - do you want to add a resource request for those scalability
jobs?—
You are receiving this because you were mentioned.
Reply to this email directly, view it on GitHub
https://github.com/kubernetes/test-infra/issues/5700#issuecomment-347946644,
or mute the thread
https://github.com/notifications/unsubscribe-auth/AEIhkz-hKtu2exeoNPQ8kuFBKIm3wWErks5s7Z3mgaJpZM4QuJzE
.
shyamjvs
on 29 Nov 2017
So every pod execution gets a new job number?
porridge
on 29 Nov 2017
@porridge yeah, upon reschedule, the pod will start a brand new job from very beginning
krzyzacy
on 29 Nov 2017
I think the answer to this issue might just be this - https://github.com/kubernetes/test-infra/pull/5284#issuecomment-348168457
Something like a StartingDeadlineSeconds which stops the job from being triggered too late after the missed time.
shyamjvs
on 30 Nov 2017
I'm seeing a lot of runs of this job (8469-8471, 847, 8481) which are shown as still 'Running' - https://k8s-testgrid.appspot.com/sig-scalability-gce#gce (wasn't the case before when we were on jenkins). My guess is that they've timed out - but we need to root cause this ASAP. It's increasing our job flakiness.
shyamjvs
on 30 Nov 2017
Note that this is happening time and again for our release-blocking jobs:
- https://k8s-testgrid.appspot.com/sig-scalability-gce#gce-scale-correctness
- https://k8s-testgrid.appspot.com/sig-scalability-gce#gce-scale-correctness
Those failures can be critical before the release. In the worst case, we might need to move those 2 particular jobs back to jenkins.
shyamjvs
on 30 Nov 2017
the 'running' ones are actually got rescheduled due to node fs pressure (they are not actually running) - I don't think k8s CronJob can solve this, the cron part is correct, but the job was rescheduled.
We'll try to upgrade build cluster to 1.8 and see if that resolves the issue.
krzyzacy
on 30 Nov 2017
Yep, these appear to be rescheduled by the kubernetes scheduler on the build cluster, cron is behaving perfectly.
I did a deep dive into some issues I observed with the build cluster with the Node team last night and I think I know what caused these, and it's a kubernetes bug :-)
We should NOT run back to Jenkins because of kubernetes issues. K8s infra will run on k8s. The humans observing the dashboards should be aware of jobs not reporting results being different from the test cases failing. The rescheduled runs also passed.
BenTheElder
on 30 Nov 2017
We'll try to upgrade build cluster to 1.8 and see if that resolves the issue.
Not sure I understand how that is going to help. Does that do some bug fix?
Yep, these appear to be rescheduled by the kubernetes scheduler on the build cluster, cron is behaving perfectly.
It is not just about making cron work here.. We need to make all the pieces work well together as that is what is going to make the job run fine at the end of the day.
We should NOT run back to Jenkins because of kubernetes issues
I totally agree we shouldn't go back to jenkins. However, that might be a last resort if the release is blocked on this.
The humans observing the dashboards should be aware of jobs not reporting results being different from the test cases failing.
HUmans, probably yes... but what about automatic scripts like anago (which we're using to cut the release) which check if there were '3 green runs of the release-blocking job' or not. If not, the release cut won't go through :)
shyamjvs
on 30 Nov 2017
quote from chat w/ @BenTheElder
TLDR it's misaccounting for the containers' disk useage which is something they eventually stopped trying to do. The real disk usage is nominal.
We dug through the data in pcon and bumped the kubelet log level on one of the affected nodes.
In 1.7.9 or so they disabled that signal and in 1.8.4 it's totally gone.
krzyzacy
on 30 Nov 2017
Not sure I understand how that is going to help. Does that do some bug fix?
We are on 1.7.8 for the build cluster which apparently can get spurious NodeHasDiskPressure evictions based on trying to account for the container usage even while the actual FS usage for the kubelet is nominal. So yes, hopefully.
It is not about making cron work here.. We need to make all the pieces work well together as that is what is going to make the job run fine at the end of the day.
Sure, but if the job is bad and was aborted, or in this case was rescheduled by the build cluster because of a kubernetes issues we should fix those things specifically.
HUmans, probably yes... but what about automatic scripts like anago (which we're using to cut the release) which check if there were '3 green runs of the release-blocking job' or not. If not, the release cut won't go through :)
We have time before the release, and anago can be patched :-) There are plenty of ways we can avoid this being an issue. However if it's the bug we found last night it's affecting plenty of other jobs too.
BenTheElder
on 30 Nov 2017
Sgtm.
We have time before the release, and anago can be patched :-) There are plenty of ways we can avoid this being an issue.
Yes, anago can be patched. But those checks are there for a purpose - to ensure good release signal. Tweaking it to bypass them defeats that purpose. Besides, with every lost run we're adding more uncertainty (until hopefully we get the next green run). Scale jobs are usually much more likely to catch regressions from across the system and since they're also quite slow, each run is very valuable.
That said, I'm very sure you and @krzyzacy have great hands to fix this :)
shyamjvs
on 30 Nov 2017
We're not actually losing runs though, we're getting a false start which is
soon replaced by a clean one within ~20mins when it is scheduled onto an
unnaffected node. We might actually want to tweak anago to ignore jobs
stuck in the "R"/running state.
On Thu, Nov 30, 2017, 10:44 Shyam JVS notifications@github.com wrote:
Sgtm.
We have time before the release, and anago can be patched :-) There are
plenty of ways we can avoid this being an issue.Yes, anago can be patched. But those checks are there for a purpose - to
ensure good release signal. Tweaking it to bypass them defeats that
purpose. Besides, with every lost run we're adding more uncertainty (until
hopefully we get the next green run). Scale jobs are usually much more
likely to catch regressions from across the system and since they're also
quite slow, each run is very valuable.That said, I'm very sure you and @krzyzacy https://github.com/krzyzacy
have great hands to fix this :)—
You are receiving this because you were mentioned.
Reply to this email directly, view it on GitHub
https://github.com/kubernetes/test-infra/issues/5700#issuecomment-348282195,
or mute the thread
https://github.com/notifications/unsubscribe-auth/AA4Bq2HacRQ0jota-LiMIQAElSSAC0dYks5s7velgaJpZM4QuJzE
.
BenTheElder
on 30 Nov 2017
@BenTheElder the issue is we are going to leak a scalability cluster if we abort the run, which can cause problems for subsequent runs
krzyzacy
on 30 Nov 2017
It is not going to cause problems for the subsequent runs of the same job per se - as each run begins with tearing down any pre-existing cluster before bringing up new one.
However, the problem is with different jobs interfering with one another. I solved that problem by naming the cluster (and other resources) the same across all those jobs (as anyway there can't be more than one of them at a given time). But there is still this problem that a lately triggered run will have it's cluster aborted in b/w due to the next job run.
shyamjvs
on 30 Nov 2017
what we've done today:
- upgraded prow build cluster from 1.7.8 to 1.8.4
- added resource request for -large and -scale jobs
- make prow clean up finished pods more aggresively
and this is affecting all other jobs as well, not only scalability jobs.
and @dashpole is also helping looking into the issue here (thanks a lot!)
/assign @dashpole
krzyzacy
on 1 Dec 2017
@shyamjvs @porridge for a more detailed status update:
Current Status:
I've confirmed that a number of these hung runs are evicted pods by examining our logs. It does not appear that there are any problems with the cron scheduling, only that jobs can have their pods evicted.
Build nodes are on 1.8.4 now which should prevent false
NodeHasDiskPressureevents (which can evict nodes). Prior to the upgrade we can see lots of nodes in different pools (different sized/shaped nodes) gettingNodeHasDiskPressureevents, but after the upgrade we only see this on ourn1-highmem-8pool which hasn1-highmem-8with 100gb boot disk and local ssd.We also have three
NodeHasInsufficientMemoryevents, one on the 25th, one on the 26th, and one on the 30th. Two are in indefault-pool, one is inpool-highmem, withn1-standard-4andn1-highmem-4nodes respectively.- This will not affect scalability jobs as they now all request 16Gi memory and use much less so they would be the last to be evicted and we're only ever seeing 1 container evicted.
sinkernow checks for stale pods once a minute that are 30 minutes old past their termination / completion and GCs them instead of the previous configuration of once an hour for hour old pods. This should reduce disk pressure on all nodes by cleaning up completed pods more regularly and with a lower threshold.
TODO O(now):
- I am going to drain the
n1-highmem-8pool over topool-n1-highmem-8which is the same but with twice as much boot disk (200gb) since we've determined they may still sometimes have real disk pressure.
TODO O(tomorrow):
- I am also going to look into a work around to get soft eviction thresholds turned on in the build cluster.
If this is feasible (I discussed a hacky option with @mtaufen @dashpole) I will set a soft threshold for nodefs.available to ~ 40% and something like ~ 1 hour soft timeout globally so that jobs are not evicted over disk unless no jobs clean up and reduce pressure before the timeout.
BenTheElder
on 1 Dec 2017
@BenTheElder thank you for the update, is there an ETA? (this blocks https://github.com/kubernetes/kubernetes/issues/56052)
porridge
on 1 Dec 2017
2017-11-30 17:15:40.000 PST is the last time we saw a Node <elided> status is now: NodeHasDiskPressure message. I think we may still want to increase the disk size for higher memory nodes though to be safe. The queue is also empty right now.
BenTheElder
on 1 Dec 2017
@BenTheElder ah, so you think that actions taken up to now should be sufficient, and the TODOs are optional?
porridge
on 1 Dec 2017
@shyamjvs can you retitle the issue to mention evictions as cause rather than cron?
porridge
on 1 Dec 2017
@porridge Yes, the TODOs are mostly further efforts to prevent future problems. I'm not 100% sure the current changes are sufficient as it's possible in the future with more jobs being scheduled we will see disk pressure return, and there's a chance under disk pressure that the scalability jobs can still be evicted (unlike memory or CPU).
Tweaking sinker's pod GC rate and upgrading to 1.8.4 seems to have helped a lot but I want to be more thorough. I would expect it should at least be enough for tonight's runs to happen without evictions 🤞
For the TODOs:
- I'm looking at the node shapes / draining right now.
- I'm not sure about soft eviction, GKE does not yet have a supported way to set kubelet flags so we'll have to do something a bit hackier unless we find a better alternative. There is pod priority which might make sense, but it is also behind feature gate flags.
- The tentative plan is to explore adding a small bit of automation to add these kubelet flags to each of the build cluster nodes's kubelet service periodically. We manually increased the verbosity of one kubelet when debugging last night and this went fine so I think we can automate a similar pattern to add the soft eviction flags. It's hacky but it should work. Soft eviction is definitely what we need here to prevent disk pressure evictions.
BenTheElder
on 1 Dec 2017
(also xref https://github.com/kubernetes/test-infra/issues/5449)
krzyzacy
on 1 Dec 2017
All of the n1-highmem-8 nodes have been moved to pool-n1-highmem-8 with the double-default-size boot disks. We may still want to move some of the other two pools around.
Edit: I've also completely deleted the "n1-highmem-8" pool with the smaller disk.
I've also just (11:45 PM PST) checked and we still do not have any more disk pressure, insufficient memory, or eviction log entries since ~5:16 PM PST (around when the sinker changes were made, and well after the kubernetes version upgrade)
BenTheElder
on 1 Dec 2017
More failures:
porridge
on 1 Dec 2017
Thanks for those fixes @BenTheElder @krzyzacy - let's keep a close watch on the jobs to see if that helped.
shyamjvs
on 1 Dec 2017
We have still not seen any more evictions and ci-kubernetes-e2e-gce-scale-performance/74 triggered at 2017-12-01 00:01 PST, uploaded started.json at 2017-12-01 00:02 PST and is still running:
I1201 18:28:11.008] STEP: Scaling { ReplicationController} load-small-5475 in namespace e2e-tests-load-30-nodepods-26-cnbk5 to 2
Edit: (log stamp is UTC, so that entry was 2 minutes ago when I opened the logs)
BenTheElder
on 1 Dec 2017
I1201 23:19:51.274] SUCCESS! -- 2 Passed | 0 Failed | 0 Pending | 707 Skipped PASS
Looks like the job is wrapping up :-)
Still no more evictions, and we've finished moving all highmem nodes to be standardized on the pool-n1-highmem-8 described above.
BenTheElder
on 2 Dec 2017
I think we can close it, then. We can always reopen if this happens again.
Thank you for the fast reaction!
porridge
on 2 Dec 2017
Thanks guys for those quick fixes. FTR latest green run -
https://k8s-gubernator.appspot.com/build/kubernetes-jenkins/logs/ci-kubernetes-e2e-gce-scale-performance/74
On Sat, Dec 2, 2017, 8:43 AM Marcin Owsiany notifications@github.com
wrote:
I think we can close it, then. We can always reopen if this happens again.
Thank you for the fast reaction!—
You are receiving this because you were mentioned.
Reply to this email directly, view it on GitHub
https://github.com/kubernetes/test-infra/issues/5700#issuecomment-348675305,
or mute the thread
https://github.com/notifications/unsubscribe-auth/AEIhk91x3c4Jy6sdLXaZxwywDWWJ_R8dks5s8P-0gaJpZM4QuJzE
.
shyamjvs
on 2 Dec 2017
okay I'll close this for now.
we'll probably need keep an extra eye on prow workloads when code freeze is over.
krzyzacy
on 3 Dec 2017
As an addendum we have the soft eviction thresholds for disk enabled now, and I've made a note to those working with the build cluster to enable this again if they change any nodes.
I consider this experimental but it should help if we do see more disk usage (likely when we have higher rates of testing).
BenTheElder
on 4 Dec 2017
Can you please take a look at https://k8s-gubernator.appspot.com/build/kubernetes-jenkins/logs/ci-kubernetes-e2e-gci-gce-scalability/8754 - was this an eviction?
FTR, it seems like https://k8s-gubernator.appspot.com/build/kubernetes-jenkins/logs/ci-kubernetes-e2e-gci-gce-scalability/8755 failed because it clashed with 8754 which was shutting down while it disappeared.
porridge
on 8 Dec 2017
8754 and 8755 had builder (pod UUID) 5814b78c-dc09-11e7-9214-0a580a6c0130 which does not appear to be a pod in the cluster currently, however we also don't have any results for evict as far back as the logs go however I also see it being scheduled twice potentially.
2017-12-08 03:55:45.000 PST
Successfully assigned 5814b78c-dc09-11e7-9214-0a580a6c0130 to gke-prow-pool-n1-highmem-8-81ce4395-cbls
2017-12-08 03:17:46.000 PST
Successfully assigned 5814b78c-dc09-11e7-9214-0a580a6c0130 to gke-prow-pool-n1-highmem-8-81ce4395-83j6
/cc @cjwagner @krzyzacy
BenTheElder
on 8 Dec 2017
It definitely looks like that job was rescheduled to me, however I don't see anything in the cluster logs to suggest why. There are not any NodeHasDiskPressure, evict, OOM, ...
Looking through the logs specifically for that node however, I see a number of entries like 2017-12-08 03:55:40.000 PST Pod sandbox changed, it will be killed and re-created. around that time:
2017-12-08 03:55:27.000 PST Pod sandbox changed, it will be killed and re-created.
2017-12-08 03:55:27.000 PST Pod sandbox changed, it will be killed and re-created.
2017-12-08 03:55:27.000 PST Pod sandbox changed, it will be killed and re-created.
Edit these are on gke-prow-pool-n1-highmem-8-81ce4395-83j6.
BenTheElder
on 8 Dec 2017
I will investigate this further later, presubmit Jenkins seems to be completely down. I want to know how this happened however. So far this doesn't make sense.
BenTheElder
on 8 Dec 2017
I just wanted to update that @dashpole and I are digging pretty deep into the node it was first scheduled on to diagnose this, so far it does not look to be any sort of eviction, nor have we seen any other ones, so it is most likely a new issue.
BenTheElder
on 8 Dec 2017
@shyamjvs @porridge :
@yguo0905 and @dashpole and I debugged the node and found what happened:
- the boskos janitor is leaking threads (gcloud processes?)
- this caused pthread_create to fail on the node when the kubelet ran docker ps to check the node health
- this triggered restarting docker since the health check failed
- ... which caused the pod to be rescheduled due to docker being aborted
We need to fix the janitor job, but we also may want to do further mitigations. In theory there are some options available in the future for surviving this particular case (thread limits in kubelet and docker live restore) but those are not available yet.
BenTheElder
on 8 Dec 2017
The janitor leaks were resolved yesterday, and today I put out what should be a better mitigation against this in https://github.com/kubernetes/test-infra/pull/5885, however it's still possible for a random job to consume lots of PIDs on the host leading to the same kind of pod rescheduling.
There is no mitigation for this yet in kubernetes, I've attempted to re-raise this issue.
BenTheElder
on 10 Dec 2017
Related issues
 stevekuznetsov
·
3Comments
stevekuznetsov
·
3Comments
 spiffxp
·
3Comments
spiffxp
·
3Comments
 MrHohn
·
4Comments
MrHohn
·
4Comments
 fejta
·
4Comments
fejta
·
4Comments
 cblecker
·
4Comments
cblecker
·
4Comments
Most helpful comment
We have still not seen any more evictions and ci-kubernetes-e2e-gce-scale-performance/74 triggered at
2017-12-01 00:01 PST, uploaded started.json at2017-12-01 00:02 PSTand is still running:I1201 18:28:11.008] STEP: Scaling { ReplicationController} load-small-5475 in namespace e2e-tests-load-30-nodepods-26-cnbk5 to 2Edit: (log stamp is UTC, so that entry was 2 minutes ago when I opened the logs)