Teslamate: Grafana piechart plugin missing
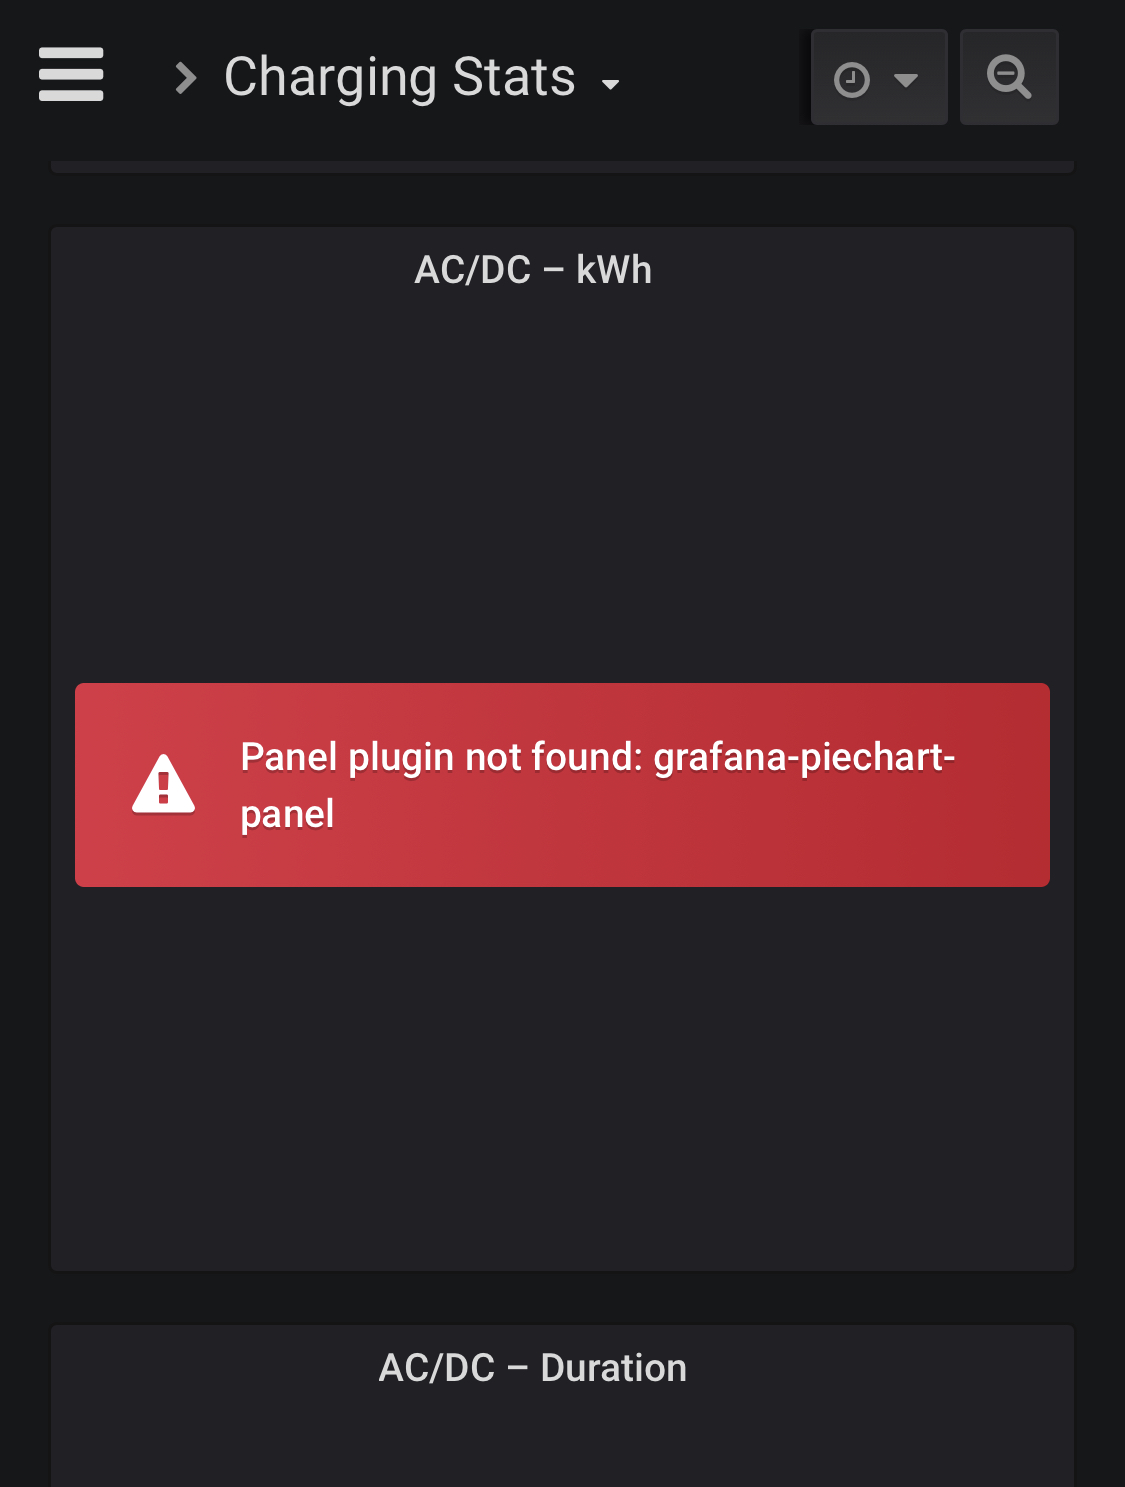
Get an error in Charge-Stats dasboard in 1.15.
Seems a plugin is missing.
 ctraber
All 16 comments
Docker or Manual install? If the latter is the case, you're gonna have to install the grafana-piechart-panel plugin.
 adriankumpf
on 23 Jan 2020
adriankumpf
on 23 Jan 2020
Docker, made a docker-compose pull.
Did the docker-compose.yml change?
ctraber
on 23 Jan 2020
Hm. No changes made. Did you add any custom docker volumes? Grafana usually (re)installs all plugins on startup. Could you add the logs of the grafana container?
adriankumpf
on 23 Jan 2020
According to the logs it is installed:
grafana_1 | installing grafana-piechart-panel @ 1.3.9
grafana_1 | from: https://grafana.com/api/plugins/grafana-piechart-panel/versions/1.3.9/download
grafana_1 | into: /var/lib/grafana/plugins
grafana_1 |
grafana_1 | ✔ Installed grafana-piechart-panel successfully
grafana_1 |
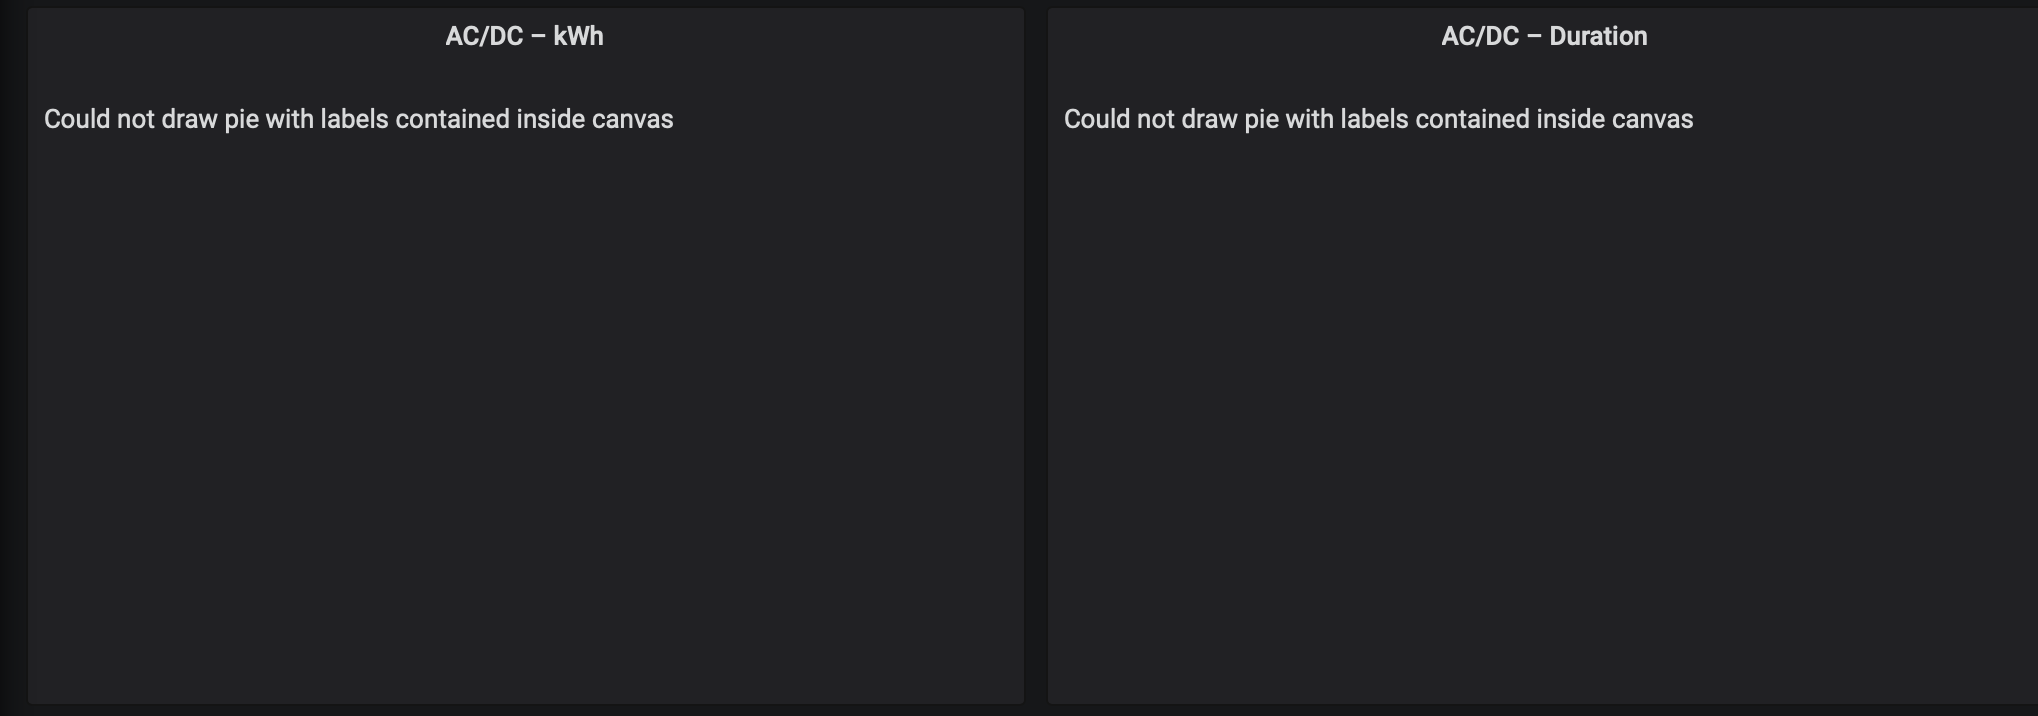
And after a reload of the page in the browser I get now this:
ctraber
on 23 Jan 2020
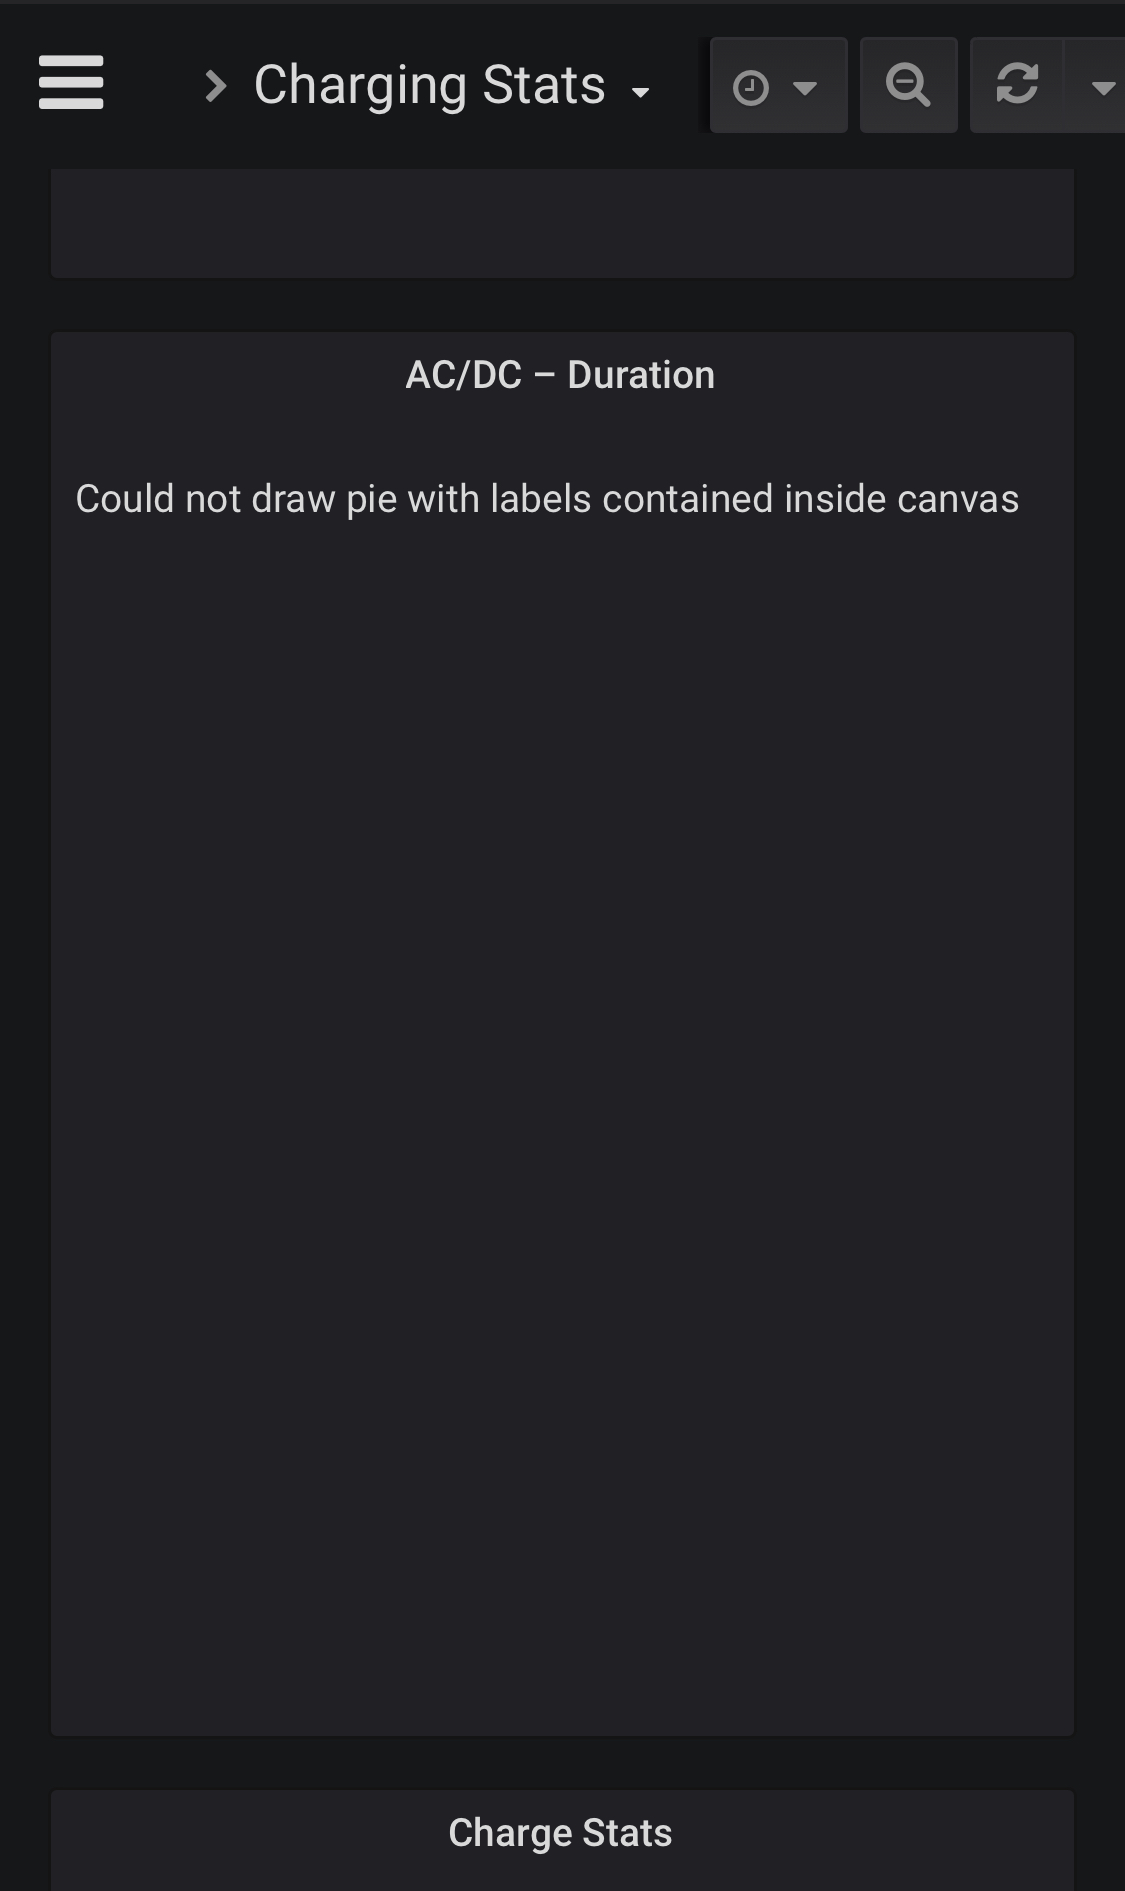
had the same issue, but after restarting docker it magically appeared on one side, but not the other one.
also when hovering with the mouse, you can see values, but you don't see the pies.. kind of weird behavior.
 tobiasehlert
on 23 Jan 2020
tobiasehlert
on 23 Jan 2020
For what it's worth, I have 3 cars; car id 1 and 2 are missing the pie charts, though the labels can be seen with the mouse-hover. Car id 3 pie charts are visible. A manual restart had no effect.
 tucopup
on 23 Jan 2020
tucopup
on 23 Jan 2020
Had the same issue upon install - mouse over could provide the values. Restart of docker did not resolve the issue.
 cwanja
on 24 Jan 2020
cwanja
on 24 Jan 2020
I see the same behavior as ctraber above, restart didn't help.
"Could not draw pie with labels contained inside canvas"
 MostDefiantly
on 25 Jan 2020
MostDefiantly
on 25 Jan 2020
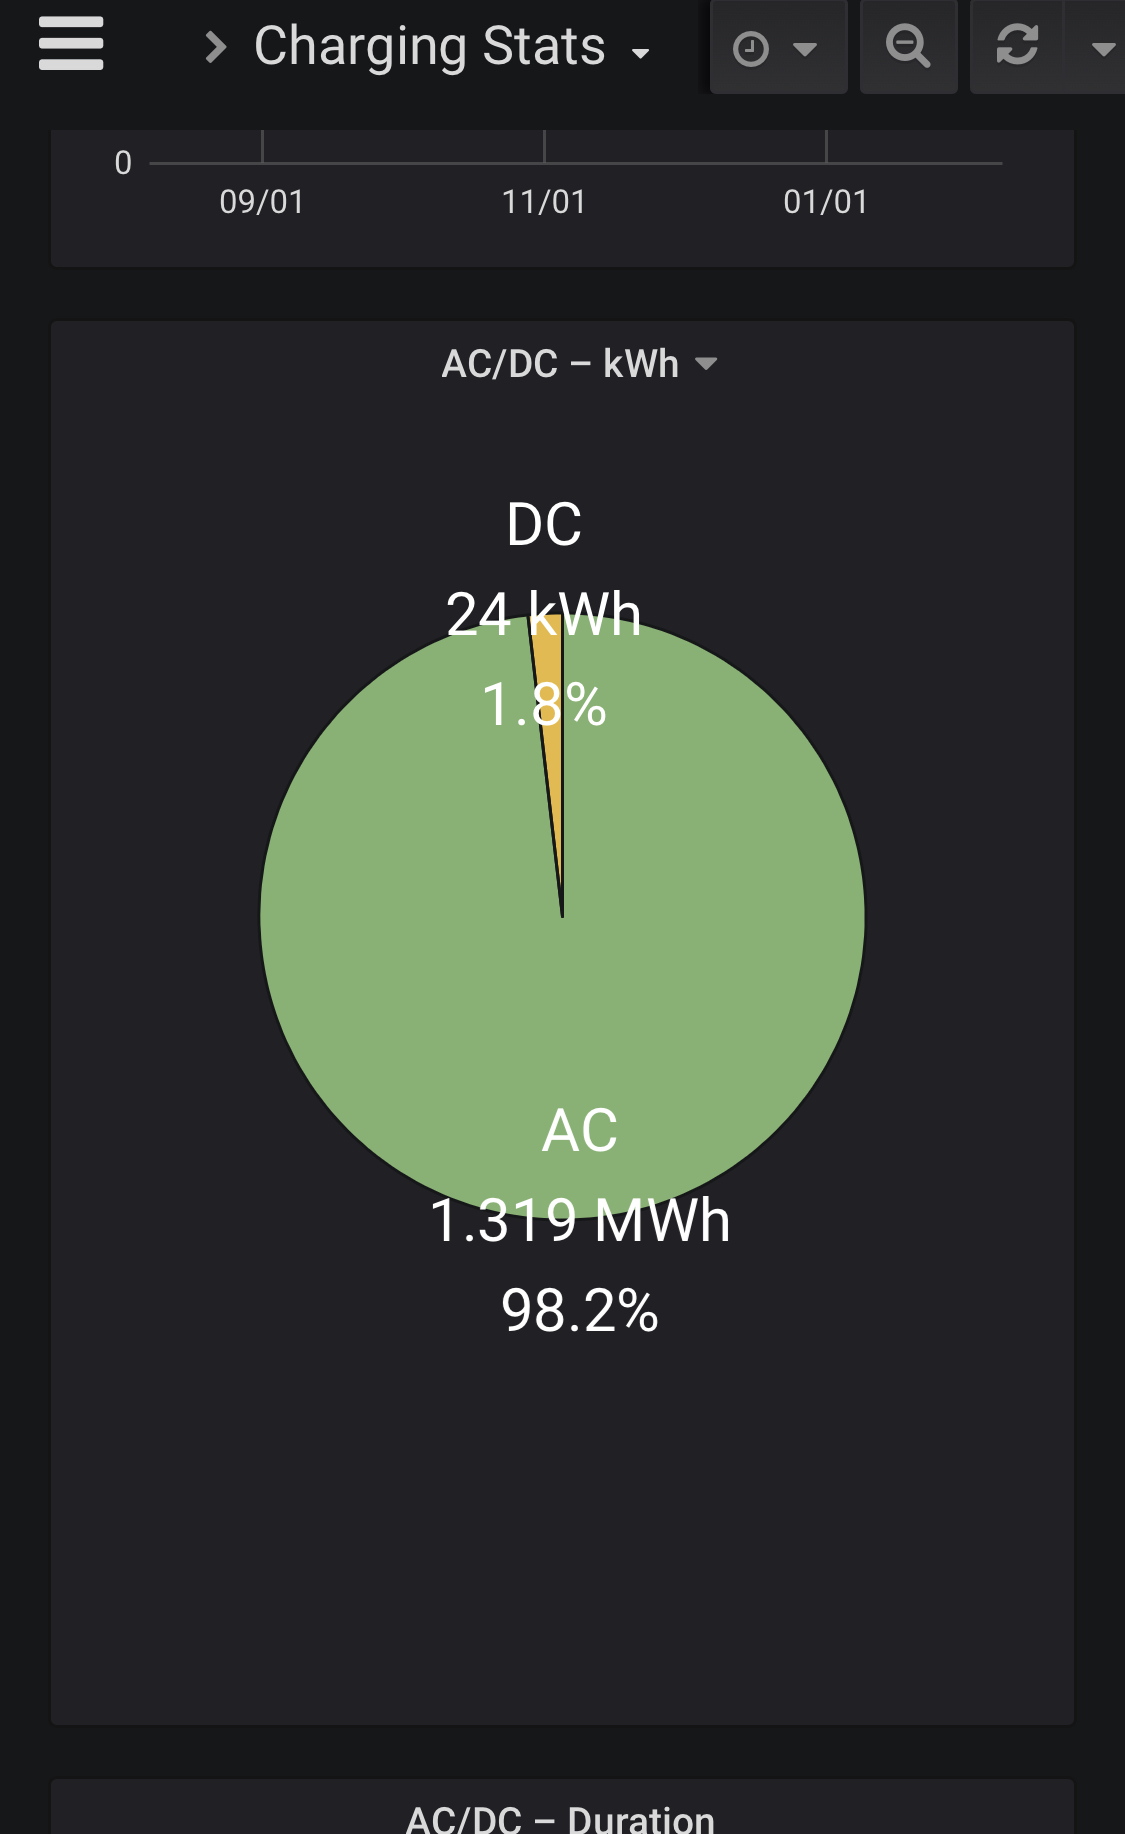
I notice that the pie chart displays when you click the dropdown "AC/DC -kwh" and select "view". In my case, the two cars that don't display properly are >99% AC, while the one that does display properly is 56%/44% in AC/DC and 92%/8% in the duration. More room in this one?
Can the labels be made to draw outside the pie?
tucopup
on 26 Jan 2020
For my car the tooltips show 97,89 and 99,74 and both piecharts are not working with "Could not draw pie with labels contained inside canvas"
ctraber
on 26 Jan 2020
I figured it out, it's the fact the windows the pie charts are in are too small. If I drag the box containing the piechart to a larger size, then it then appears as expected.
It needs to be one "size" up from where it is to display properly at a minimum.
MostDefiantly
on 28 Jan 2020
The legend position could be changed to be "Under graph" or "Right side" instead and it will always work regardless of window size and how thin the AC vs DC sliver is.
 twinor
on 30 Jan 2020
twinor
on 30 Jan 2020
Does anyone on v1.16 still have the problem?
adriankumpf
on 7 Feb 2020
Does anyone on v1.16 still have the problem?
Looks good @adriankumpf on v1.16
cwanja
on 7 Feb 2020
The first one with kWh works now on my iPhone. The second with Durstion still not.
ctraber
on 7 Feb 2020
Okay, too bad. Then I guess the position of the legend has to be changed, as @twinor suggested, even though the current one looks slightly better imo.
adriankumpf
on 7 Feb 2020
Related issues
 phantom1584
·
4Comments
phantom1584
·
4Comments
 olivercho
·
4Comments
olivercho
·
4Comments
 detritu5
·
4Comments
detritu5
·
4Comments
 Try2Fly
·
5Comments
Try2Fly
·
5Comments
 spacecosmos
·
5Comments
spacecosmos
·
5Comments
Most helpful comment
According to the logs it is installed:
grafana_1 | installing grafana-piechart-panel @ 1.3.9
grafana_1 | from: https://grafana.com/api/plugins/grafana-piechart-panel/versions/1.3.9/download
grafana_1 | into: /var/lib/grafana/plugins
grafana_1 |
grafana_1 | ✔ Installed grafana-piechart-panel successfully
grafana_1 |
And after a reload of the page in the browser I get now this:
