Just got this installed last night (comparing to Tesla-apiscraper) and had a few questions / issues:
My range shows 999 on the blue line for "Drive" dashboard. I was seeing something similar on Tesla-apiscraper, so it might be something with my data. But any way to resolve this?
Could we get an "overall" dashboard that combines a lot (or all) of the dashboards into a single screen? Could also help to rename some of the variables, as some of them look to be common names (Power, Speed, SOC) and then some look to be the attribute (fan_speed, is_climate_on).
Some of the stats on the Drives dashboard are missing (Consumption, Consumed, Efficiency, TR loss, TR start and TR end [these last two values seem to be the same]).
A few dashboards are blank, is this intended? It just started scraping data last night. Dashboards are: vampire drain, updates (_I get that there is nothing there_), efficiency,
Just wanted to say that this is amazing work and truly appreciate it. Please let me know how I can provide more details.
 cwanja
All 11 comments
- My range shows 999 on the blue line for "Drive" dashboard. I was seeing something similar on Tesla-apiscraper, so it might be something with my data. But any way to resolve this?
Never heard of this issue before. The range comes straight from the car. I'd suggest that you keep an eye on that. Feel free to report back after logging a few drives.
- Could we get an "overall" dashboard that combines a lot (or all) of the dashboards into a single screen? Could also help to rename some of the variables, as some of them look to be common names (Power, Speed, SOC) and then some look to be the attribute (fan_speed, is_climate_on).
If you want to make a PR, please feel free! I'm sure there are a lot of other great ideas and I'd love to see PRs in the future. The same applies to incorrectly named / translated variables :)
- Some of the stats on the Drives dashboard are missing (Consumption, Consumed, Efficiency, TR loss, TR start and TR end [these last two values seem to be the same]).
With short trips, sometimes not all information is available. Longer trips should show it, though. Maybe that's related to the above issue with the 999 range?
- A few dashboards are blank, is this intended? It just started scraping data last night. Dashboards are: vampire drain, updates (I get that there is nothing there), efficiency,
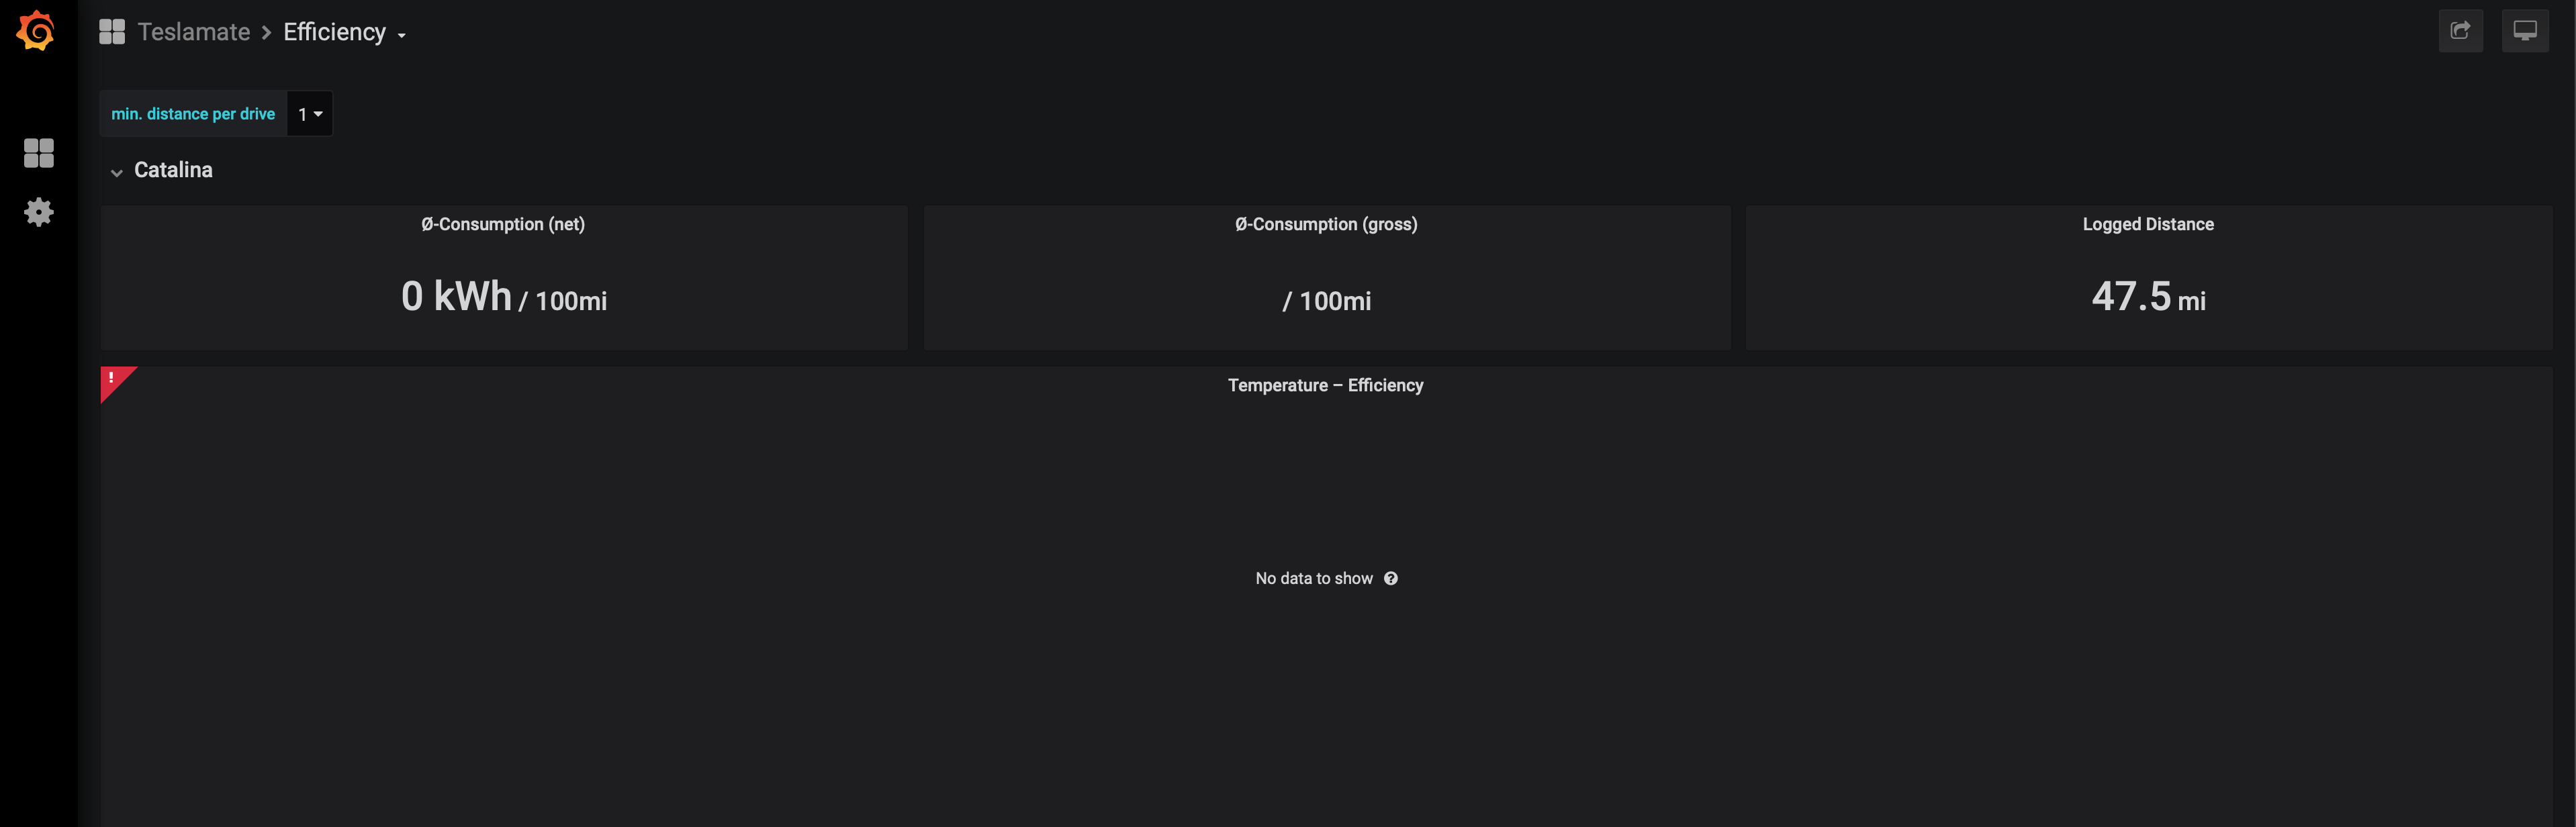
Blank dashboards = that data is not (yet) available. Edit: A few empty tables etc. should be visible on the Efficiency dashboard. ... could you provide a screenshot? How do you run Grafana (docker or manual installation)?
 adriankumpf
on 29 Aug 2019
adriankumpf
on 29 Aug 2019
- My range shows 999 on the blue line for "Drive" dashboard. I was seeing something similar on Tesla-apiscraper, so it might be something with my data. But any way to resolve this?
Never heard of this issue before. The range comes straight from the car. I'd suggest that you keep an eye on that. Feel free to report back after logging a few drives.
Will do. I will log a few more trips over the next few days, so will report back next week. Also performing a soft reboot now.
Edit: soft reboot did not resolve it. Comparing it to the debug information from TeslaScope, I assume that Range (est.) is the est_battery_range on the charge_state table. Assuming that, I guess the Range (ideal) is the battery_range from the same table? If so, TeslaScope is pulling it correctly.
- Could we get an "overall" dashboard that combines a lot (or all) of the dashboards into a single screen? Could also help to rename some of the variables, as some of them look to be common names (Power, Speed, SOC) and then some look to be the attribute (fan_speed, is_climate_on).
If you want to make a PR, please feel free! I'm sure there are a lot of other great ideas and I'd love to see PRs in the future. The same applies to incorrectly named / translated variables :)
Gotcha! Will look into a pull request to combine some of the dashboards. Will openly admit, I am no Linux or Github expert.
- Some of the stats on the Drives dashboard are missing (Consumption, Consumed, Efficiency, TR loss, TR start and TR end [these last two values seem to be the same]).
With short trips, sometimes not all information is available. Longer trips should show it, though. Maybe that's related to the above issue with the 999 range?
Do you know "how long" it would be too register? When using another tool out there (TeslaScope) that was being registered each drive - regardless of how short or long (e.g. even a three minute drive was registered and equated).
- A few dashboards are blank, is this intended? It just started scraping data last night. Dashboards are: vampire drain, updates (I get that there is nothing there), efficiency,
Blank dashboards = that data is not (yet) available. Edit: There should be empty a few tables etc on the effifiency dashboard ... could you provide a screenshot? How do you run Grafana (docker or manual installation)?
I _was_ running Grafana locally when using Tesla-apiscraper. I had to stop it to have TeslaMate run via docker as there was a conflict. Trying to figure out to log into Grafana when running via Docker to do some of the dashboard modifications mentioned above. Although, I know those would be overwritten on updates. Screenshot provided.
Thanks for the prompt response. PayPal donation coming your way shortly as well.
cwanja
on 29 Aug 2019
Edit: soft reboot did not resolve it. Comparing it to the debug information from TeslaScope, I assume that Range (est.) is the est_battery_range on the charge_state table. Assuming that, I guess the Range (ideal) is the battery_range from the same table? If so, TeslaScope is pulling it correctly.
Range (ideal) corresponds to the ideal_battery_range. The next release (which is coming very soon) will also log the battery_range.
Gotcha! Will look into a pull request to combine some of the dashboards. Will openly admit, I am no Linux or Github expert.
Awesome! Exporting the dashboards should be _relatively_ straight forward. Just put the exported json data in the grafana/dashboards directory.
Do you know "how long" it would be too register? When using another tool out there (TeslaScope) that was being registered each drive - regardless of how short or long (e.g. even a three minute drive was registered and equated).
A minute or less. TR (=ideal_battery_range) measurements should always appear. Consumption related values can only be derived if there is a known "efficiency factor" for your vehicle. The next release will add a new panel to the efficiency dashboard that enables us to crowdsource the missing factors.
I was running Grafana locally when using Tesla-apiscraper. I had to stop it to have TeslaMate run via docker as there was a conflict. Trying to figure out to log into Grafana when running via Docker to do some of the dashboard modifications mentioned above. Although, I know those would be overwritten on updates. Screenshot provided.
There is an error. What does it say?
Regarding Grafana: you can run it on another port. To do so change that line in the docker-compose.yml:
 ports:
      - 3000:3000
Range (ideal) corresponds to the
ideal_battery_range. The next release (which is coming very soon) will also log thebattery_range.
Saw your post in the other issue thread. I will update it once it is released.
A minute or less. TR (=
ideal_battery_range) measurements should always appear. Consumption related values can only be derived if there is a known "efficiency factor" for your vehicle. The next release will add a new panel to the efficiency dashboard that enables us to crowdsource the missing factors.
Hmm. All three of my recorded drives were over one mile and one minute long. Will keep an eye out on it. Also noticing that this missing data / the 999 range is throwing off the vampire drain as well.
There is an error. What does it say?
When trying to start up via docker-compose and my manual Grafana install was running here was the error:
ERROR: for grafana  Cannot start service grafana: driver failed programming external connectivity on endpoint teslamate_grafana_1 (8836bf77d5faaf99ad4813272f3719c2f3f4d71b1a129f8b95e0fd00de46209a): Error starting userland proxy: listen tcp 0.0.0.0:3000: bind: address already in use
ERROR: Encountered errors while bringing up the project.
Regarding Grafana: you can run it on another port. To do so change that line in the docker-compose.yml:
 ports:
      - 3000:3000
I tried that and did not get 3001 to work. Never tried another port. I guess my issue is really that I cannot _login_ to the docker Grafana version when it is running. Is there a documented username / password I am missing? Or is that only going to be achieved by making a pull request and modifying them locally. I then run into the issue of not having a data source, right? Again - total newbie here.
cwanja
on 29 Aug 2019
3001:3000 did not work? The teslamte/grafana images does not require you to login (it also pre-configures the data source etc.). However, there is a default user: admin:admin.
adriankumpf
on 29 Aug 2019
🤦♂ tried 3001:3001. My fault. Never the less, I paused Tesla-apiscraper while evaluating TeslaMate. So having my manual install of Grafana running at the same time is not as critical. But now knowing this, I guess I could run both and that could help compare data 😄
Got logged in! Thanks.
cwanja
on 29 Aug 2019
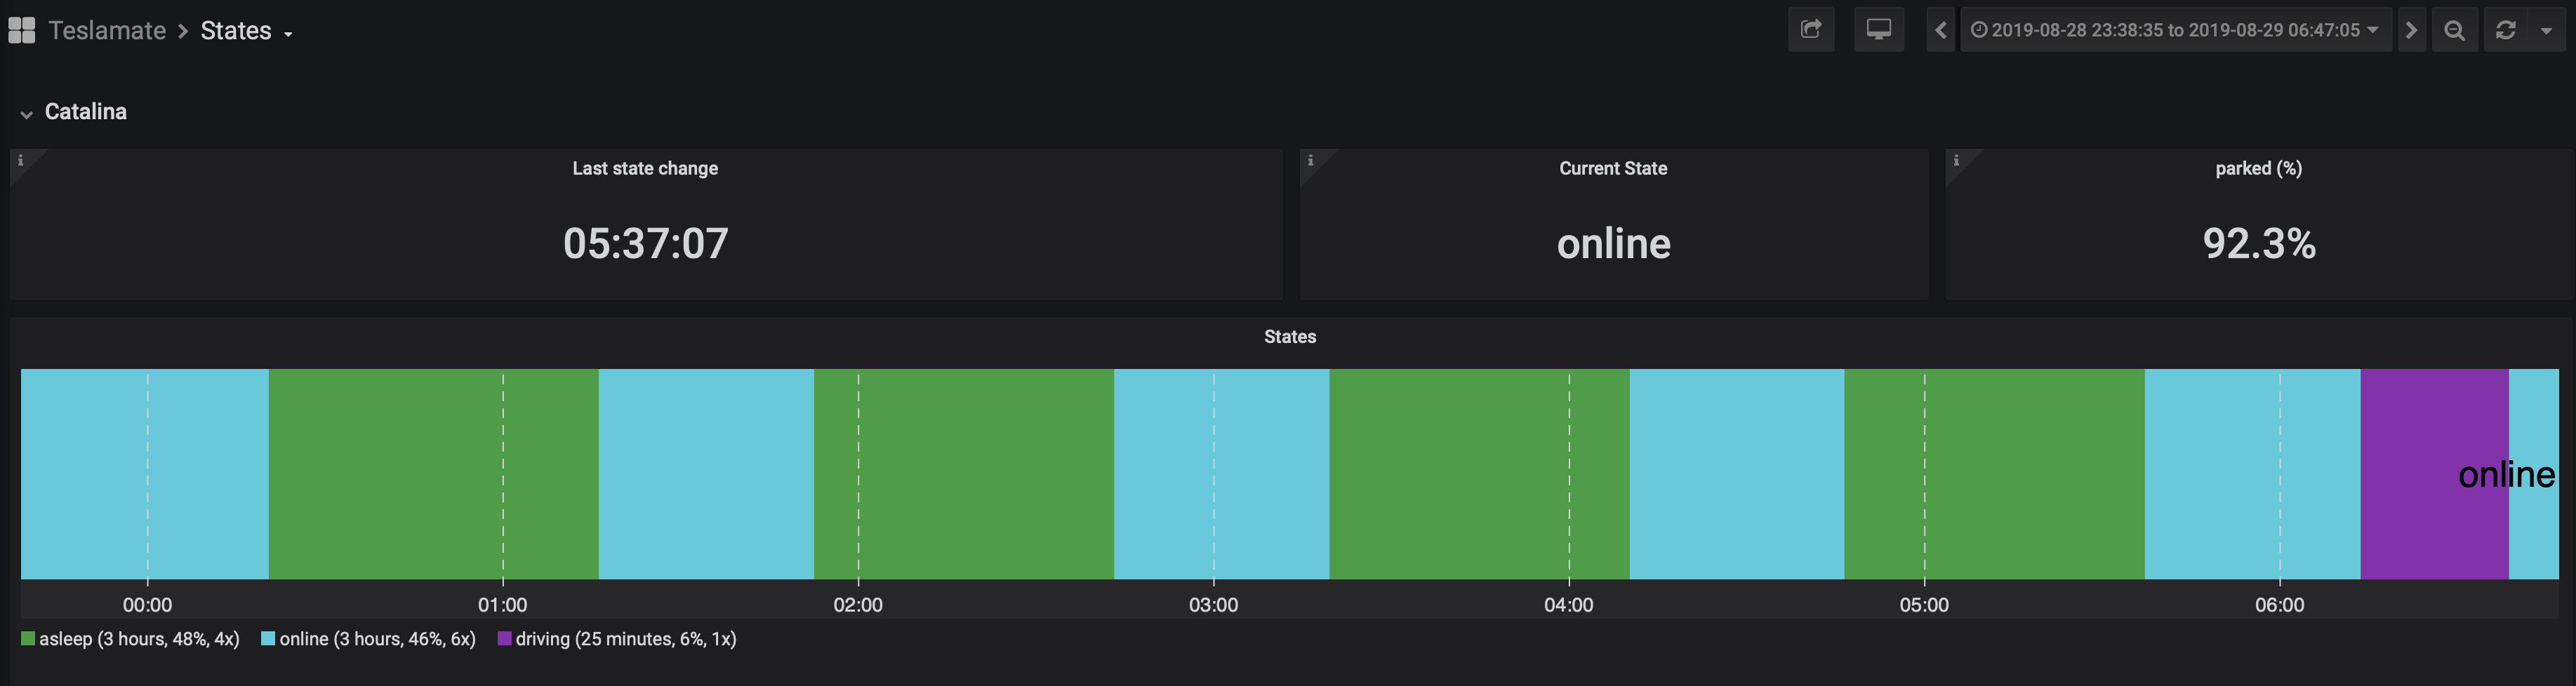
:) Great! Just don't let them run permanently at the same time. It could cause your vehicle to not fall asleep anymore.
btw as I wrote in the other thread, there is now a beta release available
adriankumpf
on 29 Aug 2019
It could cause your vehicle to not fall asleep anymore.
She already has some issues falling asleep. Noticed that with TeslaScope, although I think that was more their polling / configuration. I can at least see that overnight, it went into an asleep state. But only for about 50 minutes or so. Did that three times, with a roughly 50 minute online state in-between each. Screenshot below.
Updating and running that version now.
cwanja
on 29 Aug 2019
Definitely something is going on with the range from the API / car. Still stuck at 999, post three more drives today and an overnight charging session. Plus a hard-reboot. Throws off any of the tables or charts that tracks range (charing session, drives, vampire drain, etc.)
I tried to run a similar command from another comment with no luck.
teslapi:~/Documents/tesla-apiscraper $ curl --request GET --header 'Authorization: Bearer something' 'https://owner-api.teslamotors.com/api/1/vehicles/{id}/vehicle_data'

{"response":null,"error":"not_found","error_description":""}
If it makes a difference, it seems to say that my car has API version 6.
Edit: boy have I learned a lot in 24 hours. Pulled the ID from the original API call and punched it into the linked commented API call. Worked like a champ. Well. After I figured out which ID it is 😅
Edit 2: definitely looks like the ideal battery range is stuck. Wonder if Tesla support would look into this?
"ideal_battery_range":999.0,"
cwanja
on 30 Aug 2019
Do you know your Vehicle ID? If not I can help you get the steps to get this outlined. Was thinking a blog post in any case. If you do, then you need to do something like the following:
(note, I masked out my bearer code, and vehicle ID)
curl -X GET \
https://owner-api.teslamotors.com/api/1/vehicles/1111111111111111111/vehicle_data \
-H 'Accept: /' \
-H 'Accept-Encoding: gzip, deflate' \
-H 'Authorization: bearer aa999x99x9x9x99999x9x9x9x9x9x9x9x9x9x9x9x9x9x9x9x9x9x9x9x9x9x9x9x9\
-H 'Cache-Control: no-cache' \
-H 'Connection: keep-alive' \
-H 'Host: owner-api.teslamotors.com' \
-H 'cache-control: no-cache'
If you are on Windows, I had written a program back in the day which allows you to see this. You can check out more on that here:
http://desigeek.com/blog/amit/2018/08/06/windows-tesla-auth-token-generator/
HTHs.
From: cwanja notifications@github.com
Reply-To: adriankumpf/teslamate reply@reply.github.com
Date: Friday, August 30, 2019 at 11:08 AM
To: adriankumpf/teslamate teslamate@noreply.github.com
Cc: Subscribed subscribed@noreply.github.com
Subject: Re: [adriankumpf/teslamate] Few issues (#125)
Definitely something is going on with the range from the API / car. Still stuck at 999, post three more drives today and an overnight charging session. Throws off any of the tables or charts that tracks range (charing session, drives, vampire drain, etc.)
I tried to run a similar command from another comment with no luck.
teslapi:~/Documents/tesla-apiscraper $ curl --request GET --header 'Authorization: Bearer something' 'https://owner-api.teslamotors.com/api/1/vehicles/{id}/vehicle_data'
{"response":null,"error":"not_found","error_description":""}
If it makes a difference, it seems to say that my car has API version 6.
—
You are receiving this because you are subscribed to this thread.
Reply to this email directly, view it on GitHub, or mute the thread.
 bahree
on 30 Aug 2019
bahree
on 30 Aug 2019
Thanks @bahree - I actually got it working 😄 just had to figure out which ID it was - vehicle ID or the just ID. Ended up getting it working. Trying to chat with Tesla now regarding all of the mismatched data in the API to what my car should be. Really not sure they will be able to help.
cwanja
on 30 Aug 2019
Related issues
 bastrik
·
3Comments
bastrik
·
3Comments
 Try2Fly
·
5Comments
Try2Fly
·
5Comments
 tobiasehlert
·
4Comments
tobiasehlert
·
4Comments
 netkruzer
·
6Comments
netkruzer
·
6Comments
 virtualm2000
·
4Comments
virtualm2000
·
4Comments