Tensorboardx: How to use the function add_graph(model, input_to_model, verbose=False)? (It seems that demo_graph.py is not executable)
At the beginning, I tried to run demo_graph.py, but the result was always

Then I tried to add a main function code:
if __name__ == '__main__':
    exp_name = 'model_' + time.strftime("%y-%m-%d_%H-%M-%S", time.localtime()) + 'resnet'
    w = SummaryWriter('./run' + '/' + exp_name)

    dummy_input = Variable(torch.rand(1, 3, 224, 224))
    model = torchvision.models.resnet18()
    w.add_graph(model, dummy_input)
And started up the tensorboard using the command:
tensorboard --logdir ./run --port 6611
However the result showed in my browser was

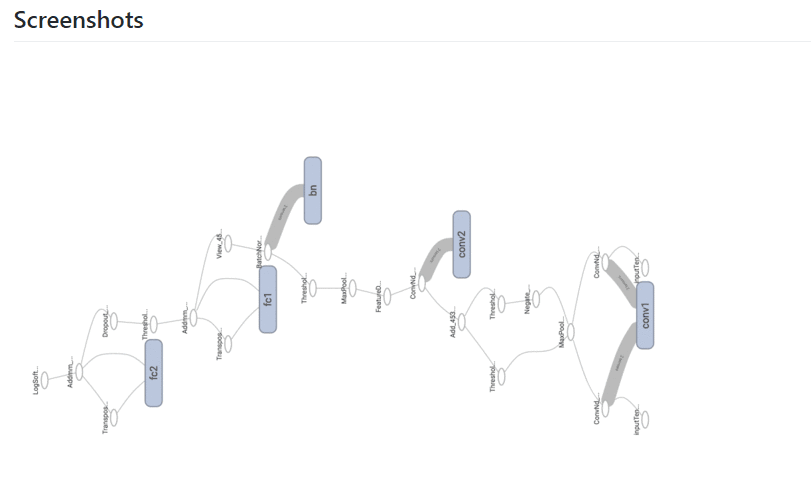
So, I wonder to know the correct way to use the function add_graph to draw the network structure diagram like this:
 MrStrangerYang
All 4 comments
This screenshot is very old.(for pytorch 0.2)
please check #46 for more information. I suggest to use add_graph() along with pytorch 0.4 for best view. (And help me verifying the result lol)
 lanpa
on 9 Jan 2018
lanpa
on 9 Jan 2018
I figured out that tensorboardX must be installed from source in order to use add_graph(), with pytorch > 0.4. Maybe this should be put into readme as well.
 JiamingSuen
on 19 Jan 2018
JiamingSuen
on 19 Jan 2018
@JiamingSuen Thanks, I think it should be mentioned. And FYI, the pip package was updated yesterday.
lanpa
on 19 Jan 2018
@JiamingSuen Thanks for pointing out that this was due to version mismatch. Works after upgrading pytorch to 0.4
 Anubhav7
on 25 Jun 2018
Anubhav7
on 25 Jun 2018
Related issues
 shuxiaobo
·
7Comments
JiamingSuen
·
8Comments
shuxiaobo
·
7Comments
JiamingSuen
·
8Comments
 kmyfoer
·
4Comments
kmyfoer
·
4Comments
 mbenami
·
6Comments
mbenami
·
6Comments
 hrtang
·
4Comments
hrtang
·
4Comments