Telegraf: SQLServer plugin shows wrong latency values
Relevant telegraf.conf:
[[inputs.sqlserver]]
  servers = ["Server=localhost;Port=1433;User Id=usrtelegraf;Password=xxxxxxx;app name=telegraf;log=1;",]
  query_version = 2
System info:
Windows Server 2016
Steps to reproduce:
- Configure telegraf to monitor sqlserver using inputs.sqlserver
- Start telegraf servis
- Go to grafana and add new graph
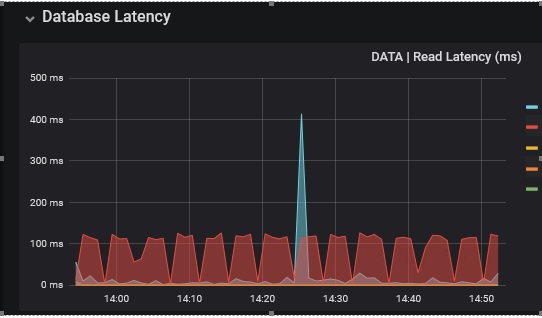
- Add follwing query to see Read latency metrics
SELECT non_negative_derivative(mean("read_latency_ms"), 1s) FROM "sqlserver_database_io" WHERE ("sql_instance" =~ /^$Instance$/ AND "file_type" = 'DATA' AND "database_name" !~ /^(msdb|model|master)/) AND $timeFilter GROUP BY time($__interval), "database_name"
Expected behavior
SQL server shows us avg latency around 3 ms.


Actual behavior:
We see latecy values around 100 ms
Additional info:
Telegraf Version:
Telegraf 1.13.4 (git: HEAD ffabd6b5)
 iatalay
All 4 comments
@denzilribeiro @Trovalo Do you know of anything that could cause this behavior?
 reimda
on 16 Oct 2020
reimda
on 16 Oct 2020
@iatalay, this is the query that Telegraf runs:
SELECT
    'sqlserver_database_io' AS [measurement]
    ,REPLACE(@@SERVERNAME,'\',':') AS [sql_instance]
    ,DB_NAME(vfs.[database_id]) AS [database_name]
    ,COALESCE(mf.[physical_name],'RBPEX') AS [physical_filename]    --RPBEX = Resilient Buffer Pool Extension
    ,COALESCE(mf.[name],'RBPEX') AS [logical_filename]  --RPBEX = Resilient Buffer Pool Extension
    ,mf.[type_desc] AS [file_type]
    ,vfs.[io_stall_read_ms] AS [read_latency_ms]
    ,vfs.[num_of_reads] AS [reads]
    ,vfs.[num_of_bytes_read] AS [read_bytes]
    ,vfs.[io_stall_write_ms] AS [write_latency_ms]
    ,vfs.[num_of_writes] AS [writes]
    ,vfs.[num_of_bytes_written] AS [write_bytes],[volume_mount_point]
    ,vfs.io_stall_queued_read_ms AS [rg_read_stall_ms]
    ,vfs.io_stall_queued_write_ms AS [rg_write_stall_ms]
FROM sys.dm_io_virtual_file_stats(NULL, NULL) AS vfs
INNER JOIN sys.master_files AS mf WITH (NOLOCK)
    ON vfs.[database_id] = mf.[database_id] AND vfs.[file_id] = mf.[file_id]
CROSS APPLY sys.dm_os_volume_stats(vfs.[database_id], vfs.[file_id]) AS vs
No calculation is made and every value is kept as is, so if you want the "Average Latency per Read" you have to calculate it yourself.
This is the query I use
SELECT
     mean("Latency Per Read") AS "Avg Latency Per Read"
FROM (
    SELECT
        non_negative_difference(last("read_latency_ms")) / non_negative_difference(last("reads")) AS "Latency Per Read"
    FROM "$InfluxDB_RetentionPolicy"."sqlserver_database_io"
    WHERE
        ("sql_instance" =~ /^$Var_Sql_Instance$/)
        AND $timeFilter
    GROUP BY
        time($__interval)
        ,"database_name"
        ,"physical_filename"
)
GROUP BY
     time($__interval)
    ,"database_name"
Note that I compute the "Latency Per Read" for every single physical file (which is the minimum data granularity), and then aggregate it (avg) per database
 Trovalo
on 19 Oct 2020
Trovalo
on 19 Oct 2020
Here is what I chart out - example is for write latency by Database/File as per second values ( This is for Azure SQL DB).
SELECT non_negative_derivative("write_latency_ms", 1s) / non_negative_derivative("writes", 1s) FROM "sqlserver_database_io" WHERE ("sql_instance" =~ /^$InstanceName$/ AND ("database_name" =~ /^$DatabaseName$/ )) AND $timeFilter GROUP BY "database_name",database_id::string, "logical_filename"
 denzilribeiro
on 19 Oct 2020
denzilribeiro
on 19 Oct 2020
This makes sense for us :) The query helped us to understand the situation.
Thanks for your help.
iatalay
on 20 Oct 2020
Related issues
 Xiol
·
3Comments
Xiol
·
3Comments
 nsteinmetz
·
3Comments
nsteinmetz
·
3Comments
 Bregor
·
3Comments
Bregor
·
3Comments
 robert-gomes
·
3Comments
robert-gomes
·
3Comments
 m4ce
·
3Comments
m4ce
·
3Comments
Most helpful comment
Here is what I chart out - example is for write latency by Database/File as per second values ( This is for Azure SQL DB).
SELECT non_negative_derivative("write_latency_ms", 1s) / non_negative_derivative("writes", 1s) FROM "sqlserver_database_io" WHERE ("sql_instance" =~ /^$InstanceName$/ AND ("database_name" =~ /^$DatabaseName$/ )) AND $timeFilter GROUP BY "database_name",database_id::string, "logical_filename"