Telegraf: clustername tag value missing after upgrading to 1.15.1
Relevant telegraf.conf:
# Host & VM stats
[[inputs.vsphere]]
   interval = "60s"
   ## List of vCenter URLs to be monitored. These three lines must be uncommented
   ## and edited for the plugin to work.
   vcenters = [ "https://FQDN/sdk" ]
   username = "username"
   password = "hunter2"

   force_discover_on_init = true

   ## VMs
   ## Typical VM metrics (if omitted or empty, all metrics are collected)
   vm_metric_include = [
     "cpu.demand.average",
     "cpu.idle.summation",
     "cpu.latency.average",
     "cpu.readiness.average",
     "cpu.ready.summation",
     "cpu.run.summation",
     "cpu.usage.average",
     "cpu.usagemhz.average",
     "cpu.used.summation",
     "cpu.wait.summation",
     "mem.active.average",
     "mem.granted.average",
     "mem.latency.average",
     "mem.swapin.average",
     "mem.swapinRate.average",
     "mem.swapout.average",
     "mem.swapoutRate.average",
     "mem.usage.average",
     "mem.vmmemctl.average",
     "net.bytesRx.average",
     "net.bytesTx.average",
     "net.droppedRx.summation",
     "net.droppedTx.summation",
     "net.usage.average",
     "power.power.average",
     "virtualDisk.numberReadAveraged.average",
     "virtualDisk.numberWriteAveraged.average",
     "virtualDisk.read.average",
     "virtualDisk.readOIO.latest",
     "virtualDisk.throughput.usage.average",
     "virtualDisk.totalReadLatency.average",
     "virtualDisk.totalWriteLatency.average",
     "virtualDisk.write.average",
     "virtualDisk.writeOIO.latest",
     "sys.uptime.latest",
   ]
   # vm_metric_exclude = [] ## Nothing is excluded by default
   vm_instances = true ## true by default

   ## Hosts
   ## Typical host metrics (if omitted or empty, all metrics are collected)
   host_metric_include = [
     "cpu.coreUtilization.average",
     "cpu.costop.summation",
     "cpu.demand.average",
     "cpu.idle.summation",
     "cpu.latency.average",
     "cpu.readiness.average",
     "cpu.ready.summation",
     "cpu.swapwait.summation",
     "cpu.usage.average",
     "cpu.usagemhz.average",
     "cpu.used.summation",
     "cpu.utilization.average",
     "cpu.wait.summation",
     "disk.deviceReadLatency.average",
     "disk.deviceWriteLatency.average",
     "disk.kernelReadLatency.average",
     "disk.kernelWriteLatency.average",
     "disk.numberReadAveraged.average",
     "disk.numberWriteAveraged.average",
     "disk.read.average",
     "disk.totalReadLatency.average",
     "disk.totalWriteLatency.average",
     "disk.write.average",
     "mem.active.average",
     "mem.latency.average",
     "mem.state.latest",
     "mem.swapin.average",
     "mem.swapinRate.average",
     "mem.swapout.average",
     "mem.swapoutRate.average",
     "mem.totalCapacity.average",
     "mem.usage.average",
     "mem.vmmemctl.average",
     "net.bytesRx.average",
     "net.bytesTx.average",
     "net.droppedRx.summation",
     "net.droppedTx.summation",
     "net.errorsRx.summation",
     "net.errorsTx.summation",
     "net.usage.average",
     "power.power.average",
     "storageAdapter.numberReadAveraged.average",
     "storageAdapter.numberWriteAveraged.average",
     "storageAdapter.read.average",
     "storageAdapter.write.average",
     "sys.uptime.latest",
   ]
   # host_metric_exclude = [] ## Nothing excluded by default
   host_instances = true ## true by default

   ## Clusters
   # cluster_metric_include = [] ## if omitted or empty, all metrics are collected
   cluster_metric_exclude = ["*"] ## Nothing excluded by default
   # cluster_instances = true ## true by default

   ## Datastores
   # datastore_metric_include = [] ## if omitted or empty, all metrics are collected
   datastore_metric_exclude = ["*"] ## Nothing excluded by default
   # datastore_instances = true ## false by default for Datastores only

   ## Datacenters
   # datacenter_metric_include = [] ## if omitted or empty, all metrics are collected
   datacenter_metric_exclude = ["*"] ## Datacenters are not collected by default.
   # datacenter_instances = true ## false by default for Datastores only

   ## Plugin Settings
   ## separator character to use for measurement and field names (default: "_")
   # separator = "_"

   ## number of objects to retreive per query for realtime resources (vms and hosts)
   ## set to 64 for vCenter 5.5 and 6.0 (default: 256)
   # max_query_objects = 256

   ## number of metrics to retreive per query for non-realtime resources (clusters and datastores)
   ## set to 64 for vCenter 5.5 and 6.0 (default: 256)
   # max_query_metrics = 256

   ## number of go routines to use for collection and discovery of objects and metrics
   # collect_concurrency = 1
   # discover_concurrency = 1

   ## whether or not to force discovery of new objects on initial gather call before collecting metrics
   ## when true for large environments this may cause errors for time elapsed while collecting metrics
   ## when false (default) the first collection cycle may result in no or limited metrics while objects are discovered
   # force_discover_on_init = false

   ## the interval before (re)discovering objects subject to metrics collection (default: 300s)
   # object_discovery_interval = "300s"

   ## timeout applies to any of the api request made to vcenter
   timeout = "100s"

   ## Optional SSL Config
   # ssl_ca = "/path/to/cafile"
   # ssl_cert = "/path/to/certfile"
   # ssl_key = "/path/to/keyfile"
   ## Use SSL but skip chain & host verification
   insecure_skip_verify = true

   use_int_samples = false

# Datastores
[[inputs.vsphere]]
   interval = "300s"
   ## List of vCenter URLs to be monitored. These three lines must be uncommented
   ## and edited for the plugin to work.
   vcenters = [ "https://FQDN/sdk" ]
   username = "username"
   password = "hunter2"

   force_discover_on_init = true

   ## VMs
   vm_metric_exclude = ["*"] ## Nothing is excluded by default
   # vm_instances = true ## true by default

   ## Hosts
   host_metric_exclude = ["*"] ## Nothing excluded by default
   # host_instances = true ## true by default

   ## Clusters
   # cluster_metric_include = [] ## if omitted or empty, all metrics are collected
   # cluster_metric_exclude = ["*"] ## Nothing excluded by default
   cluster_instances = true ## true by default

   ## Datastores
   # datastore_metric_include = [] ## if omitted or empty, all metrics are collected
   # datastore_metric_exclude = [] ## Nothing excluded by default
   datastore_instances = true ## false by default for Datastores only

   ## Datacenters
   # datacenter_metric_include = [] ## if omitted or empty, all metrics are collected
   # datacenter_metric_exclude = [ "*" ] ## Datacenters are not collected by default.
   datacenter_instances = true ## false by default for Datastores only

   ## Plugin Settings
   ## separator character to use for measurement and field names (default: "_")
   # separator = "_"

   ## number of objects to retreive per query for realtime resources (vms and hosts)
   ## set to 64 for vCenter 5.5 and 6.0 (default: 256)
   # max_query_objects = 256

   ## number of metrics to retreive per query for non-realtime resources (clusters and datastores)
   ## set to 64 for vCenter 5.5 and 6.0 (default: 256)
   # max_query_metrics = 256

   ## number of go routines to use for collection and discovery of objects and metrics
   # collect_concurrency = 1
   # discover_concurrency = 1

   ## whether or not to force discovery of new objects on initial gather call before collecting metrics
   ## when true for large environments this may cause errors for time elapsed while collecting metrics
   ## when false (default) the first collection cycle may result in no or limited metrics while objects are discovered
   # force_discover_on_init = false

   ## the interval before (re)discovering objects subject to metrics collection (default: 300s)
   # object_discovery_interval = "300s"

   ## timeout applies to any of the api request made to vcenter
   timeout = "240s"

   ## Optional SSL Config
   # ssl_ca = "/path/to/cafile"
   # ssl_cert = "/path/to/certfile"
   # ssl_key = "/path/to/keyfile"
   ## Use SSL but skip chain & host verification
   insecure_skip_verify = true

   use_int_samples = false
System info:
Telegraf: 1.15.1
OS: Debian 10.4 (Buster)
vCenter: 6.7
Steps to reproduce:
- Configure the vSphere input
- Wait for metrics to be fetched
Expected behavior:
Various datapoints have a tag called "clustername", this tag should contain the (human readable) name of the cluster where the VM for example resides in.
Actual behavior:
The value in the "clustername" tag is gone.
Additional info:
Query output:
> SELECT * FROM "vsphere_vm_cpu" WHERE ("vmname" =~ /^vmhostname$/) AND time >= now() - 2h fill(null)
name: vsphere_vm_cpu
time                clustername             cpu            dcname demand_average    esxhostname           guest      guesthostname host                   idle_summation     latency_average    moid      readiness_average  ready_summation    run_summation      source                 usage_average     usagemhz_average   used_summation     uuid                                 vcenter                  vmname                 wait_summation
----                -----------             ---            ------ --------------    -----------           -----      ------------- ----                   --------------     ---------------    ----      -----------------  ---------------    -------------      ------                 -------------     ----------------   --------------     ----                                 -------                  ------                 --------------

BEFORE

1595485260000000000 cluster-name 0              dcname                    esxi-host OS vmname     vmhostname 9667                                  vm-157768 1.65               331.5              9945.5             vmhostname                   1633.5             10893              421c5eb8-fd6f-fb7d-76d9-cff967e93801 vcenter-hostname vmhostname 9715
1595485260000000000 cluster-name 1              dcname                    esxi-host OS vmname     vmhostname 9853.5                                vm-157768 1.595              319.5              9807               vmhostname                   1611               10745.5            421c5eb8-fd6f-fb7d-76d9-cff967e93801 vcenter-hostname vmhostname 9872

AFTER

1595487660000000000                         0              dcname                    esxi-host OS vmname     vmhostname 8826.5                                vm-157768 1.78               356                9699.5             vmhostname                   1593               10650.5            421c5eb8-fd6f-fb7d-76d9-cff967e93801 vcenter-hostname vmhostname 9723
1595487660000000000                         2              dcname                    esxi-host OS vmname     vmhostname 8845.5                                vm-157768 1.96               395                9376               vmhostname                   1546               10249.5            421c5eb8-fd6f-fb7d-76d9-cff967e93801 vcenter-hostname vmhostname 10037.5
The 'before' version is v1.14.5.
 ybinnenwegin2ip
All 29 comments
What was the last version you know it was working in?
 ssoroka
on 23 Jul 2020
ssoroka
on 23 Jul 2020
@ssoroka apologies I thought I had put that in the post. That would be the previous stable version, v1.14.5
ybinnenwegin2ip
on 23 Jul 2020
Looks like d0db0e8f0a67cf071c0a2a62a8b4220e73b3e602 is the biggest change that that slice. @prydin, do you have any thoughts on this?
ssoroka
on 23 Jul 2020
Hello,
attaching debug test output from 1.14.5 and 1.15.0. All cluster related objects are missing.
...
2020-08-05T19:38:40Z D! [inputs.vsphere] Collecting metrics for 0 objects of type cluster for 172.28.20.32
2020-08-05T19:38:40Z D! [inputs.vsphere] Latest sample for cluster set to 0001-01-01 00:00:00 +0000 UTC
2020-08-05T19:38:40Z D! [inputs.vsphere] Submitting job for vm: 47 objects
2020-08-05T19:38:40Z D! [inputs.vsphere] Query for vm has 47 QuerySpecs
2020-08-05T19:38:41Z D! [inputs.vsphere] Interval estimated to 1m0s
2020-08-05T19:38:41Z D! [inputs.vsphere] Collecting metrics for 0 objects of type cluster for 172.28.20.32
2020-08-05T19:38:41Z D! [inputs.vsphere] Latest sample for cluster set to 0001-01-01 00:00:00 +0000 UTC
2020-08-05T19:38:41Z D! [inputs.vsphere] Query for datastore returned metrics for 10 objects
...
 zejdlikt
on 5 Aug 2020
zejdlikt
on 5 Aug 2020
It'd be great if someone could contribute a failing test here that works on the 1.14.5 and fails in 1.15.0. The test suite for this plugin is on the weak side considering how much functionality it's covering.
ssoroka
on 18 Aug 2020
@prydin, do you think you could help us with the following. Currently don't have any vSphere systems to test this.
It'd be great if someone could contribute a failing test here that works on the 1.14.5 and fails in 1.15.0. The test suite for this plugin is on the weak side considering how much functionality it's covering.
 sjwang90
on 18 Aug 2020
sjwang90
on 18 Aug 2020
I will try to reproduce this error. I will deploy a vSphere and vCenter 6.7. Standby
 xe-nvdk
on 18 Aug 2020
xe-nvdk
on 18 Aug 2020
Hello, I have created the VMware Dashboards and I can confirm that after the latest update, I was on 1.14.3 without any issues, the cluster metrics are not being collected as they were. I have received already so many emails, comments, and tweets around these issues. What exactly do you want me to test with this version?
 jorgedlcruz
on 18 Aug 2020
jorgedlcruz
on 18 Aug 2020
Hi guys, any news? Any news around the rollback, or some fix?
jorgedlcruz
on 21 Aug 2020
I'm hoping to get to this today or during the weekend.
 prydin
on 21 Aug 2020
prydin
on 21 Aug 2020
I think I'm running into this. I had to downgrade to 1.14.4 to get cluster metrics. We're running against vSphere 6.7.
Here's a run using 1.15.1
2020-08-21T19:23:32Z I! Starting Telegraf 1.15.1
2020-08-21T19:23:32Z D! [agent] Initializing plugins
2020-08-21T19:23:32Z D! [agent] Starting service inputs
2020-08-21T19:23:32Z I! [inputs.vsphere] Starting plugin
2020-08-21T19:23:32Z D! [inputs.vsphere] Creating client: vcenter
2020-08-21T19:23:32Z D! [inputs.vsphere] Option query for maxQueryMetrics failed. Using default
2020-08-21T19:23:32Z D! [inputs.vsphere] vCenter version is: 6.7.0
2020-08-21T19:23:32Z D! [inputs.vsphere] vCenter says max_query_metrics should be 256
2020-08-21T19:23:32Z D! [inputs.vsphere] Running initial discovery
2020-08-21T19:23:32Z D! [inputs.vsphere] Discover new objects for vcenter
2020-08-21T19:23:32Z D! [inputs.vsphere] Discovering resources for cluster
2020-08-21T19:23:32Z D! [inputs.vsphere] Discovering resources for host
2020-08-21T19:23:32Z D! [inputs.vsphere] Find(HostSystem, /*/host/**) returned 8 objects
2020-08-21T19:23:32Z D! [inputs.vsphere] Discovering resources for vm
2020-08-21T19:23:32Z D! [inputs.vsphere] Discovering resources for datastore
2020-08-21T19:23:32Z D! [inputs.vsphere] Find(Datastore, /*/datastore/**) returned 11 objects
2020-08-21T19:23:32Z D! [inputs.vsphere] Discovering resources for datacenter
2020-08-21T19:23:32Z D! [inputs.vsphere] Find(Datacenter, /*) returned 1 objects
2020-08-21T19:23:32Z D! [inputs.vsphere] No parent found for Folder:group-d1 (ascending from Folder:group-d1)
2020-08-21T19:23:32Z D! [inputs.vsphere] Interval estimated to 1m0s
2020-08-21T19:23:32Z D! [inputs.vsphere] Collecting metrics for 0 objects of type cluster for vcenter
2020-08-21T19:23:32Z D! [inputs.vsphere] Latest sample for cluster set to 0001-01-01 00:00:00 +0000 UTC
2020-08-21T19:23:32Z D! [inputs.vsphere] purged timestamp cache. 0 deleted with 0 remaining
2020-08-21T19:23:32Z D! [agent] Stopping service inputs
2020-08-21T19:23:32Z I! [inputs.vsphere] Stopping plugin
2020-08-21T19:23:32Z D! [inputs.vsphere] Waiting for endpoint "vcenter" to finish
2020-08-21T19:23:32Z D! [inputs.vsphere] Exiting discovery goroutine for vcenter
2020-08-21T19:23:32Z D! [agent] Input channel closed
2020-08-21T19:23:32Z D! [agent] Stopped Successfully
Here's 1.14.4
2020-08-21T19:51:46Z I! Starting Telegraf 1.14.4
2020-08-21T19:51:46Z D! [agent] Initializing plugins
2020-08-21T19:51:46Z D! [agent] Starting service inputs
2020-08-21T19:51:46Z I! [inputs.vsphere] Starting plugin
2020-08-21T19:51:46Z D! [inputs.vsphere] Creating client: vcenter
2020-08-21T19:51:46Z D! [inputs.vsphere] Option query for maxQueryMetrics failed. Using default
2020-08-21T19:51:46Z D! [inputs.vsphere] vCenter version is: 6.7.0
2020-08-21T19:51:46Z D! [inputs.vsphere] vCenter says max_query_metrics should be 256
2020-08-21T19:51:46Z D! [inputs.vsphere] Running initial discovery
2020-08-21T19:51:46Z D! [inputs.vsphere] Discover new objects for vcenter
2020-08-21T19:51:46Z D! [inputs.vsphere] Discovering resources for datacenter
2020-08-21T19:51:47Z D! [inputs.vsphere] Find(Datacenter, /*) returned 1 objects
2020-08-21T19:51:47Z D! [inputs.vsphere] No parent found for Folder:group-d1 (ascending from Folder:group-d1)
2020-08-21T19:51:47Z D! [inputs.vsphere] Discovering resources for cluster
2020-08-21T19:51:47Z D! [inputs.vsphere] Find(ClusterComputeResource, /*/host/**) returned 2 objects
2020-08-21T19:51:47Z D! [inputs.vsphere] Found 31 metrics for VFP_EVC Cluster
2020-08-21T19:51:47Z D! [inputs.vsphere] Found 31 metrics for VFP2
2020-08-21T19:51:47Z D! [inputs.vsphere] Discovering resources for host
2020-08-21T19:51:47Z D! [inputs.vsphere] Find(HostSystem, /*/host/**) returned 8 objects
2020-08-21T19:51:47Z D! [inputs.vsphere] Discovering resources for vm
2020-08-21T19:51:47Z D! [inputs.vsphere] Discovering resources for datastore
2020-08-21T19:51:47Z D! [inputs.vsphere] Find(Datastore, /*/datastore/**) returned 11 objects
2020-08-21T19:51:47Z D! [inputs.vsphere] Interval estimated to 1m0s
2020-08-21T19:51:47Z D! [inputs.vsphere] Collecting metrics for 2 objects of type cluster for vcenter
2020-08-21T19:51:47Z D! [inputs.vsphere] Queueing query: 1 objects, 10 metrics (21 remaining) of type cluster for vcenter. Processed objects: 1. Total objects 2
2020-08-21T19:51:47Z D! [inputs.vsphere] Queueing query: 1 objects, 10 metrics (11 remaining) of type cluster for vcenter. Processed objects: 1. Total objects 2
2020-08-21T19:51:47Z D! [inputs.vsphere] Queueing query: 1 objects, 10 metrics (1 remaining) of type cluster for vcenter. Processed objects: 1. Total objects 2
2020-08-21T19:51:47Z D! [inputs.vsphere] Queueing query: 2 objects, 10 metrics (22 remaining) of type cluster for vcenter. Processed objects: 2. Total objects 2
2020-08-21T19:51:47Z D! [inputs.vsphere] Queueing query: 1 objects, 10 metrics (12 remaining) of type cluster for vcenter. Processed objects: 2. Total objects 2
2020-08-21T19:51:47Z D! [inputs.vsphere] Queueing query: 1 objects, 10 metrics (2 remaining) of type cluster for vcenter. Processed objects: 2. Total objects 2
2020-08-21T19:51:47Z D! [inputs.vsphere] Query for cluster has 1 QuerySpecs
2020-08-21T19:51:47Z D! [inputs.vsphere] Query for cluster has 1 QuerySpecs
2020-08-21T19:51:47Z D! [inputs.vsphere] Query for cluster has 2 QuerySpecs
2020-08-21T19:51:47Z D! [inputs.vsphere] Queuing query: 1 objects, 2 metrics (0 remaining) of type cluster for vcenter. Total objects 2 (final chunk)
2020-08-21T19:51:47Z D! [inputs.vsphere] Query for cluster has 1 QuerySpecs
2020-08-21T19:51:47Z D! [inputs.vsphere] Query for cluster has 1 QuerySpecs
2020-08-21T19:51:47Z D! [inputs.vsphere] Query for cluster returned metrics for 1 objects
... <metrics here> ...
2020-08-21T19:51:47Z D! [inputs.vsphere] CollectChunk for cluster returned 30 metrics
2020-08-21T19:51:47Z D! [inputs.vsphere] Latest sample for cluster set to 2020-08-21 19:50:00 +0000 UTC
2020-08-21T19:51:47Z D! [inputs.vsphere] purged timestamp cache. 0 deleted with 2 remaining
2020-08-21T19:51:47Z D! [agent] Waiting for service inputs
2020-08-21T19:51:47Z D! [agent] Stopping service inputs
2020-08-21T19:51:47Z I! [inputs.vsphere] Stopping plugin
2020-08-21T19:51:47Z D! [inputs.vsphere] Waiting for endpoint "vcenter" to finish
2020-08-21T19:51:47Z D! [inputs.vsphere] Exiting discovery goroutine for vcenter
Here's the config used for both versions:
[[inputs.vsphere]]
collect_concurrency = 5
discover_concurrency = 5
force_discover_on_init = true
datacenter_metric_exclude = ["*"]
datastore_metric_exclude = ["*"]
host_metric_exclude = ["*"]
insecure_skip_verify = true
interval = "300s"
max_query_metrics = 256
password = "password"
timeout = "280s"
username = "username"
vcenters = ["https://vcenter/sdk"]
vm_metric_exclude = ["*"]
[inputs.vsphere.tags]
influxdb_database = "vmware"
 hanej
on 21 Aug 2020
hanej
on 21 Aug 2020
Same problem with 1.15.2, i have re-install 1.14.5 and work
 netbix
on 23 Aug 2020
netbix
on 23 Aug 2020
I found and fixed the bug. I would love some help testing it. The pre-release of the fix can be found here: https://github.com/wavefrontHQ/telegraf/releases/tag/1.15.2-clusterfix
It would be awesome if someone could run it in their environment. My preliminary testing shows that it works well.
prydin
on 24 Aug 2020
I found and fixed the bug. I would love some help testing it. The pre-release of the fix can be found here: https://github.com/wavefrontHQ/telegraf/releases/tag/1.15.2-clusterfix
It would be awesome if someone could run it in their environment. My preliminary testing shows that it works well.
Thanks a lot for your build! I just installed it and the first two datapoints with clustername tags filled out are visible in Grafana now!
I'll let it run and will post an update tomorrow!
Thanks again!
Edit for other people wanting to test:
cd /usr/local/bin
wget https://github.com/wavefrontHQ/telegraf/releases/download/1.15.2-clusterfix/telegraf-linux
chmod +x telegraf-linux
systemctl edit telegraf.service
And paste:
[Service]
ExecStart=
ExecStart=/usr/local/bin/telegraf-linux -config /etc/telegraf/telegraf.conf -config-directory /etc/telegraf/telegraf.d $TELEGRAF_OPTS
Then systemctl restart telegraf.service, should work!
When you want to roll back simply run systemctl edit telegraf.service, remove everything and restart the service again.
ybinnenwegin2ip
on 24 Aug 2020
I'm testing the windows version and it's working, I'll update you tomorrow.
I noticed the size of the executable, is it normal to be heavier?

netbix
on 24 Aug 2020
Influx is probably stripping symbols etc. when they're building the actual production build. I haven't had a chance to look into exactly what they do, but I think it's safe to say that the increase in size is just an effect of this not being an "official" build.
prydin
on 24 Aug 2020
I checked and yes, the official build doesn't include symbol tables and does therefore have a much smaller binary. If this is an issue, I can build a binary without symbols.
prydin
on 25 Aug 2020
I found and fixed the bug. I would love some help testing it. The pre-release of the fix can be found here: https://github.com/wavefrontHQ/telegraf/releases/tag/1.15.2-clusterfix
It would be awesome if someone could run it in their environment. My preliminary testing shows that it works well.Thanks a lot for your build! I just installed it and the first two datapoints with clustername tags filled out are visible in Grafana now!
I'll let it run and will post an update tomorrow!
Thanks again!
Edit for other people wanting to test:
The build still seems to be running fine here (for ~12 hours), metrics from vcenter are still coming in, nothing else seems broken (thusfar). :)
ybinnenwegin2ip
on 25 Aug 2020
I also confirm that everything works!
For the size of the executable it was a curiosity, not a problem
Thank you
netbix
on 25 Aug 2020
Works for me too! Thank you
hanej
on 26 Aug 2020
I had the same problem even with the 1.16 build and going back to this one adds the cluster info. Is this not included in any offical releases yet?
 somersbd
on 27 Aug 2020
somersbd
on 27 Aug 2020
PR #7878 was merged today and will be in the next patch release - 1.15.3. We're seeing if it can be released this week, if not by next Monday. Until then, feel free to use the nightly builds
sjwang90
on 27 Aug 2020
OK thanks for the reply but you might have missed my comment. I tried the current nightly build for telegraf-nightly.x86_64 and it does not output cluster stats. Thanks and I'll look for the 1.15.3 release.
somersbd
on 27 Aug 2020
@somersbd Just to clarify, my latest PR addresses missing clustername tags on VMs and hosts, not missing cluster metrics. If you are experiencing the latter, I suggest you file a separate issue.
prydin
on 27 Aug 2020
I see this is closed but yet hoping someone might comment: What is the quickest, single shot means of determing if cluster metrics collection is working?
 kkruzich
on 13 Jan 2021
kkruzich
on 13 Jan 2021
If you have enabled telegraf logging, you will quickly see if it is collecting metrics, give it some time, but eventually, you will clearly see the cluster metrics. If not, on chronograf, or grafana explorer you can explore as well.
jorgedlcruz
on 13 Jan 2021
If you have enabled telegraf logging, you will quickly see if it is collecting metrics, give it some time, but eventually, you will clearly see the cluster metrics. If not, on chronograf, or grafana explorer you can explore as well.
But more specifically, and as efficiently as possible how to determine if cluster metrics collection is working? I'm aware of logging and querying the db --but what would most quickly tell me if I'm getting cluster metrics?
kkruzich
on 13 Jan 2021
Sorry, I can not think of any simple way other than looking at telegraf log first, you will see something like this, bear the cluster giving you metrics:
2021-01-13T00:29:01Z D! [inputs.vsphere] Query for cluster returned metrics for 3 objects
2021-01-13T00:29:01Z D! [inputs.vsphere] CollectChunk for cluster returned 18 metrics
2021-01-13T00:29:01Z D! [inputs.vsphere] CollectChunk for cluster returned 18 metrics
2021-01-13T00:29:01Z D! [inputs.vsphere] Query for cluster has 1 QuerySpecs
2021-01-13T00:29:01Z D! [inputs.vsphere] Query for cluster returned metrics for 1 objects
2021-01-13T00:29:01Z D! [inputs.vsphere] CollectChunk for cluster returned 18 metrics
2021-01-13T00:29:01Z D! [inputs.vsphere] CollectChunk for cluster returned 18 metrics
2021-01-13T00:29:01Z D! [inputs.vsphere] Query for cluster has 1 QuerySpecs
2021-01-13T00:29:01Z D! [inputs.vsphere] Query for datacenter returned metrics for 1 objects
2021-01-13T00:29:01Z D! [inputs.vsphere] CollectChunk for datacenter returned 60 metrics
2021-01-13T00:29:01Z D! [inputs.vsphere] CollectChunk for datacenter returned 60 metrics
2021-01-13T00:29:01Z D! [inputs.vsphere] Latest sample for datacenter set to 2021-01-13 00:25:00 +0000 UTC
2021-01-13T00:29:01Z D! [inputs.vsphere] Query for cluster returned metrics for 1 objects
2021-01-13T00:29:01Z D! [inputs.vsphere] CollectChunk for cluster returned 30 metrics
2021-01-13T00:29:01Z D! [inputs.vsphere] CollectChunk for cluster returned 30 metrics
2021-01-13T00:29:01Z D! [inputs.vsphere] Query for cluster has 1 QuerySpecs
2021-01-13T00:29:01Z D! [inputs.vsphere] Query for cluster returned metrics for 1 objects
2021-01-13T00:29:01Z D! [inputs.vsphere] CollectChunk for cluster returned 21 metrics
2021-01-13T00:29:01Z D! [inputs.vsphere] CollectChunk for cluster returned 21 metrics
And then suddenly going to Grafana to check something from the cluster, like this
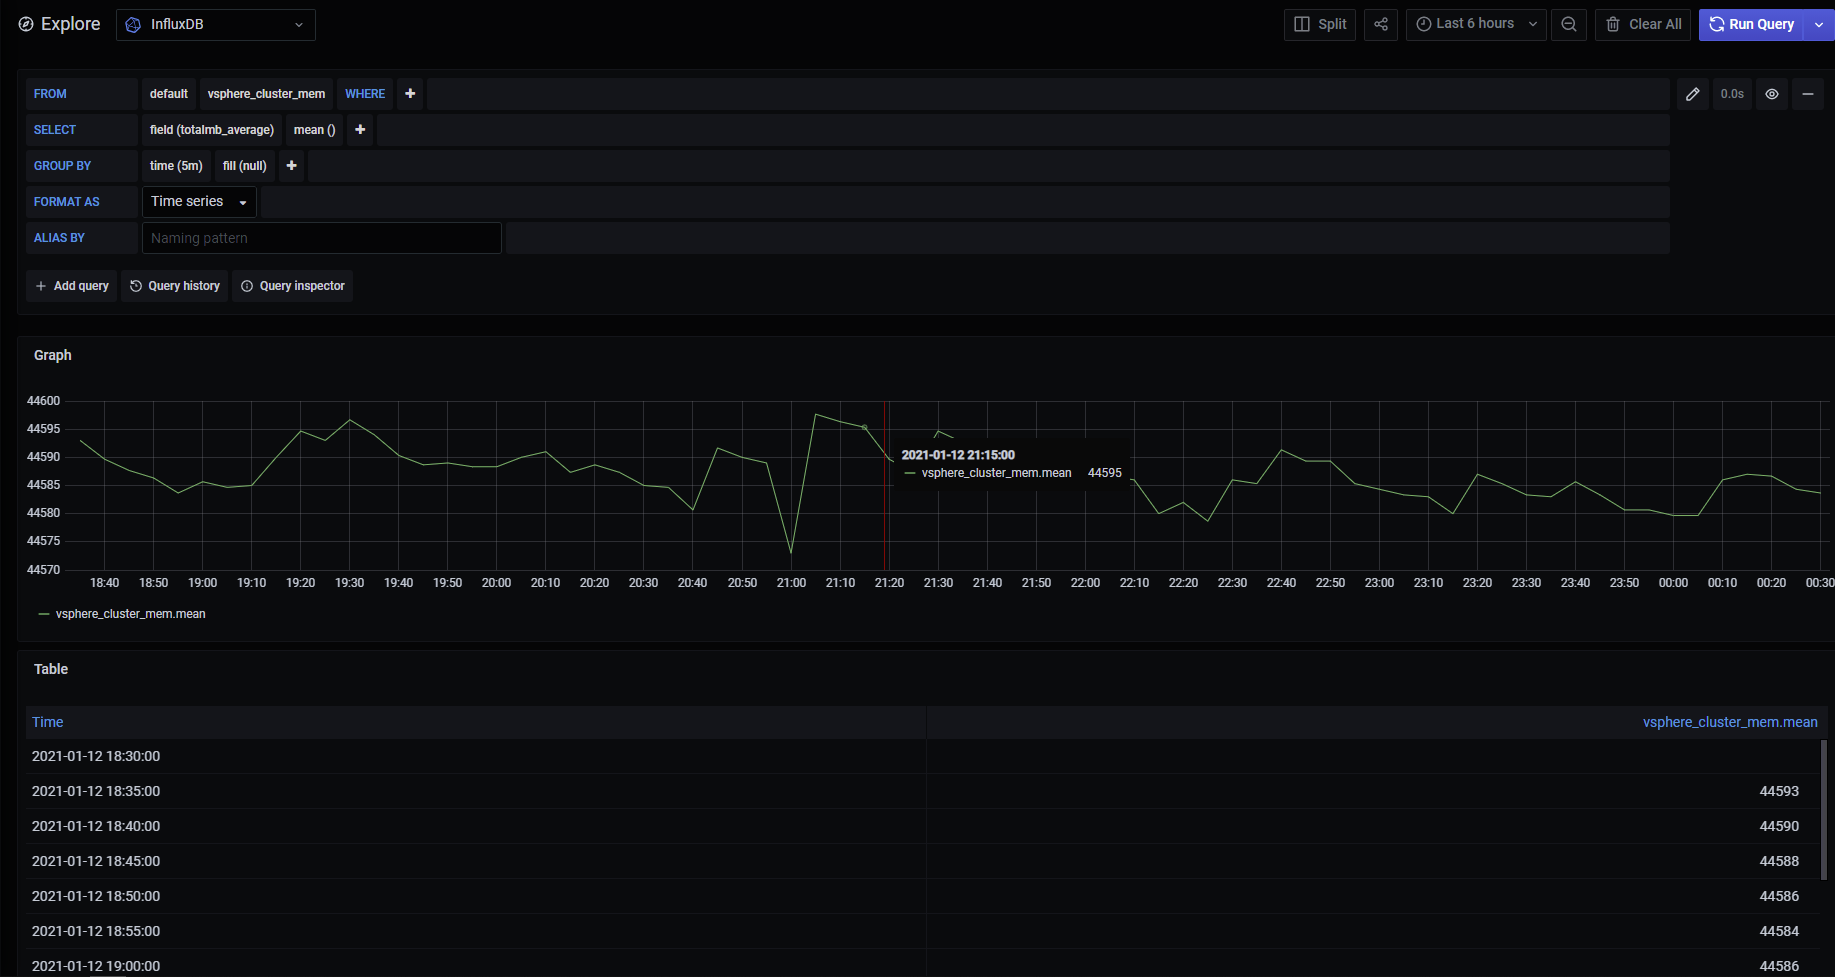
jorgedlcruz
on 13 Jan 2021
Thanks for the comments @jorgedlcruz. After extensive testing with configurations, etc. I think I can conclude, like you've shown above, that the log entry CollectChunk for cluster is accurate evidence that cluster metrics are being collected. Thank you!
kkruzich
on 14 Jan 2021
Related issues
 robert-gomes
·
3Comments
robert-gomes
·
3Comments
 m4ce
·
3Comments
m4ce
·
3Comments
 yn1v
·
3Comments
yn1v
·
3Comments
 fahimeh2010
·
3Comments
fahimeh2010
·
3Comments
 Isonami
·
3Comments
Isonami
·
3Comments
Most helpful comment
I'm hoping to get to this today or during the weekend.