Telegraf: CloudWatch Input: Use GetMetricData vs. GetMetricStatistics API
Feature Request
Would it be possible to use GetMetricData vs. GetMetricStatistics calls for CloudWatch input?
GetMetricData is more efficient vs. GetMetricStatistics and is recommended by AWS. Switching calls will save money and allow large namespaces to be consumed more efficiently and timely.
From AWS support:
The Service Team found that in the third party tool that was provided, the Go program is making GetMetricStatistics API calls instead of GetMetricData. They recommend using GetMetricData since it's always efficient and it's the recommended solution for metric retrieval over GetMetricStatistics. GetMetricData is also more cost effective. You can ask for more data points for a single metric by using GetMetricData rather than by using GetMetricStatistics. To get the same number of data points, you must perform 70 GetMetricStatistics calls. Here is a reference with more information: https://aws.amazon.com/premiumsupport/knowledge-center/cloudwatch-getmetricdata-api/
Proposal:
Use GetMetricData vs. GetMetricStatistics calls for CloudWatch input.
Current behavior:
GetMetricStatistics calls are used
Desired behavior:
Use GetMetricData calls
Use case: [Why is this important (helps with prioritizing requests)]
Real example:
AWS/SQS in one of our accounts has ~40k MetricName's which takes ~15m to complete using:
[[inputs.cloudwatch]]
delay = "1m"
fieldpass = ["approximate_number_of_messages_visible_maximum"]
interval = "5m"
namespace = "AWS/SQS"
period = "5m"
ratelimit = 20
For the sake of argument, let's say we need all that data. Rate limit can be increased, but I also have 12 other namespaces that need to be consumed.
Rates can be increased on AWS side but if consuming can be more efficient, that would be preferred.
 druchoo
All 30 comments
Yeah, I think this could be done and it appears it would help quite a lot.
 danielnelson
on 13 Feb 2019
danielnelson
on 13 Feb 2019
@druchoo Does the Telegraf config for your account with ~40k MetricNames use Dimensions at all, whether unique per metric or the same for all 40k Metrics? Is it possible for you to paste a portion of your config file, or some fabricated example that simulates your current config? Thanks.
 glinton
on 7 Mar 2019
glinton
on 7 Mar 2019
@glinton, AWS/SQS looks like
    "Metrics": [
        {
            "Namespace": "AWS/SQS",
            "MetricName": "SentMessageSize",
            "Dimensions": [
                {
                    "Name": "QueueName",
                    "Value": "<<REDACTED>>"
                }
            ]
        }
Attached are complete configs and complete output from list-metrics from AWS/SQS.
1f2fdd38df415d6b49331def0fc50499-7bc7502dc90424d7f4a9b8dbceb39b2ee6cafe15.zip
druchoo
on 8 Mar 2019
When you list a namespace in your config without any further metric/dimension filtering, are you intending to get an aggregate of the namespace per metric, or are you still looking for individual metrics?
Ex:
[[inputs.cloudwatch]]
  delay = "1m"
  interval = "1m"
  namespace = "AWS/EC2"
  period = "1m"
  profile = "dev"
  ratelimit = 20
  region = "us-east-1"
  [inputs.cloudwatch.tags]
    environment = "dev"
Are you expecting aggregates for an individual instance?:
cloudwatch_aws_ec2,instance_id=i-abc123,region=us-west-2 status_check_failed_sum=0,status_check_failed_average=0,status_check_failed_maximum=0,status_check_failed_minimum=0,status_check_failed_sample_count=1 1552081080000000000
cloudwatch_aws_ec2,instance_id=i-def456,region=us-west-2 status_check_failed_sum=0,status_check_failed_average=0,status_check_failed_maximum=0,status_check_failed_minimum=0,status_check_failed_sample_count=1 1552081080000000000
...
or an aggregate of all instances?:
cloudwatch_aws_ec2,region=us-west-2 status_check_failed_sum=0,status_check_failed_average=0,status_check_failed_maximum=0,status_check_failed_minimum=0,status_check_failed_sample_count=100 1552081080000000000
@glinton, I would expect an aggregates for an individual instance:
cloudwatch_aws_ec2,instance_id=i-abc123,region=us-west-2 status_check_failed_sum=0,status_check_failed_average=0,status_check_failed_maximum=0,status_check_failed_minimum=0,status_check_failed_sample_count=1 1552081080000000000
cloudwatch_aws_ec2,instance_id=i-def456,region=us-west-2 status_check_failed_sum=0,status_check_failed_average=0,status_check_failed_maximum=0,status_check_failed_minimum=0,status_check_failed_sample_count=1 1552081080000000000
@druchoo I've got a version ready for you to test, if you're willing. If you need a different os/architecture than listed below, ping me:
glinton
on 12 Mar 2019
@glinton, Thanks for quick turnaround!
Unfortunately, getting many errors like the following across various namespaces.
$ telegraf-1.11.0~cdf83d95/telegraf --config /etc/telegraf/telegraf.d/cloudwatch_dev_apigateway_va.conf --test
2019-03-12T20:55:56Z I! Starting Telegraf
2019-03-12T20:55:56Z E! [inputs.cloudwatch]: Error in plugin: Failed to get metric data - ValidationError: The value 5xx_error_FooBar_average for parameter MetricDataQueries.member.1.Id is not matching the expected pattern ^[a-z][a-zA-Z0-9_]*$.
The value 5xx_error_FooBar_maximum for parameter MetricDataQueries.member.2.Id is not matching the expected pattern ^[a-z][a-zA-Z0-9_]*$.
The value 5xx_error_FooBar_minimum for parameter MetricDataQueries.member.3.Id is not matching the expected pattern ^[a-z][a-zA-Z0-9_]*$.
The value 5xx_error_FooBar_sum for parameter MetricDataQueries.member.4.Id is not matching the expected pattern ^[a-z][a-zA-Z0-9_]*$.
The value 5xx_error_FooBar_sampleCount for parameter MetricDataQueries.member.5.Id is not matching the expected pattern ^[a-z][a-zA-Z0-9_]*$.
Ok, here's a build that :crossed_fingers: resolves that error:
glinton
on 13 Mar 2019
@glinton, I'm still seeing similar errors.
The value sample_count_4xx_something_in_snake_case_/foobar/{ver}/baz/something_something_get for parameter MetricDataQueries.member.40.Id is not matching the expected pattern ^[a-z][a-zA-Z0-9_]*$.
The value average_5xx_foo_and_bar a_bracadab_bra api v1 for parameter MetricDataQueries.member.41.Id is not matching the expected pattern ^[a-z][a-zA-Z0-9_]*$.
If you have somewhere private I can send full logs. There's much private data so makes obfuscating a bit of pain.
druchoo
on 18 Mar 2019
I think that's enough of the data for now. The issue is with the something_in_snake_case_/foobar/{ver}/baz/something_something_get which is a metric name in some namespace. If you know which namespace that metric is coming from, can you post that here, along with the namespace the average_5xx_foo_and_bar a_bracadab_bra api v1 metric belongs to? thanks
glinton
on 20 Mar 2019
@glinton, Those two examples are both from AWS/ApiGateway. Other namespaces have errors though. Here are the results from all comsumed namespaces.
Good:
- AWS/CloudFront
- AWS/ECS
- AWS/ELB
- AWS/RDS
- AWS/SQS
Errors:
- AWS/ApiGateway
2019-03-20T18:18:07Z E! [inputs.cloudwatch]: Error in plugin: Failed to get metric data - ValidationError: The value average_integration_latency_snake_case1/snake_case2/{ver}/snake_case3/snake_case4/snake_case5 for parameter MetricDataQueries.member.61.Id is not matching the expected pattern ^[a-z][a-zA-Z0-9_]*$.
AWS/ApplicationELB
2019-03-20T18:17:57Z E! [inputs.cloudwatch]: Error in plugin: Failed to get metric data - ValidationError: The value average_request_count_targetgroup/snake_case1/snake_case2/snake_case3/snake_case4 for parameter MetricDataQueries.member.1.Id is not matching the expected pattern ^[a-z][a-zA-Z0-9_]*$.
AWS/DynamoDB
2019-03-20T18:18:10Z E! [inputs.cloudwatch]: Error in plugin: Failed to get metric data - ValidationError: The value average_returned_records_count_snake_case_2018_02_05t19:05:07_516_get_records for parameter MetricDataQueries.member.1.Id is not matching the expected pattern ^[a-z][a-zA-Z0-9_]*$.
AWS/ES
2019-03-20T18:18:18Z E! [inputs.cloudwatch]: Error in plugin: Failed to get metric data - ValidationError: The value average_cluster_status.snake_case1 for parameter MetricDataQueries.member.46.Id is not matching the expected pattern ^[a-z][a-zA-Z0-9_]*$.
AWS/Lambda
2019-03-20T18:18:24Z E! [inputs.cloudwatch]: Error in plugin: Failed to get metric data - ValidationError: The value average_throttles_snake_case1:snake_case2 for parameter MetricDataQueries.member.6.Id is not matching the expected pattern ^[a-z][a-zA-Z0-9_]*$.
AWS/NetworkELB
2019-03-20T18:18:28Z E! [inputs.cloudwatch]: Error in plugin: Failed to get metric data - ValidationError: The value average_processed_bytes_net/snake_case1/snake_case2 for parameter MetricDataQueries.member.1.Id is not matching the expected pattern ^[a-z][a-zA-Z0-9_]*$.
AWS/States
2019-03-20T18:18:53Z E! [inputs.cloudwatch]: Error in plugin: Failed to get metric data - ValidationError: The value average_execution_time_arn:aws:states:snake_case1:01234567890:snake_case2:snake_case3 for parameter MetricDataQueries.member.6.Id is not matching the expected pattern ^[a-z][a-zA-Z0-9_]*$.
druchoo
on 20 Mar 2019
Thanks a bunch. I'll let you know when I've got a new binary for you to test.
glinton
on 20 Mar 2019
@druchoo Try this one, it's still a WIP, but your current errors should be handled:
glinton
on 21 Mar 2019
@druchoo @CpuID This has filtering abilities (collect only sum, or average, etc...) and shouldn't be bothered with odd dimension values:
Defaults: but check pr's readme for more info:
# statistic_include = [ "average", "sum", min", "max", sample_count" ]
@druchoo @CpuID This has filtering abilities (collect only sum, or average, etc...) and shouldn't be bothered with odd dimension values:
I'll give it a try later today, and compare the volume reduction of metrics for our usage :) thx
 CpuID
on 22 Mar 2019
CpuID
on 22 Mar 2019
@druchoo @CpuID This has filtering abilities (collect only sum, or average, etc...) and shouldn't be bothered with odd dimension values:
can confirm this build is working nicely (in local testing usage), including statistic_include. minor README tweaks required, PR review submitted
CpuID
on 22 Mar 2019
@glinton first metric retrieval worked really nicely in local dev, but after leaving it a bit longer I noticed this for the exact qty of metrics received:
2019-03-22T21:05:06Z I! [inputs.cloudwatch] W! UNHANDLED MULTIPLE RESULT VALUES!! [0xc001437d40 0xc001437d48]
2019-03-22T21:05:06Z I! [inputs.cloudwatch] W! UNHANDLED MULTIPLE RESULT VALUES!! [0xc001437df0 0xc001437df8]
2019-03-22T21:05:06Z I! [inputs.cloudwatch] W! UNHANDLED MULTIPLE RESULT VALUES!! [0xc001437ea0 0xc001437ea8]
2019-03-22T21:05:06Z I! [inputs.cloudwatch] W! UNHANDLED MULTIPLE RESULT VALUES!! [0xc001437f50 0xc001437f58]
2019-03-22T21:05:06Z I! [inputs.cloudwatch] W! UNHANDLED MULTIPLE RESULT VALUES!! [0xc001448000 0xc001448008]
2019-03-22T21:05:06Z I! [inputs.cloudwatch] W! UNHANDLED MULTIPLE RESULT VALUES!! [0xc0014480b0 0xc0014480b8]
2019-03-22T21:05:06Z I! [inputs.cloudwatch] W! UNHANDLED MULTIPLE RESULT VALUES!! [0xc001448160 0xc001448168]
2019-03-22T21:05:06Z I! [inputs.cloudwatch] W! UNHANDLED MULTIPLE RESULT VALUES!! [0xc001448210 0xc001448218]
Config:
# ECS
[[inputs.cloudwatch]]
  region = "us-east-1"
  ## Amazon Credentials - USING ENV VARS
  period = "1m"
  delay = "2m"
  interval = "1m"
  cache_ttl = "10m"
  namespace = "AWS/ECS"
  # Low metric count, but lots of services
  ratelimit = 150
  # Requires https://github.com/influxdata/telegraf/pull/5544
  statistic_include = ["average", "maximum", "sample_count"]

  # Cluster level + Cluster+Service level. Cluster level only adds about 3~% in extra metrics give or take, might as well.
  # This is all metrics for ECS, no filtering required
Note: I do have multiple instances of the cloudwatch input plugin, 1 per namespace (4 of them to be exact), but this is the only one that executes per minute (the others are 5mins).
Thoughts?
CpuID
on 22 Mar 2019
2019-03-22T21:05:06Z I! [inputs.cloudwatch] W! UNHANDLED MULTIPLE RESULT VALUES!! [0xc001437d40 0xc001437d48]
in terms of execution time, I started my run at xx:00:47, noticed a couple of 1min iterations of metrics fine, then at xx:05:01 I saw all those unhandled results. Also, I am using round_interval = true if thats of any relevance.
CpuID
on 22 Mar 2019
@glinton struggling to repro the UNHANDLED MULTIPLE RESULT VALUES errors now, looking at the error itself it implies there were 2 values returned and we errored if there was >1.
https://godoc.org/github.com/aws/aws-sdk-go/service/cloudwatch#MetricDataResult
I wonder if the right answer is to parse out the timestamps slice + the values slice, as opposed to just taking the first value/timestamp in aggregateMetrics()? feels like its N data points for a given metric in the response...
CpuID
on 23 Mar 2019
@glinton, Initial results for 1.11.0~29d425b6 were successful. The previous regex errors look to be resolved but performance was not good in most cases. In a few cases, execution time was exponentially greater than pre 1.11 (using 1.9.4 currently).
For reference, testing is done on AWS c4.2xlarge (8 CPU, 15 GB mem) running CentOS 7.2. For timing, linux time command was used:
time telegraf --test --config $config.
For example:
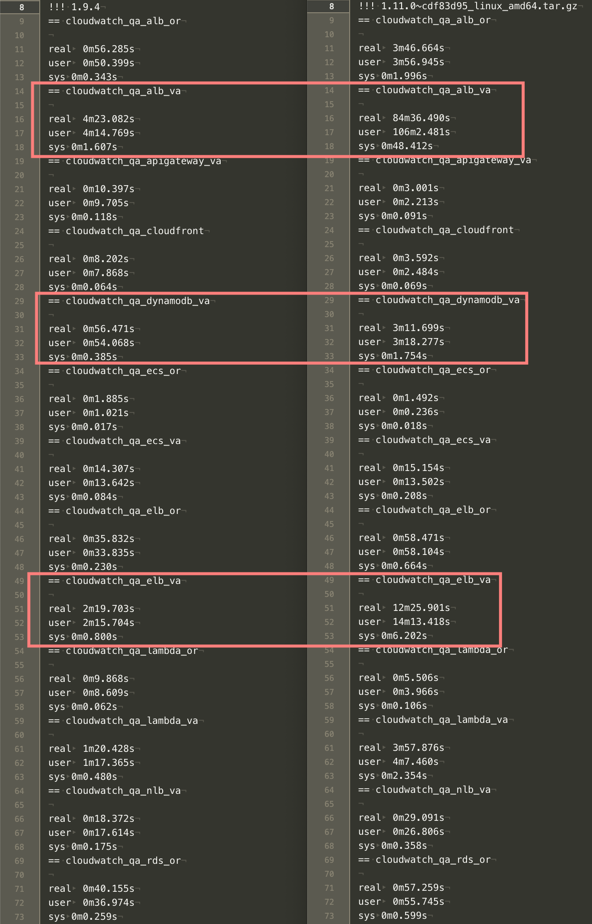
Currently, testing 1.11.0~327fdda5 but performance seems similar to 1.11.0~29d425b6.
druchoo
on 26 Mar 2019
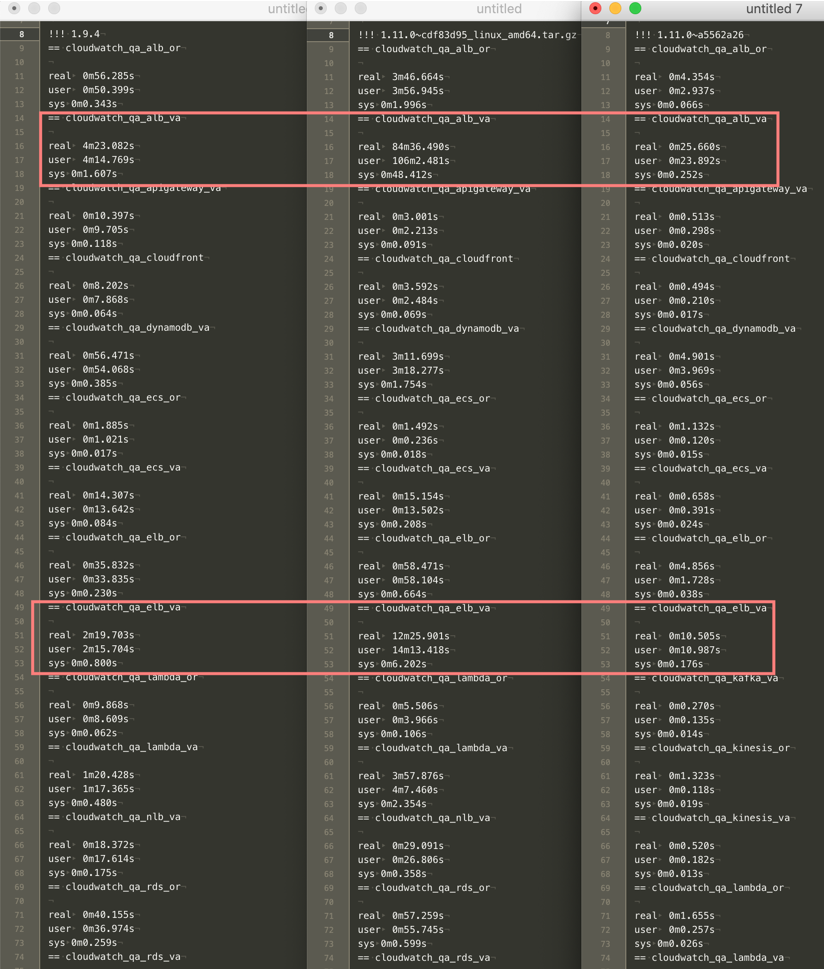
@druchoo this build should be much faster:
glinton
on 27 Mar 2019
@glinton, WOW, this build is extremely fast!
Two issues:
AWS/NetworkELBreturns no data. This is true for all builds that were provided. 1.9.4 returns data
> cloudwatch_aws_network_elb,environment=qa,host=qa-host,load_balancer=foo/bar/baz,region=us-east-1,unit=count new_flow_count_average=0,new_flow_count_maximum=0,new_flow_count_minimum=0,new_flow_count_sample_count=1,new_flow_count_sum=0 1553692860000000000
AWS/Kafkahas spaces in tags. Just noticed this.. Same behaviour for 1.9.4. So not sure about this one
> cloudwatch_aws_kafka,broker\ id=2,cluster\ _name=foo-bar,environment=qa,host=qa-host,region=us-east-1,unit=count network_rx_errors_average=0,network_rx_errors_maximum=0,network_rx_errors_minimum=0,network_rx_errors_sample_count=1,network_rx_errors_sum=0 1553692440000000000
Super glad to hear that it's more performant for you. Can you list metrics manually, when I run it, I get an empty array:
aws cloudwatch list-metrics --namespace AWS/NetworkELB
Regarding the spaces in tags, it looks like that behavior would not have changed from 1.9.4. I'm not sure if it should be changed or not, but I'll push up a change to fix it.
glinton
on 27 Mar 2019
@glinton, Ok sounds good on the spaces. AWS/NetworkELB looks like:
{
  "Metrics": [
    {
      "Namespace": "AWS/NetworkELB",
      "MetricName": "ProcessedBytes",
      "Dimensions": [
        {
          "Name": "LoadBalancer",
          "Value": "net/foo-bar/a123b234c345"
        }
      ]
    },
    {
      "Namespace": "AWS/NetworkELB",
      "MetricName": "ActiveFlowCount",
      "Dimensions": [
        {
          "Name": "LoadBalancer",
          "Value": "net/foo-bar/a123b234c345"
        },
        {
          "Name": "AvailabilityZone",
          "Value": "us-east-1a"
        }
      ]
    },
    {
      "Namespace": "AWS/NetworkELB",
      "MetricName": "ConsumedLCUs",
      "Dimensions": [
        {
          "Name": "LoadBalancer",
          "Value": "net/foo-bar/a123b234c345"
        }
      ]
    },
    {
      "Namespace": "AWS/NetworkELB",
      "MetricName": "HealthyHostCount",
      "Dimensions": [
        {
          "Name": "TargetGroup",
          "Value": "targetgroup/bar-baz/x123z456"
        },
        {
          "Name": "LoadBalancer",
          "Value": "net/foo-bar/a123b234c345"
        }
      ]
    },
    {
      "Namespace": "AWS/NetworkELB",
      "MetricName": "NewFlowCount",
      "Dimensions": [
        {
          "Name": "LoadBalancer",
          "Value": "net/foo-bar/a123b234c345"
        }
      ]
    },
    {
      "Namespace": "AWS/NetworkELB",
      "MetricName": "ProcessedBytes",
      "Dimensions": [
        {
          "Name": "AvailabilityZone",
          "Value": "us-east-1a"
        },
        {
          "Name": "LoadBalancer",
          "Value": "net/foo-bar/a123b234c345"
        }
      ]
    },
    {
      "Namespace": "AWS/NetworkELB",
      "MetricName": "TCP_Client_Reset_Count",
      "Dimensions": [
        {
          "Name": "AvailabilityZone",
          "Value": "us-east-1e"
        },
        {
          "Name": "LoadBalancer",
          "Value": "net/foo-bar/a123b234c345"
        }
      ]
    },
    {
      "Namespace": "AWS/NetworkELB",
      "MetricName": "TCP_ELB_Reset_Count",
      "Dimensions": [
        {
          "Name": "AvailabilityZone",
          "Value": "us-east-1a"
        },
        {
          "Name": "LoadBalancer",
          "Value": "net/foo-bar/a123b234c345"
        }
      ]
    },
    {
      "Namespace": "AWS/NetworkELB",
      "MetricName": "TCP_Target_Reset_Count",
      "Dimensions": [
        {
          "Name": "AvailabilityZone",
          "Value": "us-east-1c"
        },
        {
          "Name": "LoadBalancer",
          "Value": "net/foo-bar/a123b234c345"
        }
      ]
    },
    {
      "Namespace": "AWS/NetworkELB",
      "MetricName": "UnHealthyHostCount",
      "Dimensions": [
        {
          "Name": "TargetGroup",
          "Value": "targetgroup/bar-baz/x123z456"
        },
        {
          "Name": "LoadBalancer",
          "Value": "net/foo-bar/a123b234c345"
        }
      ]
    }
  ]
}
Interesting... yet while running telegraf with the same aws credentials you do still get
E! [inputs.cloudwatch]: Error in plugin: No metrics found to collect
in the logs?
glinton
on 27 Mar 2019
No error. Output is just empty.
$ telegraf-1.11.0~a5562a26/telegraf --test --config /etc/telegraf/telegraf.d/cloudwatch_qa_nlb_va.conf
2019-03-27T17:17:40Z I! Starting Telegraf
$
EDIT: I see the issue.
[[inputs.cloudwatch]]
delay = "2m"
interval = "1m"
namespace = "AWS/NetworkELB"
period = "1m"
Delay of 2m doesn't work with a5562a26 but does with 1.9.4. When it's increased to 3m or more a5562a26 outputs results.
druchoo
on 27 Mar 2019
Ah, interesting, that must be a limitation of the different API; the updateWindow function didn't change. Does it get data after being left running for a while?
glinton
on 27 Mar 2019
@glinton,
Yes, telegraf produces data if left running when using interval >2m. Probably related to the different API's like you said. 🤷♂️
Actually, checking all my configs, we're only using an interval >1m for AWS/NetworkELB. IIRC, that namespace was wonky. So i'm good with having to change to a slightly higher delay for it.
From my perspective the last build you provided is good. Thanks!
druchoo
on 27 Mar 2019
Testing the build from 6 days ago here now - I'll let you know how things go @glinton - I've had a prior build running for a while now. This one should give us less CPU usage :)
CpuID
on 2 Apr 2019
Testing the build from 6 days ago here now - I'll let you know how things go @glinton - I've had a prior build running for a while now. This one should give us less CPU usage :)
just deployed the latest build, dramatic decrease in CPU usage. the measurements on the system we were using: 300-320% avg/max -> 1% avg 4% max (running in ECS with cgroup CPU limits effectively, but I left the limits unchanged during the upgrade).
CpuID
on 2 Apr 2019
Related issues
 Xiol
·
3Comments
Xiol
·
3Comments
 aihysp
·
3Comments
aihysp
·
3Comments
 corentingi
·
3Comments
corentingi
·
3Comments
 yn1v
·
3Comments
yn1v
·
3Comments
 grafanaUser123
·
3Comments
grafanaUser123
·
3Comments
Most helpful comment
@glinton, WOW, this build is extremely fast!
Two issues:
AWS/NetworkELBreturns no data. This is true for all builds that were provided. 1.9.4 returns dataAWS/Kafkahas spaces in tags. Just noticed this.. Same behaviour for 1.9.4. So not sure about this one