Telegraf: Add plugin to monitor webserver/nginx log files more easily
Directions
Bug report
N/A
Relevant telegraf.conf:
[[inputs.nginx]]
urls = ["https://localhost/nginx_status"]
insecure_skip_verify = true
response_timeout = "5s"
System info:
OS: CentOS Linux release 7.4.1708 (Core)
Kernel: 3.10.0-514.6.2.el7.x86_64
Telegraf: telegraf-1.5.3-1.x86_64
Steps to reproduce:
- ...
- ...
Expected behavior:
To have more metrics in the open source version [[inputs.nginx]].
Actual behavior:
Metrics exist at Workers level.
Additional info:
https://github.com/lebinh/ngxtop
Feature Request
I think is a good point here in order to track better and to monitor the NG|NX open source version.
Proposal:
To have metrics also for: request code [2xx, 3xx, 4xx, 5xx, total], uptime of nginx, version of nginx, other metrics.
$ ngxtop top remote_addr
running for 168 seconds, 167 records processed: 0.99 req/sec

top remote_addr
| remote_addr    |   count |
|----------------+---------|
$ tail -f /var/log/nginx/access.log | ngxtop -f common
running for 0 seconds, 0 records processed: 0.00 req/sec

Summary:
|   count | avg_bytes_sent   |   2xx |   3xx |   4xx |   5xx |
|---------+------------------+-------+-------+-------+-------|
|       0 |                  |     0 |     0 |     0 |     0 |

Detailed:
| request_path   | count   | avg_bytes_sent   | 2xx   | 3xx   | 4xx   | 5xx   |
|----------------+---------+------------------+-------+-------+-------+-------|
Current behavior:
Not present there:
- Response codes and need [[inputs.logparser]] to use in order to have the codes.
- Uptime.
- Version.
- req/sec
Desired behavior:
It will be beter to have it with [[inputs.nginx]] directly those.
Also uptime of NG|NX, version,
Use case: [Why is this important (helps with prioritizing requests)]
I think most of us are using the Open Source version instead of Nginx Plus version.
 fchiorascu
All 29 comments
@fchiorascu Can you check if any of these metrics are in the output of the server status page? (http://localhost/server_status)
 danielnelson
on 9 Apr 2018
danielnelson
on 9 Apr 2018
$ curl -k https://localhost/nginx_status
Active connections: 2
server accepts handled requests
290851 290851 137528
Reading: 0 Writing: 1 Waiting: 1
fchiorascu
on 10 Apr 2018
I know they are not there, I'm sorry for disturbing you with this for the Nginx open source version. But there is no other way of collecting those?
Only using "ngxtop" or "inputs.logparser" for access.log?
fchiorascu
on 10 Apr 2018
It looks like ngxtop also parses the logs. I wasn't able to find any other methods that are open source.
danielnelson
on 11 Apr 2018
Could be a way to parse the logs and interpret with telegraf -> InfluxDB?
You think that ngxtop is reasonable in terms of performance/ time/ resources to use as continous monitoring with telegraf or better [[inputs.logparser]].
Also I've opened a case on the Community page, kindly if you have time to look at it regarding [[inputs.logparser]].
Link: https://community.influxdata.com/t/inputs-logparser-no-output-in-test-mode-and-no-metrics/4684/7
fchiorascu
on 14 Apr 2018
I think this can be built using logparser along with some existing and upcoming processors/aggregators, Namely https://github.com/influxdata/telegraf/pull/3523 and the basicstats aggregator.
There is a lot of discussion on that community post, what still needs to be resolved?
danielnelson
on 17 Apr 2018
Thank you, this is all.
fchiorascu
on 17 Apr 2018
Can you upload about 50 lines of nginx logging output? I'll see if I can figure out the appropriate config to get these metrics using these aggregators.
danielnelson
on 17 Apr 2018
Hi Daniel. Sorry for the delay I was not here few days.
Sure I'll put the lines.
fchiorascu
on 21 Apr 2018
1. Nginx configuration:
$ cat /etc/nginx/nginx.conf
http {
log_format main '$remote_addr - $remote_user [$time_local] "$request" '
'$status $body_bytes_sent "$http_referer" '
'"$http_user_agent" "$http_x_forwarded_for"';
access_log /var/log/nginx/access.log main;
2. Nginx logs:
a. Due to the fact that I've activated the nginx_status there are also logs in format:
127.0.0.1 - - [22/Apr/2018:15:51:30 +0000] "GET /nginx_status HTTP/1.1" 200 109 "-" "Go-http-client/1.1" "-"
127.0.0.1 - - [22/Apr/2018:15:52:00 +0000] "GET /nginx_status HTTP/1.1" 200 109 "-" "Go-http-client/1.1" "-"
127.0.0.1 - - [22/Apr/2018:15:52:30 +0000] "GET /nginx_status HTTP/1.1" 200 109 "-" "Go-http-client/1.1" "-"
127.0.0.1 - - [22/Apr/2018:15:53:00 +0000] "GET /nginx_status HTTP/1.1" 200 109 "-" "Go-http-client/1.1" "-"
127.0.0.1 - - [22/Apr/2018:15:53:30 +0000] "GET /nginx_status HTTP/1.1" 200 109 "-" "Go-http-client/1.1" "-"
127.0.0.1 - - [22/Apr/2018:15:54:00 +0000] "GET /nginx_status HTTP/1.1" 200 109 "-" "Go-http-client/1.1" "-"
127.0.0.1 - - [22/Apr/2018:15:54:30 +0000] "GET /nginx_status HTTP/1.1" 200 109 "-" "Go-http-client/1.1" "-"
b. Access logs (through this I have access to Grafana/ Kibana/ Jenkins tools):
192.168.0.16 - - [22/Apr/2018:16:01:33 +0000] "GET /ui/favicons/favicon-32x32.png HTTP/1.1" 200 1371 "https://127.0.0.1/app/kibana" "Mozilla/5.0 (Windows NT 6.1; Win64; x64) AppleWebKit/537.36 (KHTML, like Gecko) Chrome/66.0.3359.117 Safari/537.36" "-"
192.168.0.16 - - [22/Apr/2018:16:01:33 +0000] "GET /ui/favicons/favicon-16x16.png HTTP/1.1" 200 996 "https://127.0.0.1/app/kibana" "Mozilla/5.0 (Windows NT 6.1; Win64; x64) AppleWebKit/537.36 (KHTML, like Gecko) Chrome/66.0.3359.117 Safari/537.36" "-"
192.168.0.16 - - [22/Apr/2018:16:01:33 +0000] "GET /api/saved_objects/?type=visualization&per_page=1000&page=1&search_fields=title%5E3&search_fields=description HTTP/1.1" 200 1592 "https://127.0.0.1/app/kibana" "Mozilla/5.0 (Windows NT 6.1; Win64; x64) AppleWebKit/537.36 (KHTML, like Gecko) Chrome/66.0.3359.117 Safari/537.36" "-"
192.168.0.16 - - [22/Apr/2018:16:01:34 +0000] "GET /bundles/4be5b8808b5216ee6b6a1a4a29493e32.svg HTTP/1.1" 200 571 "https://127.0.0.1/app/kibana" "Mozilla/5.0 (Windows NT 6.1; Win64; x64) AppleWebKit/537.36 (KHTML, like Gecko) Chrome/66.0.3359.117 Safari/537.36" "-"
192.168.0.16 - - [22/Apr/2018:16:01:37 +0000] "GET /api/saved_objects/?type=index-pattern&fields=title&per_page=10000 HTTP/1.1" 200 161 "https://127.0.0.1/app/kibana" "Mozilla/5.0 (Windows NT 6.1; Win64; x64) AppleWebKit/537.36 (KHTML, like Gecko) Chrome/66.0.3359.117 Safari/537.36" "-"
192.168.0.16 - - [22/Apr/2018:16:01:37 +0000] "GET /ui/favicons/favicon-32x32.png HTTP/1.1" 200 1371 "https://127.0.0.1/app/kibana" "Mozilla/5.0 (Windows NT 6.1; Win64; x64) AppleWebKit/537.36 (KHTML, like Gecko) Chrome/66.0.3359.117 Safari/537.36" "-"
192.168.0.16 - - [22/Apr/2018:16:01:37 +0000] "GET /ui/favicons/favicon-16x16.png HTTP/1.1" 200 996 "https://127.0.0.1/app/kibana" "Mozilla/5.0 (Windows NT 6.1; Win64; x64) AppleWebKit/537.36 (KHTML, like Gecko) Chrome/66.0.3359.117 Safari/537.36" "-"
192.168.0.16 - - [22/Apr/2018:16:01:37 +0000] "POST /elasticsearch/_msearch HTTP/1.1" 200 33006 "https://127.0.0.1/app/kibana" "Mozilla/5.0 (Windows NT 6.1; Win64; x64) AppleWebKit/537.36 (KHTML, like Gecko) Chrome/66.0.3359.117 Safari/537.36" "-"
192.168.0.16 - - [22/Apr/2018:16:01:39 +0000] "GET /grafana/api/dashboards/tags HTTP/1.1" 200 570 "https://127.0.0.1/grafana/d/NtFQAVzmk/project1-prod-jenkins-prometheus?orgId=1" "Mozilla/5.0 (Windows NT 6.1; Win64; x64) AppleWebKit/537.36 (KHTML, like Gecko) Chrome/66.0.3359.117 Safari/537.36" "-"
192.168.0.16 - - [22/Apr/2018:16:01:39 +0000] "GET /grafana/api/search?dashboardIds=18&dashboardIds=17&dashboardIds=16&dashboardIds=12&dashboardIds=38 HTTP/1.1" 200 1815 "https://127.0.0.1/grafana/d/NtFQAVzmk/project1-prod-jenkins-prometheus?orgId=1" "Mozilla/5.0 (Windows NT 6.1; Win64; x64) AppleWebKit/537.36 (KHTML, like Gecko) Chrome/66.0.3359.117 Safari/537.36" "-"
192.168.0.16 - - [22/Apr/2018:16:01:39 +0000] "GET /grafana/api/search?limit=5&starred=true HTTP/1.1" 200 219 "https://127.0.0.1/grafana/d/NtFQAVzmk/project1-prod-jenkins-prometheus?orgId=1" "Mozilla/5.0 (Windows NT 6.1; Win64; x64) AppleWebKit/537.36 (KHTML, like Gecko) Chrome/66.0.3359.117 Safari/537.36" "-"
192.168.0.16 - - [22/Apr/2018:16:01:39 +0000] "GET /grafana/api/search?folderIds=0&query=&starred=false HTTP/1.1" 200 2172 "https://127.0.0.1/grafana/d/NtFQAVzmk/project1-prod-jenkins-prometheus?orgId=1" "Mozilla/5.0 (Windows NT 6.1; Win64; x64) AppleWebKit/537.36 (KHTML, like Gecko) Chrome/66.0.3359.117 Safari/537.36" "-"
192.168.0.16 - - [22/Apr/2018:16:01:41 +0000] "GET /grafana/api/search?folderIds=32 HTTP/1.1" 200 371 "https://127.0.0.1/grafana/d/NtFQAVzmk/project1-prod-jenkins-prometheus?orgId=1" "Mozilla/5.0 (Windows NT 6.1; Win64; x64) AppleWebKit/537.36 (KHTML, like Gecko) Chrome/66.0.3359.117 Safari/537.36" "-"
192.168.0.16 - - [22/Apr/2018:16:01:42 +0000] "GET /grafana/api/dashboards/uid/SkUMoGkmk HTTP/1.1" 200 31974 "https://127.0.0.1/grafana/d/SkUMoGkmk/project1-prod-grafana-internal-metrics" "Mozilla/5.0 (Windows NT 6.1; Win64; x64) AppleWebKit/537.36 (KHTML, like Gecko) Chrome/66.0.3359.117 Safari/537.36" "-"
192.168.0.16 - - [22/Apr/2018:16:01:43 +0000] "GET /grafana/api/datasources/proxy/1/api/v1/series?match[]=grafana_info&start=1524412004&end=1524412904 HTTP/1.1" 200 130 "https://127.0.0.1/grafana/d/SkUMoGkmk/project1-prod-grafana-internal-metrics" "Mozilla/5.0 (Windows NT 6.1; Win64; x64) AppleWebKit/537.36 (KHTML, like Gecko) Chrome/66.0.3359.117 Safari/537.36" "-"
192.168.0.16 - - [22/Apr/2018:16:01:43 +0000] "GET /grafana/api/datasources/proxy/1/api/v1/series?match[]=grafana_info&start=1524412004&end=1524412904 HTTP/1.1" 200 130 "https://127.0.0.1/grafana/d/SkUMoGkmk/project1-prod-grafana-internal-metrics" "Mozilla/5.0 (Windows NT 6.1; Win64; x64) AppleWebKit/537.36 (KHTML, like Gecko) Chrome/66.0.3359.117 Safari/537.36" "-"
192.168.0.16 - - [22/Apr/2018:16:01:43 +0000] "GET /grafana/api/datasources/proxy/1/api/v1/query?query=topk(1%2C%20grafana_info)&time=1524412904 HTTP/1.1" 200 178 "https://127.0.0.1/grafana/d/SkUMoGkmk/project1-prod-grafana-internal-metrics?orgId=1" "Mozilla/5.0 (Windows NT 6.1; Win64; x64) AppleWebKit/537.36 (KHTML, like Gecko) Chrome/66.0.3359.117 Safari/537.36" "-"
192.168.0.16 - - [22/Apr/2018:16:01:43 +0000] "GET /grafana/api/datasources/proxy/1/api/v1/query?query=up%7Bjob%3D%22grafana%22%7D&time=1524412904 HTTP/1.1" 200 163 "https://127.0.0.1/grafana/d/SkUMoGkmk/project1-prod-grafana-internal-metrics?orgId=1" "Mozilla/5.0 (Windows NT 6.1; Win64; x64) AppleWebKit/537.36 (KHTML, like Gecko) Chrome/66.0.3359.117 Safari/537.36" "-"
192.168.0.16 - - [22/Apr/2018:16:01:43 +0000] "GET /grafana/api/datasources/proxy/1/api/v1/query_range?query=grafana_api_login_post_total%7Bjob%3D%22grafana%22%7D&start=1524412004&end=1524412904&step=30 HTTP/1.1" 200 254 "https://127.0.0.1/grafana/d/SkUMoGkmk/project1-prod-grafana-internal-metrics?orgId=1" "Mozilla/5.0 (Windows NT 6.1; Win64; x64) AppleWebKit/537.36 (KHTML, like Gecko) Chrome/66.0.3359.117 Safari/537.36" "-"
192.168.0.16 - - [22/Apr/2018:16:01:43 +0000] "GET /grafana/api/datasources/proxy/1/api/v1/query_range?query=grafana_api_login_oauth_total%7Bjob%3D%22grafana%22%7D&start=1524412004&end=1524412904&step=30 HTTP/1.1" 200 254 "https://127.0.0.1/grafana/d/SkUMoGkmk/project1-prod-grafana-internal-metrics?orgId=1" "Mozilla/5.0 (Windows NT 6.1; Win64; x64) AppleWebKit/537.36 (KHTML, like Gecko) Chrome/66.0.3359.117 Safari/537.36" "-"
192.168.0.16 - - [22/Apr/2018:16:01:43 +0000] "GET /grafana/api/datasources/proxy/1/api/v1/query?query=sort(topk(10%2C%20sum%20by%20(handler)%20(http_request_total%7Bjob%3D%22grafana%22%7D)))&time=1524412904 HTTP/1.1" 200 230 "https://127.0.0.1/grafana/d/SkUMoGkmk/project1-prod-grafana-internal-metrics?orgId=1" "Mozilla/5.0 (Windows NT 6.1; Win64; x64) AppleWebKit/537.36 (KHTML, like Gecko) Chrome/66.0.3359.117 Safari/537.36" "-"
192.168.0.16 - - [22/Apr/2018:16:01:43 +0000] "GET /grafana/api/datasources/proxy/1/api/v1/query_range?query=sum%20by%20(method%2Cstatuscode)%20(irate(http_request_total%7Bjob%3D%27grafana%27%7D%5B5m%5D))&start=1524412004&end=1524412904&step=30 HTTP/1.1" 200 297 "https://127.0.0.1/grafana/d/SkUMoGkmk/project1-prod-grafana-internal-metrics?orgId=1" "Mozilla/5.0 (Windows NT 6.1; Win64; x64) AppleWebKit/537.36 (KHTML, like Gecko) Chrome/66.0.3359.117 Safari/537.36" "-"
192.168.0.16 - - [22/Apr/2018:16:01:43 +0000] "GET /grafana/api/datasources/proxy/1/api/v1/query_range?query=increase(grafana_alerting_result_total%5B1m%5D)&start=1524412004&end=1524412904&step=45 HTTP/1.1" 200 290 "https://127.0.0.1/grafana/d/SkUMoGkmk/project1-prod-grafana-internal-metrics?orgId=1" "Mozilla/5.0 (Windows NT 6.1; Win64; x64) AppleWebKit/537.36 (KHTML, like Gecko) Chrome/66.0.3359.117 Safari/537.36" "-"
192.168.0.16 - - [22/Apr/2018:16:01:43 +0000] "GET /grafana/api/datasources/proxy/1/api/v1/query_range?query=%20sum%20(ALERTS)&start=1524412004&end=1524412904&step=45 HTTP/1.1" 200 177 "https://127.0.0.1/grafana/d/SkUMoGkmk/project1-prod-grafana-internal-metrics?orgId=1" "Mozilla/5.0 (Windows NT 6.1; Win64; x64) AppleWebKit/537.36 (KHTML, like Gecko) Chrome/66.0.3359.117 Safari/537.36" "-"
192.168.0.16 - - [22/Apr/2018:16:01:43 +0000] "GET /grafana/api/datasources/proxy/1/api/v1/query_range?query=grafana_api_dataproxy_request_all_milliseconds%7Bjob%3D%22grafana%22%2C%20quantile%3D%220.9%22%7D&start=1524412004&end=1524412904&step=30 HTTP/1.1" 200 285 "https://127.0.0.1/grafana/d/SkUMoGkmk/project1-prod-grafana-internal-metrics?orgId=1" "Mozilla/5.0 (Windows NT 6.1; Win64; x64) AppleWebKit/537.36 (KHTML, like Gecko) Chrome/66.0.3359.117 Safari/537.36" "-"
192.168.0.16 - - [22/Apr/2018:16:01:43 +0000] "GET /grafana/api/datasources/proxy/1/api/v1/query_range?query=grafana_api_dataproxy_request_all_milliseconds%7Bjob%3D%22grafana%22%2C%20quantile%3D%220.5%22%7D&start=1524412004&end=1524412904&step=30 HTTP/1.1" 200 284 "https://127.0.0.1/grafana/d/SkUMoGkmk/project1-prod-grafana-internal-metrics?orgId=1" "Mozilla/5.0 (Windows NT 6.1; Win64; x64) AppleWebKit/537.36 (KHTML, like Gecko) Chrome/66.0.3359.117 Safari/537.36" "-"
192.168.0.16 - - [22/Apr/2018:16:01:43 +0000] "GET /grafana/api/datasources/proxy/1/api/v1/query_range?query=grafana_api_dashboard_search_milliseconds%7Bjob%3D%22grafana%22%2C%20quantile%3D%220.5%22%7D&start=1524412004&end=1524412904&step=15 HTTP/1.1" 200 354 "https://127.0.0.1/grafana/d/SkUMoGkmk/project1-prod-grafana-internal-metrics?orgId=1" "Mozilla/5.0 (Windows NT 6.1; Win64; x64) AppleWebKit/537.36 (KHTML, like Gecko) Chrome/66.0.3359.117 Safari/537.36" "-"
192.168.0.16 - - [22/Apr/2018:16:01:43 +0000] "GET /grafana/api/datasources/proxy/1/api/v1/query_range?query=rate(grafana_api_dashboard_save_milliseconds_sum%7Bjob%3D%22grafana%22%7D%5B5m%5D)%20%2F%20rate(grafana_api_dashboard_save_milliseconds_count%7Bjob%3D%22grafana%22%7D%5B5m%5D)&start=1524412004&end=1524412904&step=15 HTTP/1.1" 200 299 "https://127.0.0.1/grafana/d/SkUMoGkmk/project1-prod-grafana-internal-metrics?orgId=1" "Mozilla/5.0 (Windows NT 6.1; Win64; x64) AppleWebKit/537.36 (KHTML, like Gecko) Chrome/66.0.3359.117 Safari/537.36" "-"
192.168.0.16 - - [22/Apr/2018:16:01:43 +0000] "GET /grafana/api/datasources/proxy/1/api/v1/query?query=grafana_stat_total_users&time=1524412904 HTTP/1.1" 200 174 "https://127.0.0.1/grafana/d/SkUMoGkmk/project1-prod-grafana-internal-metrics?orgId=1" "Mozilla/5.0 (Windows NT 6.1; Win64; x64) AppleWebKit/537.36 (KHTML, like Gecko) Chrome/66.0.3359.117 Safari/537.36" "-"
192.168.0.16 - - [22/Apr/2018:16:01:43 +0000] "GET /grafana/api/datasources/proxy/1/api/v1/query?query=grafana_stat_total_orgs&time=1524412904 HTTP/1.1" 200 172 "https://127.0.0.1/grafana/d/SkUMoGkmk/project1-prod-grafana-internal-metrics?orgId=1" "Mozilla/5.0 (Windows NT 6.1; Win64; x64) AppleWebKit/537.36 (KHTML, like Gecko) Chrome/66.0.3359.117 Safari/537.36" "-"
192.168.0.16 - - [22/Apr/2018:16:01:43 +0000] "GET /grafana/api/datasources/proxy/1/api/v1/query_range?query=sum(irate(grafana_proxy_response_status_total%5B5m%5D))&start=1524412004&end=1524412904&step=60 HTTP/1.1" 200 163 "https://127.0.0.1/grafana/d/SkUMoGkmk/project1-prod-grafana-internal-metrics?orgId=1" "Mozilla/5.0 (Windows NT 6.1; Win64; x64) AppleWebKit/537.36 (KHTML, like Gecko) Chrome/66.0.3359.117 Safari/537.36" "-"
192.168.0.16 - - [22/Apr/2018:16:01:43 +0000] "GET /grafana/api/datasources/proxy/1/api/v1/query_range?query=sum(irate(grafana_page_response_status_total%5B5m%5D))&start=1524412004&end=1524412904&step=60 HTTP/1.1" 200 169 "https://127.0.0.1/grafana/d/SkUMoGkmk/project1-prod-grafana-internal-metrics?orgId=1" "Mozilla/5.0 (Windows NT 6.1; Win64; x64) AppleWebKit/537.36 (KHTML, like Gecko) Chrome/66.0.3359.117 Safari/537.36" "-"
192.168.0.16 - - [22/Apr/2018:16:01:43 +0000] "GET /grafana/api/datasources/proxy/1/api/v1/query_range?query=grafana_api_dashboard_get_milliseconds%7Bjob%3D%22grafana%22%2C%20quantile%3D%220.5%22%7D&start=1524412004&end=1524412904&step=30 HTTP/1.1" 200 280 "https://127.0.0.1/grafana/d/SkUMoGkmk/project1-prod-grafana-internal-metrics?orgId=1" "Mozilla/5.0 (Windows NT 6.1; Win64; x64) AppleWebKit/537.36 (KHTML, like Gecko) Chrome/66.0.3359.117 Safari/537.36" "-"
192.168.0.16 - - [22/Apr/2018:16:01:43 +0000] "GET /grafana/api/datasources/proxy/1/api/v1/query_range?query=grafana_api_dataproxy_request_all_milliseconds%7Bjob%3D%22grafana%22%2C%20quantile%3D%220.99%22%7D&start=1524412004&end=1524412904&step=15 HTTP/1.1" 200 368 "https://127.0.0.1/grafana/d/SkUMoGkmk/project1-prod-grafana-internal-metrics?orgId=1" "Mozilla/5.0 (Windows NT 6.1; Win64; x64) AppleWebKit/537.36 (KHTML, like Gecko) Chrome/66.0.3359.117 Safari/537.36" "-"
192.168.0.16 - - [22/Apr/2018:16:01:43 +0000] "GET /grafana/api/datasources/proxy/1/api/v1/query?query=grafana_stat_total_playlists&time=1524412904 HTTP/1.1" 200 175 "https://127.0.0.1/grafana/d/SkUMoGkmk/project1-prod-grafana-internal-metrics?orgId=1" "Mozilla/5.0 (Windows NT 6.1; Win64; x64) AppleWebKit/537.36 (KHTML, like Gecko) Chrome/66.0.3359.117 Safari/537.36" "-"
192.168.0.16 - - [22/Apr/2018:16:01:43 +0000] "GET /grafana/api/datasources/proxy/1/api/v1/query_range?query=grafana_api_dashboard_search_milliseconds%7Bjob%3D%22grafana%22%2C%20quantile%3D%220.5%22%7D&start=1524412004&end=1524412904&step=15 HTTP/1.1" 200 354 "https://127.0.0.1/grafana/d/SkUMoGkmk/project1-prod-grafana-internal-metrics?orgId=1" "Mozilla/5.0 (Windows NT 6.1; Win64; x64) AppleWebKit/537.36 (KHTML, like Gecko) Chrome/66.0.3359.117 Safari/537.36" "-"
192.168.0.16 - - [22/Apr/2018:16:01:43 +0000] "GET /grafana/api/datasources/proxy/1/api/v1/query_range?query=grafana_api_dashboard_search_milliseconds%7Bjob%3D%22grafana%22%2C%20quantile%3D%220.5%22%7D&start=1524412004&end=1524412904&step=15 HTTP/1.1" 200 354 "https://127.0.0.1/grafana/d/SkUMoGkmk/project1-prod-grafana-internal-metrics?orgId=1" "Mozilla/5.0 (Windows NT 6.1; Win64; x64) AppleWebKit/537.36 (KHTML, like Gecko) Chrome/66.0.3359.117 Safari/537.36" "-"
192.168.0.16 - - [22/Apr/2018:16:01:43 +0000] "GET /grafana/api/datasources/proxy/1/api/v1/query_range?query=grafana_api_response_status_total%7Bjob%3D%22grafana%22%7D&start=1524412004&end=1524412904&step=30 HTTP/1.1" 200 274 "https://127.0.0.1/grafana/d/SkUMoGkmk/project1-prod-grafana-internal-metrics?orgId=1" "Mozilla/5.0 (Windows NT 6.1; Win64; x64) AppleWebKit/537.36 (KHTML, like Gecko) Chrome/66.0.3359.117 Safari/537.36" "-"
192.168.0.16 - - [22/Apr/2018:16:01:43 +0000] "GET /grafana/api/datasources/proxy/1/api/v1/query_range?query=grafana_proxy_response_status_total%7Bjob%3D%22grafana%22%7D&start=1524412004&end=1524412904&step=15 HTTP/1.1" 200 353 "https://127.0.0.1/grafana/d/SkUMoGkmk/project1-prod-grafana-internal-metrics?orgId=1" "Mozilla/5.0 (Windows NT 6.1; Win64; x64) AppleWebKit/537.36 (KHTML, like Gecko) Chrome/66.0.3359.117 Safari/537.36" "-"
192.168.0.16 - - [22/Apr/2018:16:01:43 +0000] "GET /grafana/api/datasources/proxy/1/api/v1/query_range?query=sum(irate(grafana_api_response_status_total%5B5m%5D))&start=1524412004&end=1524412904&step=60 HTTP/1.1" 200 175 "https://127.0.0.1/grafana/d/SkUMoGkmk/project1-prod-grafana-internal-metrics?orgId=1" "Mozilla/5.0 (Windows NT 6.1; Win64; x64) AppleWebKit/537.36 (KHTML, like Gecko) Chrome/66.0.3359.117 Safari/537.36" "-"
192.168.0.16 - - [22/Apr/2018:16:01:43 +0000] "GET /grafana/api/datasources/proxy/1/api/v1/query_range?query=grafana_api_dashboard_get_milliseconds%7Bjob%3D%22grafana%22%2C%20quantile%3D%220.9%22%7D&start=1524412004&end=1524412904&step=30 HTTP/1.1" 200 280 "https://127.0.0.1/grafana/d/SkUMoGkmk/project1-prod-grafana-internal-metrics?orgId=1" "Mozilla/5.0 (Windows NT 6.1; Win64; x64) AppleWebKit/537.36 (KHTML, like Gecko) Chrome/66.0.3359.117 Safari/537.36" "-"
192.168.0.16 - - [22/Apr/2018:16:01:43 +0000] "GET /grafana/api/datasources/proxy/1/api/v1/query_range?query=rate(grafana_api_dashboard_get_milliseconds_sum%7Bjob%3D%22grafana%22%7D%5B5m%5D)%20%2F%20rate(grafana_api_dashboard_get_milliseconds_count%7Bjob%3D%22grafana%22%7D%5B5m%5D)&start=1524412004&end=1524412904&step=30 HTTP/1.1" 200 251 "https://127.0.0.1/grafana/d/SkUMoGkmk/project1-prod-grafana-internal-metrics?orgId=1" "Mozilla/5.0 (Windows NT 6.1; Win64; x64) AppleWebKit/537.36 (KHTML, like Gecko) Chrome/66.0.3359.117 Safari/537.36" "-"
192.168.0.16 - - [22/Apr/2018:16:01:43 +0000] "GET /grafana/api/datasources/proxy/1/api/v1/query_range?query=grafana_api_dashboard_save_milliseconds%7Bjob%3D%22grafana%22%2C%20quantile%3D%220.5%22%7D&start=1524412004&end=1524412904&step=30 HTTP/1.1" 200 275 "https://127.0.0.1/grafana/d/SkUMoGkmk/project1-prod-grafana-internal-metrics?orgId=1" "Mozilla/5.0 (Windows NT 6.1; Win64; x64) AppleWebKit/537.36 (KHTML, like Gecko) Chrome/66.0.3359.117 Safari/537.36" "-"
192.168.0.16 - - [22/Apr/2018:16:01:44 +0000] "GET /grafana/api/datasources/proxy/1/api/v1/query?query=grafana_stat_totals_dashboard&time=1524412904 HTTP/1.1" 200 176 "https://127.0.0.1/grafana/d/SkUMoGkmk/project1-prod-grafana-internal-metrics?orgId=1" "Mozilla/5.0 (Windows NT 6.1; Win64; x64) AppleWebKit/537.36 (KHTML, like Gecko) Chrome/66.0.3359.117 Safari/537.36" "-"
192.168.0.16 - - [22/Apr/2018:16:01:44 +0000] "GET /grafana/api/datasources/proxy/1/api/v1/query_range?query=grafana_page_response_status_total%7Bjob%3D%22grafana%22%7D&start=1524412004&end=1524412904&step=30 HTTP/1.1" 200 364 "https://127.0.0.1/grafana/d/SkUMoGkmk/project1-prod-grafana-internal-metrics?orgId=1" "Mozilla/5.0 (Windows NT 6.1; Win64; x64) AppleWebKit/537.36 (KHTML, like Gecko) Chrome/66.0.3359.117 Safari/537.36" "-"
192.168.0.16 - - [22/Apr/2018:16:01:44 +0000] "GET /grafana/api/datasources/proxy/1/api/v1/query_range?query=rate(grafana_api_dashboard_search_milliseconds_sum%7Bjob%3D%22grafana%22%7D%5B5m%5D)%20%2F%20rate(grafana_api_dashboard_search_milliseconds_count%7Bjob%3D%22grafana%22%7D%5B5m%5D)&start=1524412004&end=1524412904&step=15 HTTP/1.1" 200 340 "https://127.0.0.1/grafana/d/SkUMoGkmk/project1-prod-grafana-internal-metrics?orgId=1" "Mozilla/5.0 (Windows NT 6.1; Win64; x64) AppleWebKit/537.36 (KHTML, like Gecko) Chrome/66.0.3359.117 Safari/537.36" "-"
192.168.0.16 - - [22/Apr/2018:16:01:44 +0000] "GET /grafana/api/datasources/proxy/1/api/v1/query_range?query=rate(grafana_api_dataproxy_request_all_milliseconds_sum%7Bjob%3D%22grafana%22%7D%5B5m%5D)%20%2F%20rate(grafana_api_dataproxy_request_all_milliseconds_count%7Bjob%3D%22grafana%22%7D%5B5m%5D)&start=1524412004&end=1524412904&step=30 HTTP/1.1" 200 256 "https://127.0.0.1/grafana/d/SkUMoGkmk/project1-prod-grafana-internal-metrics?orgId=1" "Mozilla/5.0 (Windows NT 6.1; Win64; x64) AppleWebKit/537.36 (KHTML, like Gecko) Chrome/66.0.3359.117 Safari/537.36" "-"
192.168.0.16 - - [22/Apr/2018:16:01:44 +0000] "GET /grafana/api/datasources/proxy/1/api/v1/query_range?query=sum(go_goroutines%7Bjob%3D%22grafana%22%7D)&start=1524412004&end=1524412904&step=60 HTTP/1.1" 200 195 "https://127.0.0.1/grafana/d/SkUMoGkmk/project1-prod-grafana-internal-metrics?orgId=1" "Mozilla/5.0 (Windows NT 6.1; Win64; x64) AppleWebKit/537.36 (KHTML, like Gecko) Chrome/66.0.3359.117 Safari/537.36" "-"
192.168.0.16 - - [22/Apr/2018:16:01:44 +0000] "GET /grafana/api/datasources/proxy/1/api/v1/query_range?query=grafana_api_dashboard_save_milliseconds%7Bjob%3D%22grafana%22%2C%20quantile%3D%220.5%22%7D&start=1524412004&end=1524412904&step=30 HTTP/1.1" 200 275 "https://127.0.0.1/grafana/d/SkUMoGkmk/project1-prod-grafana-internal-metrics?orgId=1" "Mozilla/5.0 (Windows NT 6.1; Win64; x64) AppleWebKit/537.36 (KHTML, like Gecko) Chrome/66.0.3359.117 Safari/537.36" "-"
192.168.0.16 - - [22/Apr/2018:16:01:44 +0000] "GET /grafana/api/datasources/proxy/1/api/v1/query_range?query=sum(process_resident_memory_bytes%7Bjob%3D%22grafana%22%7D)&start=1524412004&end=1524412904&step=60 HTTP/1.1" 200 201 "https://127.0.0.1/grafana/d/SkUMoGkmk/project1-prod-grafana-internal-metrics?orgId=1" "Mozilla/5.0 (Windows NT 6.1; Win64; x64) AppleWebKit/537.36 (KHTML, like Gecko) Chrome/66.0.3359.117 Safari/537.36" "-"
192.168.0.16 - - [22/Apr/2018:16:01:44 +0000] "GET /grafana/api/datasources/proxy/1/api/v1/query_range?query=grafana_api_dashboard_save_milliseconds%7Bjob%3D%22grafana%22%2C%20quantile%3D%220.5%22%7D&start=1524412004&end=1524412904&step=30 HTTP/1.1" 200 275 "https://127.0.0.1/grafana/d/SkUMoGkmk/project1-prod-grafana-internal-metrics?orgId=1" "Mozilla/5.0 (Windows NT 6.1; Win64; x64) AppleWebKit/537.36 (KHTML, like Gecko) Chrome/66.0.3359.117 Safari/537.36" "-"
192.168.0.16 - - [22/Apr/2018:16:01:44 +0000] "GET /grafana/api/datasources/proxy/1/api/v1/query_range?query=grafana_api_dashboard_get_milliseconds%7Bjob%3D%22grafana%22%2C%20quantile%3D%220.99%22%7D&start=1524412004&end=1524412904&step=15 HTTP/1.1" 200 353 "https://127.0.0.1/grafana/d/SkUMoGkmk/project1-prod-grafana-internal-metrics?orgId=1" "Mozilla/5.0 (Windows NT 6.1; Win64; x64) AppleWebKit/537.36 (KHTML, like Gecko) Chrome/66.0.3359.117 Safari/537.36" "-"
fchiorascu
on 22 Apr 2018
running for 1042 seconds, 407 records processed: 0.39 req/sec
Summary:
| count | avg_bytes_sent | 2xx | 3xx | 4xx | 5xx |
|---------+------------------+-------+-------+-------+-------|
| 407 | 50482.369 | 405 | 1 | 1 | 0 |
Detailed:
| request_path | count | avg_bytes_sent | 2xx | 3xx | 4xx | 5xx |
|-----------------------------------------------------+---------+------------------+-------+-------+-------+-------|
| /grafana/api/datasources/proxy/1/api/v1/query_range | 114 | 635.307 | 114 | 0 | 0 | 0 |
| /nginx_status | 35 | 109.000 | 35 | 0 | 0 | 0 |
| /grafana/api/search | 26 | 1048.269 | 26 | 0 | 0 | 0 |
| /grafana/api/datasources/proxy/1/api/v1/query | 16 | 179.000 | 16 | 0 | 0 | 0 |
| /ui/favicons/favicon-32x32.png | 10 | 1371.000 | 10 | 0 | 0 | 0 |
| /ui/favicons/favicon-16x16.png | 8 | 996.000 | 8 | 0 | 0 | 0 |
| /grafana/api/datasources/proxy/5/query | 7 | 283896.714 | 7 | 0 | 0 | 0 |
| /grafana/api/datasources/proxy/1/api/v1/series | 6 | 152.333 | 6 | 0 | 0 | 0 |
| /api/saved_objects/ | 5 | 1499.200 | 5 | 0 | 0 | 0 |
| /grafana/api/dashboards/tags | 5 | 570.000 | 5 | 0 | 0 | 0 |
I've tried multiple methods without success and I'm wondering if will be better to have a script to collect the statuses: 2xx, 3xx, 4xx, 5xx instead of logparser/ grok.
Ex.
[root@server1 ~]# cat /var/log/nginx/access.log | cut -d ' ' -f 9 | sort | uniq -c | sort -fr
1961 200
1 404
1 302
[root@server1 ~]# cat /var/log/nginx/access.log | cut -d '"' -f3 | cut -d ' ' -f2 | sort | uniq -c | sort -rn
1965 200
1 404
1 302
[root@server1 ~]# awk '{print $9}' /var/log/nginx/access.log | sort | uniq -c | sort -rn
1966 200
1 404
1 302
https://www.regextester.com - I've tried also for apache.
Explanation of fields is as follows:
$remote_addr – IP from which request was made
$remote_user – HTTP Authenticated User. This will be blank for most apps as modern apps do not use HTTP-based authentication.
[$time_local] – timestamp as per server timezone
“$request” – HTTP request type GET, POST, etc + requested path without args + HTTP protocol version
$status – HTTP response code from server
$body_bytes_sent – size of server response in bytes
“$http_referer” – Referral URL (if present)
“$http_user_agent” – User agent as seen by server
_The most common responses are:_
200 - OK
206 - Partial Content
301 - Moved Permanently
302 - Found
304 - Not Modified
401 - Unauthorised (password required)
403 - Forbidden
404 - Not Found
I've readed about: https://community.influxdata.com/t/telegraf-count-field-values-processing-http-response-codes/3214 but not used.
fchiorascu
on 22 Apr 2018
I was entering on: https://grokdebug.herokuapp.com/discover?# and detected based on the logs format that are:
%{COMBINEDAPACHELOG} "-"
%{COMBINEDAPACHELOG} "-"
%{COMBINEDAPACHELOG} "-"
%{COMBINEDAPACHELOG} "-"
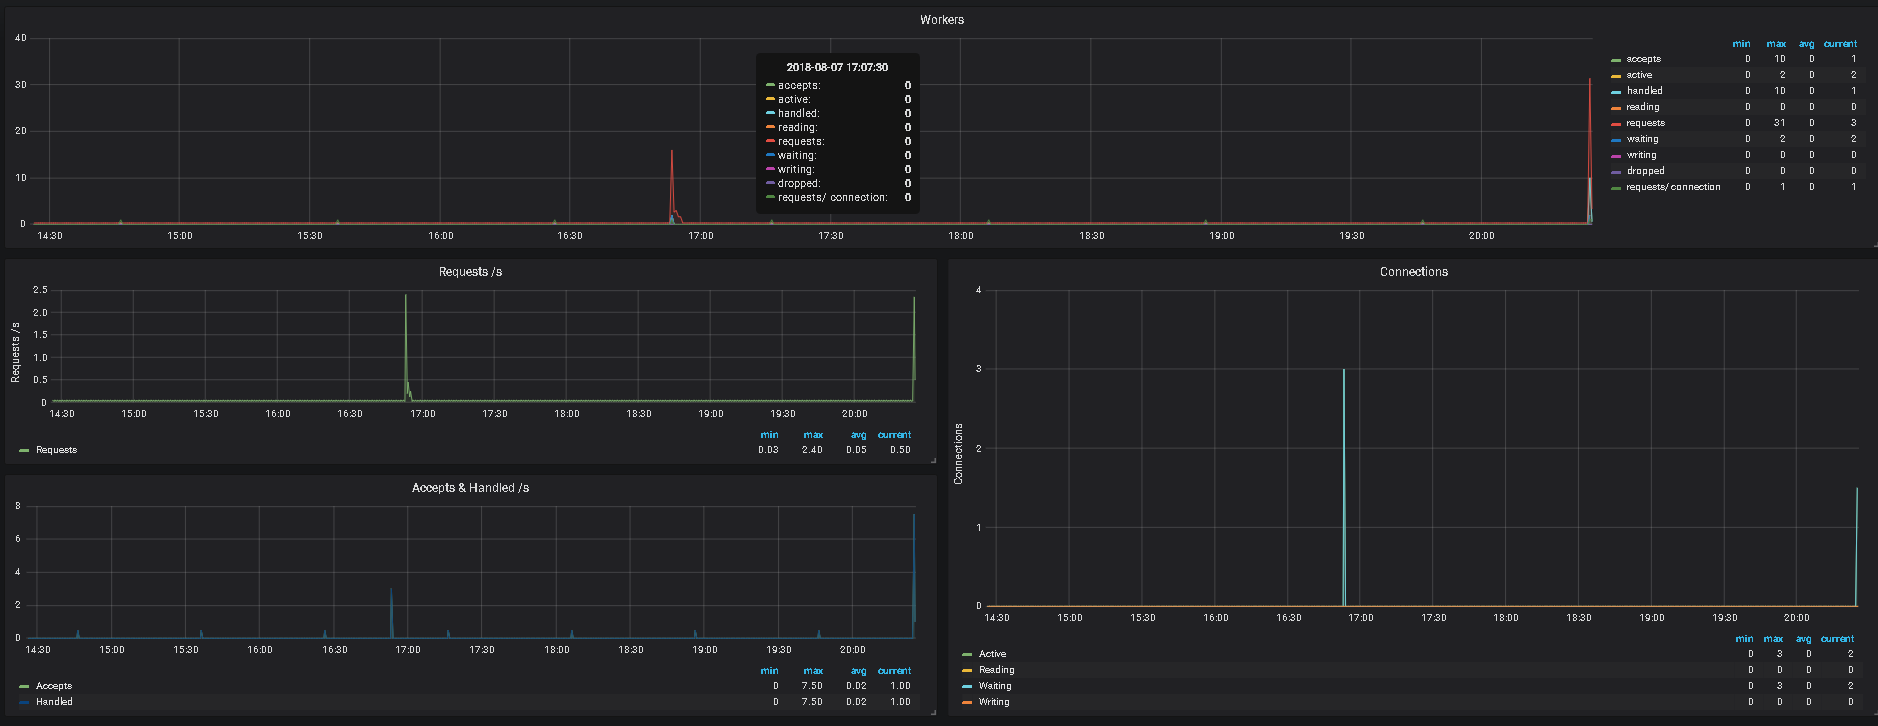
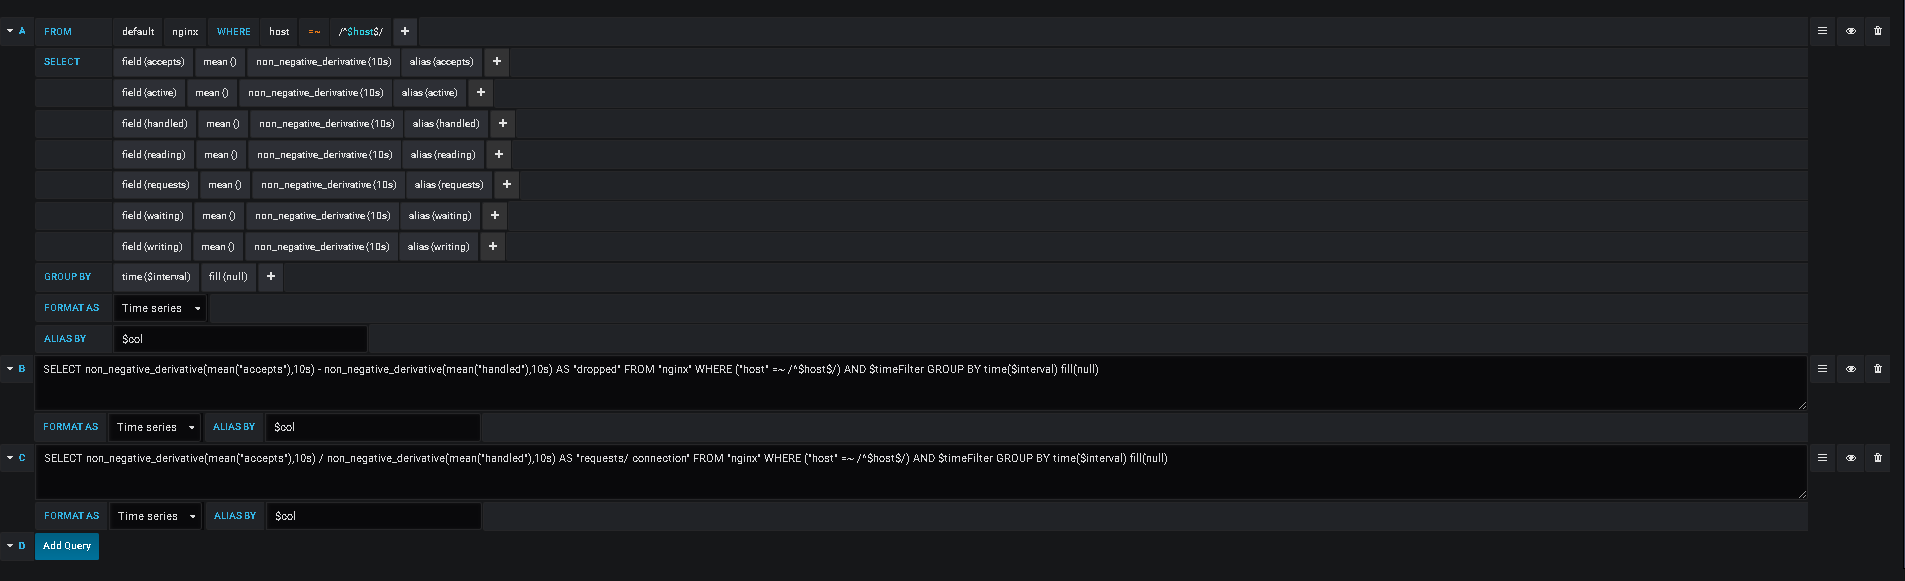
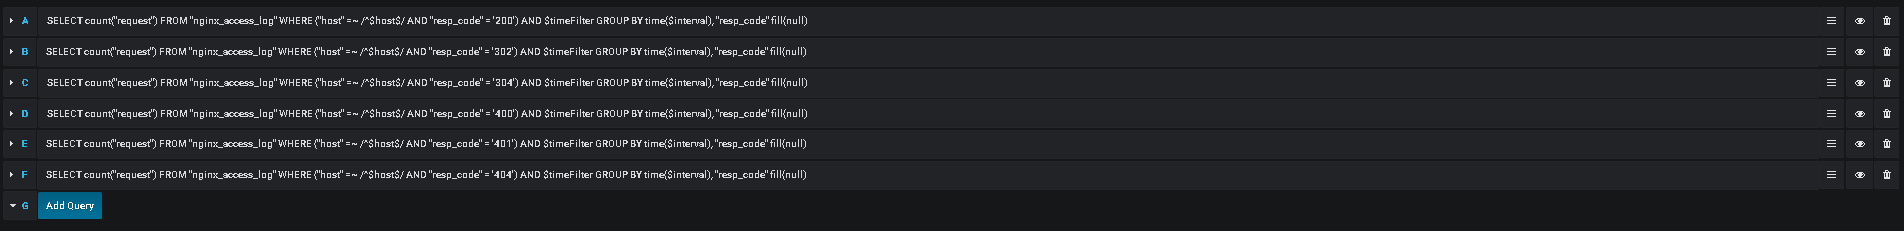
I've noticed that you recommended something that I observed also on internet regarding the influxdb queries: non_negative_derivative
Based on below graph nginx metric, do you think that my query is correct or not to use "non_negative_derivative"?
fchiorascu
on 22 Apr 2018
I've found another tool: apachetop
[root@server1 ~]# apachetop -f /var/log/nginx/access.log
last hit: 00:00:00 atop runtime: 0 days, 00:00:05 17:22:00
All: 0 reqs ( 0.0/sec) 0.0B ( 0.0B/sec) 0.0B/req
2xx: 0 ( 0.0%) 3xx: 0 ( 0.0%) 4xx: 0 ( 0.0%) 5xx: 0 ( 0.0%)
R ( 5s): 0 reqs ( 0.0/sec) 0.0B ( 0.0B/sec) 0.0B/req
2xx: 0 ( 0.0%) 3xx: 0 ( 0.0%) 4xx: 0 ( 0.0%) 5xx: 0 ( 0.0%)
I've tried with:
--telegraf.conf--
[[inputs.logparser]]
files = ["/var/log/nginx/access.log"]
from_beginning = false
name_override = "nginx_access_log"
[inputs.logparser.grok]
patterns = ["%{COMMON_LOG_FORMAT}"]
This are all the values that I have now:

Better to let the "from_beginning = false"?
fchiorascu
on 1 May 2018
Yeah, from_beginning is really only useful for debugging the patterns. Otherwise you will reparse the whole file when Telegraf is restarted or reloaded.
danielnelson
on 1 May 2018
Any news on this topic. What do you think Daniel, do you think that something will be implemented or the only way is with the logparser in future approaches.
fchiorascu
on 12 Jun 2018
Once I finish the value counter processor then I think we can do this with logparser, but it still would make sense to have a dedicated plugin for performance and ease of setup. If you include all the webservers that log in this format it could be useful for many users. @russorat Can you make sure this is prioritized appropriately?
danielnelson
on 13 Jun 2018
@fchiorascu @russorat, I was doing some testing and tried to duplicate nginx-top using some of our new processors and aggregators plugins, this will only work with the nightly builds.
I wouldn't say it's very user friendly now but this is the sort of operations I think many may want to do when parsing logs into metrics:
Config:
## Using the new grok data_format (aka parser) but this could be logparser.
[[inputs.tail]]
  name_override = "nginxlog"
  files = ["nginx.log"]
  from_beginning = true
  pipe = false
  data_format = "grok"
  grok_patterns = ["%{COMBINED_LOG_FORMAT}"]
  fielddrop = ["referrer", "agent", "http_version"]

[[processors.regex]]
  order = 1
  namepass = "nginxlog"

  ## Convert to category: 204 -> 2xx
  [[processors.regex.tags]]
    key = "resp_code"
    pattern = "^(\\d)\\d\\d$"
    replacement = "${1}xx"
  ## Trip query string: /foo?bar=1 -> /foo
  [[processors.regex.fields]]
    key = "request"
    pattern = "^([^?]+)?.*"
    replacement = "${1}"

[[processors.converter]]
  order = 2
  namepass = "nginxlog"
  ## convert resp_code tag to string field
  [processors.converter.tags]
    string = ["resp_code"]
  ## convert request field to a tag
  [processors.converter.fields]
    tag = ["request"]

## Add counts for each response code category
##
## I think if you never have two requests with the same timestamp then this
## would not be needed
[[aggregators.valuecounter]]
  namepass = "nginxlog"
  period = "10s"
  drop_original = true
  fields = ["resp_code"]

## Sum the response bytes
##
## I think if you never have two requests with the same timestamp then this
## would not be needed
[[aggregators.basicstats]]
  period = "10s"
  drop_original = true
  fieldpass = ["resp_bytes"]
  stats = ["sum"]

[[outputs.influxdb]]
  urls = ["http://127.0.0.1:8086"]
  database = "telegraf"
Queries
Get the number of 2xx,3xx,4xx and total responses for each resource:
select sum(resp_code_2xx) as "2xx", sum(resp_code_4xx) as "4xx", sum(resp_code_5xx) as "5xx", sum(/resp_code/) AS "total" from nginxlog group by request, verb, time(10s)
Total bytes by resource:
select sum(resp_bytes_sum) as total_bytes from nginxlog group by request, verb, time(10s)
Dear Daniel,
Many thanks, this sounds great.
I'll test it and come back with a feedback.
Kind Regards,
Florian
fchiorascu
on 14 Jul 2018
Hi Florian,
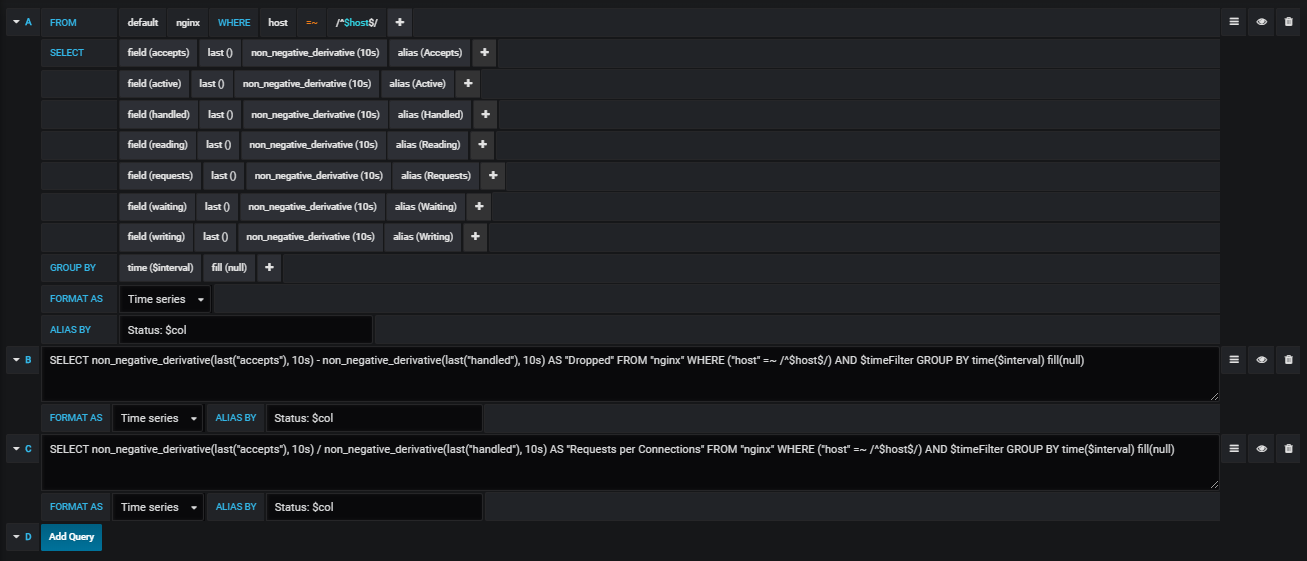
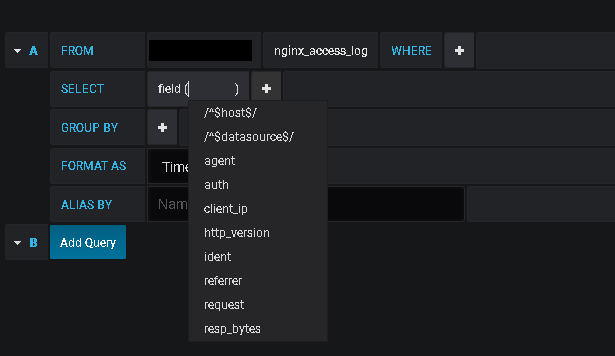
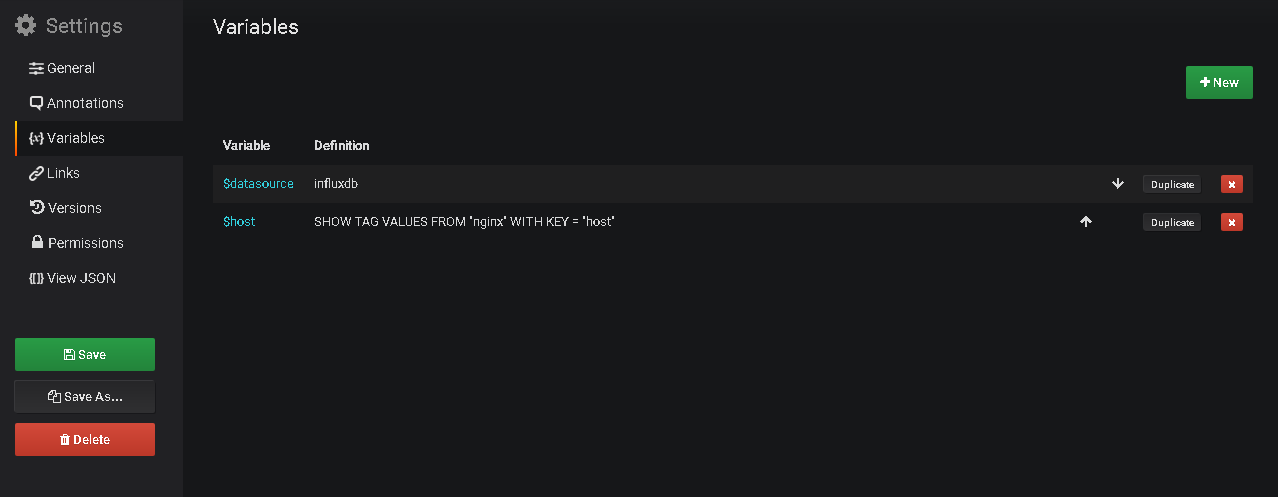
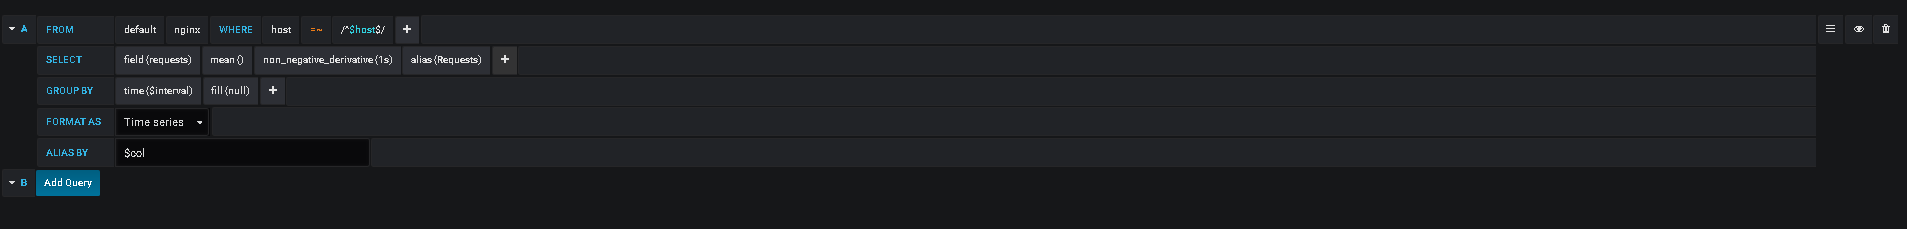
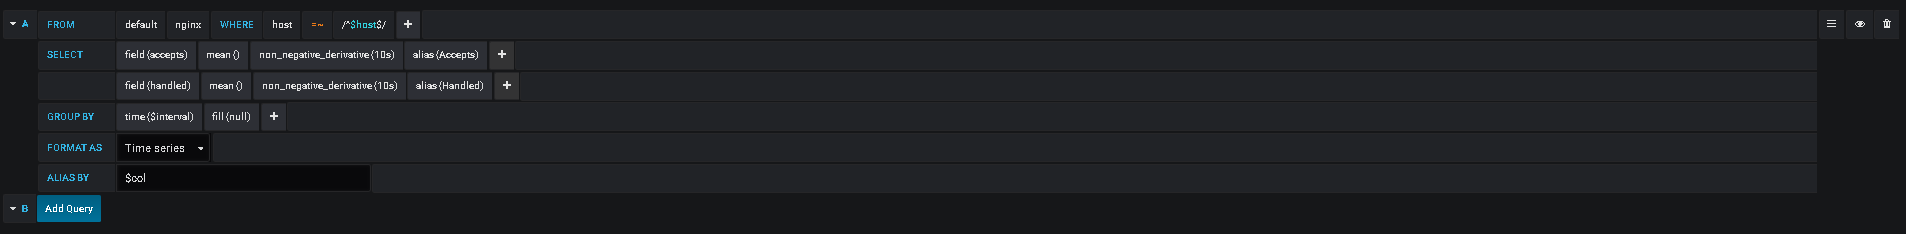
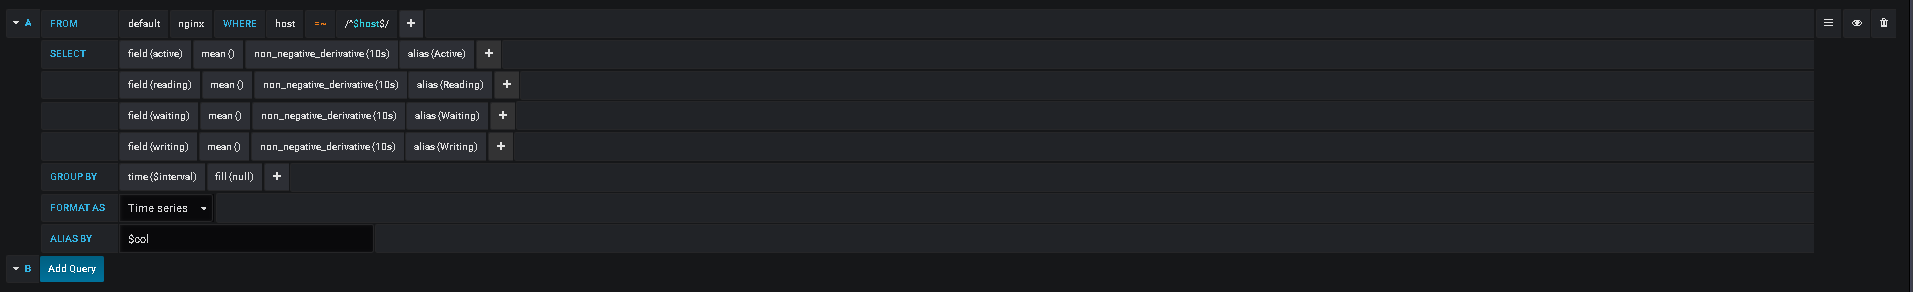
could you show me configuration in grafana for graphs you uploaded above? I would like to have something similar
 decentdeployer
on 2 Aug 2018
decentdeployer
on 2 Aug 2018
Hi,
Tomorrow I'll put here the update.
Kind Regards,
Florian
fchiorascu
on 2 Aug 2018
1.
2.
3.
4.
a.
b.
c.
d.
fchiorascu
on 7 Aug 2018
@danielnelson this is only for "nightly" version of telegraf, it will be something similar for the normal version of telegraf e.f. telegraf 1.7.3, etc?
fchiorascu
on 22 Aug 2018
It will have to be 1.8.0 for the valuecounter aggregator. I would also like to look into packaging this up into a more easy to use single input plugin, but it might be awhile before I have available time for that.
danielnelson
on 23 Aug 2018
you can use telegraf logparser plugin, add lines to telegraf.conf
[[inputs.logparser]]
  ## file(s) to tail:
  files = ["/usr/local/var/log/nginx/access.log"]
  from_beginning = false
  ## For parsing logstash-style "grok" patterns:
  [inputs.logparser.grok]
    patterns = ["%{COMBINED_LOG_FORMAT}"]
    measurement = "nginx_access_log"
you can alse see links:
https://github.com/influxdata/telegraf/tree/master/plugins/inputs/logparser
https://www.influxdata.com/blog/telegraf-correlate-log-metrics-data-performance-bottlenecks/
 kai-up
on 11 Dec 2018
kai-up
on 11 Dec 2018
Thank you @kaige11 I'll make a try, appreciated.
fchiorascu
on 16 Dec 2018
Looks like the current answer is to use tail with the grok parser.
 ssoroka
on 21 Sep 2020
ssoroka
on 21 Sep 2020
Related issues
 corentingi
·
3Comments
corentingi
·
3Comments
 IxDay
·
3Comments
IxDay
·
3Comments
 Isonami
·
3Comments
Isonami
·
3Comments
 mrcheeky123
·
3Comments
mrcheeky123
·
3Comments
 SongYg
·
3Comments
SongYg
·
3Comments
Most helpful comment
@fchiorascu @russorat, I was doing some testing and tried to duplicate nginx-top using some of our new processors and aggregators plugins, this will only work with the nightly builds.
I wouldn't say it's very user friendly now but this is the sort of operations I think many may want to do when parsing logs into metrics:
Config:
Queries
Get the number of 2xx,3xx,4xx and total responses for each resource:
Total bytes by resource: