Telegraf: A way to monitor the top n processes by cpu, memory or IO would be nice
Feature Request
Opening a feature request kicks off a discussion.
Proposal:
A mechanism to gather metrics of the top N processes, where one could discriminate the top N by CPU usage, Memory usage or IO operations/bytes
Current behavior:
The closest thing we have right now is the procstat module, that can select processes by a regex, by the user, or by a PID file
Desired behavior:
A way for the procstat module to select a configurable N quantity of processes by either memory usage, CPU usage, IO operations, IO bytes written/read
Use case:
Right now the only way to get the top N processes by some metric is to collect metrics for all processes and then use another tool (Prometheus, Grafana, etc) to select the ones on the top, but this approach has some issues.
If resources are limited, gathering information for all the processes in a server can generate unnecessarily large memory, cpu and/or disk usage, while at the same time providing little added value for someone that only needs to single out the most problematic processes
 mirath
All 37 comments
I'm willing to work on this feature and produce a PR, but I'd like to know if it aligns with the project philosophy and goals, or if the feature is already implemented in some input module
mirath
on 1 Sep 2017
In the past this would be something we would discourage due to the high cardinality of pids, but I think it is now something we could now consider with the TSI enhancement in InfluxDB 1.3 (when enabled).
However, it seems like with the current method of gathering process stats we might need to look at all processes to determine the top processes. If we are gathering process stats for all processes maybe it makes sense to report stats for all of them, as sending to InfluxDB would be only a minor amount of work and you can always select the top items at query time. If one is doing this then you could just the match everything pattern.
 danielnelson
on 5 Sep 2017
danielnelson
on 5 Sep 2017
The large resource usage does not come from telegraf, but from the time series backend (influxdb, prometheus, etc)
In cases where the memory is limited ( < 4gb) storing and slicing the series generated by all the processes can generate prohibiting amounts of memory consumption by the storage backend. If I'm running, say, Telegraf+Prometheus in a machine with only 2Gb, processing all the data for all processes every 10s in an effective manner could consume 500Mb or more, which would be a quarter of the total memory. Moreover, a lot of the data recolected is non-important (I dont really care about the stats of the init process for example).
Moreover, the high cardinality of PIDS can be a problem right now. I could just use procstat with the pgrep regex ".*", so the current implementation does allow to feed InfluxDB the stats of all PIDs in the system. Allowing to monitor only the top N would actually make it easier and more efficient to monitor all PIDs on the system by passing onto the time series database only the data that is important at any given time
mirath
on 6 Sep 2017
I agree that the pids are the problem, but I think storing the top-n does little to help with that as most processes will be top-n at some point. You will quickly have too many pids to store without using the TSI setting on InfluxDB.
The storage space argument is legitimate, but I wonder if this top function should be part of a processor?
danielnelson
on 6 Sep 2017
I don't really know how Processors are implemented. I've read the documentation but I don't know how they are implemented. What would be the benefit of having the top functionality implemented in a processor and not directly in the procstat input plugin?
mirath
on 6 Sep 2017
Actually, if we did this it would probably need to be done as an Aggregator, take a look at the min/max plugin. The main benefit would be that it could be used with other inputs.
danielnelson
on 6 Sep 2017
Ok. Do you still have reservations about implementing this feature?
I think it would be benefitial. You mention that most processeses will be top-n at some point, but I think this is true only for systems that are at rest. In my experience, system that run a particular task 24/7 have a relatively stable set of processeses in the top 10 in regards to memory consumption, cpu utilization and IO operations
mirath
on 6 Sep 2017
It definitely depends on work load, it would be important from a series cardinality point of view to ensure most processes never becomes top-n, even if only for a single collection.
If the system has a stable set of top processes, what is it about the current selection methods that do not give you what you need here?
danielnelson
on 6 Sep 2017
They don't give me, as far as I've found, a way to selectively pass to the
time series database only that stable set of top processes while also
alerting me when a new process enters the top.
The problem that I need to solve is twofold:
On one hand I want to know which are the most resource intensive processes,
this helps in informing scalability and optimization strategies.
On the other hand, I want to have information if a given process starts to
misbehave. If, for example, a machine runs out of memory because an update
introduced a memory leak in a system that previously didn't consume a lot
of resources, having the information of the top 10 processes over time
would accelerate diagnosis a lot, which is the main point of a telemetrics
system.
These problems can be solved by monitoring all PIDs, but for the reasons
stated above, it can be prohibitive in some scenarios.
On Tue, Sep 5, 2017, 6:59 PM Daniel Nelson notifications@github.com wrote:
It definitely depends on work load, it would be important from a series
cardinality point of view to ensure most processes never becomes top-n,
even if only for a single collection.If the system has a stable set of top processes, what is it about the
current selection methods that do not give you what you need here?—
You are receiving this because you authored the thread.
Reply to this email directly, view it on GitHub
https://github.com/influxdata/telegraf/issues/3192#issuecomment-327335848,
or mute the thread
https://github.com/notifications/unsubscribe-auth/AAL5a1R8JnImB9ot6hiCowmZrZiFWtD3ks5sfeBJgaJpZM4PJnbm
.
mirath
on 6 Sep 2017
Another option would be to send the data to Kapacitor and it would forward the filtered stats to InfluxDB, then you could use the existing top function in Kapacitor. I think it should look similar to this setup https://docs.influxdata.com/kapacitor/v1.3/guides/live_leaderboard/
If you would rather work on a top aggregator in Telegraf then I think it would be a good thing to have.
danielnelson
on 6 Sep 2017
I'll look into Kapacitor. But I'll work on the issue anyway if that's ok
with the project. I'm also doing this to dust off my programming and learn
a bit of Go
On Tue, Sep 5, 2017, 7:55 PM Daniel Nelson notifications@github.com wrote:
Another option would be to send the data to Kapacitor and it would forward
the filtered stats to InfluxDB, then you could use the existing top
function in Kapacitor. I think it should look similar to this setup
https://docs.influxdata.com/kapacitor/v1.3/guides/live_leaderboard/If you would rather work on a top aggregator in Telegraf then I think it
would be a good thing to have.—
You are receiving this because you authored the thread.
Reply to this email directly, view it on GitHub
https://github.com/influxdata/telegraf/issues/3192#issuecomment-327343549,
or mute the thread
https://github.com/notifications/unsubscribe-auth/AAL5azGZCRXagXHxbDWOPpKriUtusu6yks5sfe2SgaJpZM4PJnbm
.
mirath
on 6 Sep 2017
Sounds good, Telegraf is a great place to learn Go IMO. A bonus of using Kapacitor is then you are all lined up to use its alerting, especially if you are striving for infrastructure as code and want readable alerts checked in to source control.
danielnelson
on 6 Sep 2017
@danielnelson
I've been reading on the documentation of aggregators and processors. As far as I can tell, the aggregator interface doesn't offer a way to actually modify the list of metrics that get passed to the database, only processors can do that (they actually receive a pointer to the list of metrics). So this plugin would have to be done as a processor, not as an aggregator as you suggested.
Am I right or there is something I got wrong?
mirath
on 10 Sep 2017
I think it could probably be implemented as either a processor or a aggregator.
Aggregators generate new metrics, and leave the choice of if the original metrics are emitted as a user option handled by Telegraf via drop_original. In a "top" plugin it wouldn't make sense to emit the originals, so the user would need to make sure this is set to true. I'd say this aspect definitely favors doing it as a processor.
One thing that is nice about the Aggregator interface is the Push and Reset calls. These would make it easier to have a custom period over which you determine which processes are the top ones. The longer the period is set the longer a process would need high cpu to be top, which could reduce jitter during short spikes. So, this part might be easier as an aggregator but it should be possible to do the same with a processor.
So, I would probably implement this as a processor but add a configurable period. The implementation would store the running total of each field and only change which series are emitted every period?
danielnelson
on 11 Sep 2017
I like the processor + period approach, I'll work on that then.
mirath
on 11 Sep 2017
The way I've approached this problem in the past with homebrew process monitoring solutions is to use a criteria for defining "interesting" processes.
This criteria is things like:
- Process is listening on a TCP/UDP socket
- Process is contributing to system load (in a run state)
- Process is using > X kb of memory
- Process CPU time / wall time ratio > X %
- Process IO / wall time ratio > X %
And exclude all shells.
The benefit to doing this over a top N processes thing is that the box may have more than N "interesting" process, while N on another box may monitor too much and just generate statistics noise.
The "wall time ratio" stuff is important as any process which is running for a long time can accumulate CPU time or IO and become a "top process".
I've used the above criteria for years, and it was very reliable in regards to capturing misbehaving processes or processes we care about.
 phemmer
on 15 Sep 2017
phemmer
on 15 Sep 2017
Maybe what procstat really needs is some way to run a custom pid collector. So instead of using pgrep you can run any process that returns a pid per line.
danielnelson
on 15 Sep 2017
I had thought about that, and I think the problem there is you then have 2 different utilities polling the process data. One utility will pull all the data to determine what pids should be monitored, and then another utility will pull the data again (and it might get different data). Granted the second one (telegraf) should only be pulling data for a small number of PIDs. It just feels weird.
phemmer
on 15 Sep 2017
To be fair, that's what the plugin does now.
danielnelson
on 15 Sep 2017
True, but it's not pulling the full data of the process. The pgrep is only matching on process name, executable, or other limited information. It doesn't go through things like process statistics, so the data being used doesn't change between process matching and telegraf polling (other than the process going away entirely).
phemmer
on 15 Sep 2017
Yeah, performance wise it would probably be better to collect all processes and apply filters. I guess we could add procstat specific filters here if we feel that there are enough people interested in it, is this something that would still be useful for you?
As an aside, I have come around to the idea of attaching general purpose processors/aggregators to specific plugins though I will need to rework the internals before this can be done.
danielnelson
on 15 Sep 2017
I guess we could add procstat specific filters here if we feel that there are enough people interested in it, is this something that would still be useful for you?
I dunno. I was mostly just throwing out an idea that I've used in the past and worked well.
While I might like to have the functionality in place, currently we're making do with the existing matching functionality. Though we've barely touched the subject of process monitoring with telegraf in our systems, so we haven't felt the pain yet :-)
phemmer
on 15 Sep 2017
I've been analyzing the processor code, and it has come to my attention that in agent.go, not all current metrics are passed onto the processor plugins. They are passed on one by one
case metric := <-metricC:
// NOTE potential bottleneck here as we put each metric through the
// processors serially.
mS := []telegraf.Metric{metric} ### <- Here we create an array of size one
for _, processor := range a.Config.Processors {
mS = processor.Apply(mS...)
}
for _, m := range mS {
outMetricC <- m
}
...
case metric := <-aggC:
metrics := []telegraf.Metric{metric} ### <- Here we create an array of size one
for _, processor := range a.Config.Processors {
metrics = processor.Apply(metrics...)
}
for _, m := range metrics {
outMetricC <- m
}
This means that each call to Apply in the Processor interface does not receives enough context to calculate a topk.
Our options are then:
- Create an Aggregator that accumulates the measurements and returns them sorted in the Push call, and use the drop_original flag to get rid of the original metrics
- Move our efforts to change the procstat input module itself, so the filtering occurs before hitting the plugins
- Allow a mechanism for the processor plugin to buffer metrics before applying filters (I feel that this should not be necesary, and that the processor plugins should receive all the information they need at once, but then again, I'm not too familiar with the architectural objectives of the project)
- Modify Telegraf so it feeds all the metrics at once to the processor plugin (I don't like this one, feels like it might break existing plugins)
Out of those four, I'm inclined to do the first one, we would sacrifice the global nature of a Processor or Agregator plugin, but we could in exchange add functionality specific to the procstat plugin to make it more powerful and expressive.
I don't like the second one so much, as it seems a really awkward and round-about way of doing something that on the surface should be simple and straight forward to do.
What is your opinion @danielnelson?
mirath
on 18 Sep 2017
The processor would need to add state to its struct while the metrics flow through. This would mean at first no metrics are emitted until the processor has determined which ones to allow.
danielnelson
on 18 Sep 2017
So the Apply call would accumulate metrics until it has decided that it has enough information to give a return value? And in the meantime it would just return nil?
mirath
on 18 Sep 2017
I think it must, probably return an empty list. It could store the metrics until it knows what to allow and then emit the appropriate old metrics at that time.
danielnelson
on 18 Sep 2017
I think an empty list will work, but I have to look at the code. I'll check it out today or tomorrow.
mirath
on 18 Sep 2017
@mirath - thanks for working on this - I think this will be very useful!
 bfgoodrich
on 13 Oct 2017
bfgoodrich
on 13 Oct 2017
@bfgoodrich Thank you!
mirath
on 13 Oct 2017
have you tried the Top K Processor plugin from #3400 ? Does that resolve this issue?
 russorat
on 27 Jun 2018
russorat
on 27 Jun 2018
@russorat It does. I'll close the issue.
mirath
on 29 Jun 2018
@mirath Could you please add some quick info/example here showing how to accomplish the original goal, as stated in the initial post, with your new topk plugin? I've tried to understand the plugin's docs, but they have a lot of settings, and I'm having trouble understanding how to actually "monitor the top n processes by cpu, memory or IO" with it... :( If you've already posted an example somewhere else (like a blog or something), it'd be super cool if you could at least add a link to the explanation here! :) Thanks!
edit: Or maybe put the example in the topk docs?
edit 2: Is it required to use TSI somehow with this plugin? Is TSI still considered experimental?
edit 3: OK, I sat on this and here's what I now have, seems to be working, though I'm not sure if it's really doing what I wanted. Not sure if the fields I picked are the correct ones too, and not sure how to get i/o stats:
[[inputs.procstat]]
  pattern = "."
  pid_tag = true
  pid_finder = "native"
  # see: https://github.com/influxdata/telegraf/blob/1.7.0/docs/CONFIGURATION.md#measurement-filtering
  fieldpass = [
      "cpu_time_user",
      "cpu_usage",
      "memory_rss",
  ]

[[processors.topk]]
  # see: https://github.com/influxdata/telegraf/blob/1.7.0/docs/CONFIGURATION.md#processor-configuration
  namepass = ["*procstat*"]
  fields = [
      "cpu_time_user",
      "cpu_usage",
      "memory_rss",
  ]

[[processors.regex]]
  namepass = ["*procstat*"]
  [[processors.regex.tags]]
    key = "process_name"
    pattern = "^(.{60}).*"
    replacement = "${1}..."
Also, notably, if you want to run this in docker, you must add the following settings for host's /proc to your docker-compose.yml (I think this will work only with proc_finder="native" as set above):
        volumes:
          - ./telegraf.conf:/etc/telegraf/telegraf.conf:ro
          - /proc:/rootfs/proc:ro
        environment:
          - HOST_PROC=/rootfs/proc
 akavel
on 2 Jul 2018
akavel
on 2 Jul 2018
@akavel So that looks good.
That file will grab every single procstat metric that passes through it, and group them into buckets using its tags. Then it will calculate the average of those fields over 10s (I think that is the default) and give you any metric that is in the top 10 buckets
So image that you are doing a top 1 over the field cpu_usage. If over 10s you get, for example:
name=rsyslog datacenter=2 cpu_usage=10
name=rsyslog datacenter=2 cpu_usage=5
name=docker datacenter=2 cpu_usage=1
name=docker datacenter=2 cpu_usage=2
It will create the name=docker datacenter=2 and name=rsyslog datacenter=2 buckets. The average for the metrics that fall in the first bucket is 7.5=(10+5)/2, and for the second one is 1.5=(1+2)/2. The top 1 is the name=rsyslog datacenter=2, so all the metrics in that bucket are returned.
The plugin will calcule the top k for using each of the fields, and ANY metrics that fall in the computed tops will be returned.
mirath
on 4 Jul 2018
It would be great to have some more info/examples on the topk plugin, and whether it's possible it integrate it into the telegraf dashboard for grafana :+1:
 mapleleafs89
on 5 Oct 2018
mapleleafs89
on 5 Oct 2018
I wanted my grafana to show the top X processes by CPU usage, and I'm now using this plugin to do just that.
A few people in this discussion asked about how to integrate this plugin's data in grafana. This is what I did, after adding the config sections from here. I made a new table panel on my dashboard, and under the metrics tab I created a query to show the information gathered by the TopK plugin.
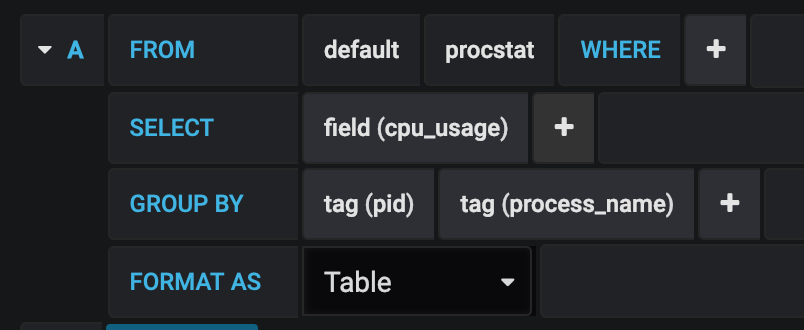
The resulting pane can be further customized for your needs.
Thanks for all the hard work in building this plugin, it has helped me out immensely!
 nivshah
on 30 Dec 2018
nivshah
on 30 Dec 2018
I've got this running, but having trouble getting the table show just the interval time sorted by CPU.
So for example, sample time is 10s. I want to see only the PIDs for that 10s interval and sort them by CPU usage so the TOP usage is at the top of the table.
With this I can go back in time and see what process is spiking the CPU based on my CPU graphs.
 bb512
on 14 Sep 2019
bb512
on 14 Sep 2019
@bb512 The best place to get help with this is on the InfluxData Community site.
danielnelson
on 14 Sep 2019
Related issues
 timhallinflux
·
3Comments
timhallinflux
·
3Comments
 mabushey
·
3Comments
mabushey
·
3Comments
 SongYg
·
3Comments
SongYg
·
3Comments
 Isonami
·
3Comments
Isonami
·
3Comments
 nsteinmetz
·
3Comments
nsteinmetz
·
3Comments
Most helpful comment
@mirath Could you please add some quick info/example here showing how to accomplish the original goal, as stated in the initial post, with your new topk plugin? I've tried to understand the plugin's docs, but they have a lot of settings, and I'm having trouble understanding how to actually "monitor the top n processes by cpu, memory or IO" with it... :( If you've already posted an example somewhere else (like a blog or something), it'd be super cool if you could at least add a link to the explanation here! :) Thanks!
edit: Or maybe put the example in the topk docs?
edit 2: Is it required to use TSI somehow with this plugin? Is TSI still considered experimental?
edit 3: OK, I sat on this and here's what I now have, seems to be working, though I'm not sure if it's really doing what I wanted. Not sure if the fields I picked are the correct ones too, and not sure how to get i/o stats:
Also, notably, if you want to run this in docker, you must add the following settings for host's
/procto your docker-compose.yml (I think this will work only withproc_finder="native"as set above):