Telegraf: [Feature request] ZFS Zpool properties on Linux
Feature Request
Currently, only FreeBSD has a zfs input plugin which reports zpool list properties. Linux should have this too ideally.
Proposal:
Using the existing inputs.zfs 'poolMetrics = true||false' option, to decide whether or not to try executing : '/bin/zpool list -Hp' and parsing the output like the FreeBSD code does.
Current behavior:
Only kstats are queried on Linux platforms, whereas FreeBSD queries both kstats and the userspace
'zpool list -Hp' command.
Desired behavior:
telegraf allowed to run 'zpool list' and collection of stats enabled :
Apr 03 20:55:40 nibbler telegraf : TTY=unknown ; PWD=/ ; USER=root ; COMMAND=/sbin/zpool list -Hp
> zfs_pool,host=nibbler,pool=rpool allocated=3695163326464i,capacity=92i,dedupratio=1,fragmentation=51i,free=290566324224i,health="ONLINE",size=3985729650688i 1527000570000000000
Use case:
Monitoring zpool health and fragmentation is a really useful metric for ZFS users,
as it can alert administrators to problems requiring urgent attention.
 tomtastic
All 46 comments
I think this only requires a minor re-write of the zfs_linux.go plugin code, and an explaination in the telegraf.conf inputs.zfs stanza
I have some working code currently which I will submit as a PR soon, does influxdata prefer single (merged) commits for PRs ?
tomtastic
on 3 Apr 2017
For commits you can leave them separate, when we merge PRs we generally squash them.
 danielnelson
on 3 Apr 2017
danielnelson
on 3 Apr 2017
Thanks @danielnelson.
I'm having a problem with another PR, circle-test.sh timing out whilst pulling docker.io/stealthly/docker-riemann (https://github.com/influxdata/telegraf/pull/2623)
Something I've done?
tomtastic
on 4 Apr 2017
I started a rebuild for it, we need to improve our test script to not pull the docker image all the time. If something like this happens again just leave a comment on the PR.
danielnelson
on 4 Apr 2017
Any update on your work, @tomtastic?
I've found this issue while trying to figure out if any of the detailed parameters that are collected by the existing zfs plugin actually yield (even if indirectly) any of the significantly more useful parameters like:
health-- ie: do I need to replace a hard drive?
- not sure how you would report this out via telegraf, anyway?
size-- current size of poolalloc-- amount of space used in poolfree-- amount of space free in poolfrag-- a rough measure of how fragmented the free space iscap-- capacity percentage that is used (ie: 0% = empty)
Several of these are what you are addressing with this issue (and your patch work), and I think they are significantly more useful than the low level stats that exist right now!
On the health reporting point... is there any way to get telegraf to report stats like this, or does it need to be a number? Simply enumerating the health states (ONLINE, DEGRADED, FAULTED,OFFLINE, UNAVAIL, REMOVED) could work and allow for simple alarms at the telegraf output destination, but I'm wondering what the norm is. End objective (for health) is really "which telegraf'd stat can I use to figure out if a device may need replacing in my pool"?
 rwarren
on 30 Jun 2017
rwarren
on 30 Jun 2017
Hi @rwarren, sorry for the very slow reply.
I have it working and reporting all the parameters you list above which I mostly view in grafana.

I'll pull my finger out and commit the code very shortly.
tomtastic
on 14 Jul 2017
@tomtastic -- awesome, thanks! Grafana is what I'm using for visuals as well, and that looks good. Hopefully your PR will be accepted.
rwarren
on 14 Jul 2017
You can test it from here : https://github.com/tomtastic/telegraf/tree/better_zpool_linux
I'm reminded looking at the code, that 'size, alloc, free, dedup' aren't presented currently as ZFSonLinux doesn't get the syntax for 'zpool list -Hp' (p for parsable) until version 0.7.0.
But we've the useful bits like fragmentation and health!
I need to write some unit tests for it all before I submit the PR.
tomtastic
on 14 Jul 2017
Having trouble getting the unit tests to build, I can run 'make test-short', but it only indicates the zfs plugin fails to build, no useful errors.
@danielnelson Is there anyone I could ask for help with the unit-tests here?
tomtastic
on 15 Jul 2017
I can try to help, can you paste the output here?
danielnelson
on 17 Jul 2017
Its quite likely the code for the unit tests is garbage, the required changes are small but I don't have enough knowledge of golang to make it any better.
ok      github.com/influxdata/telegraf/plugins/inputs/webhooks/papertrail       0.022s
ok      github.com/influxdata/telegraf/plugins/inputs/webhooks/rollbar  0.019s
?       github.com/influxdata/telegraf/plugins/inputs/win_perf_counters [no test files]
--- FAIL: TestZfsPoolMetrics (0.00s)
panic: runtime error: invalid memory address or nil pointer dereference [recovered]
        panic: runtime error: invalid memory address or nil pointer dereference
[signal SIGSEGV: segmentation violation code=0x1 addr=0x0 pc=0x65af8e]

goroutine 5 [running]:
testing.tRunner.func1(0xc42006ad00)
        /home/trcm/src/umake/go/go-lang/src/testing/testing.go:622 +0x29d
panic(0x6aa500, 0x852330)
        /home/trcm/src/umake/go/go-lang/src/runtime/panic.go:489 +0x2cf
github.com/influxdata/telegraf/plugins/inputs/zfs.(*Zfs).gatherPoolStats(0xc420045f58, 0x830dc0, 0xc420068ea0, 0x0, 0xc420015b00, 0x200000003, 0xc4200f61a0)
        /home/trcm/src/test/src/github.com/influxdata/telegraf/plugins/inputs/zfs/zfs_linux.go:19 +0x3e
github.com/influxdata/telegraf/plugins/inputs/zfs.(*Zfs).Gather(0xc420055f58, 0x830dc0, 0xc420068ea0, 0xc420085a58, 0xc420015ad0)
        /home/trcm/src/test/src/github.com/influxdata/telegraf/plugins/inputs/zfs/zfs_linux.go:101 +0x130
github.com/influxdata/telegraf/plugins/inputs/zfs.TestZfsPoolMetrics(0xc42006ad00)
        /home/trcm/src/test/src/github.com/influxdata/telegraf/plugins/inputs/zfs/zfs_linux_test.go:159 +0xe5a
testing.tRunner(0xc42006ad00, 0x70ec38)
        /home/trcm/src/umake/go/go-lang/src/testing/testing.go:657 +0x96
created by testing.(*T).Run
        /home/trcm/src/umake/go/go-lang/src/testing/testing.go:697 +0x2ca
FAIL    github.com/influxdata/telegraf/plugins/inputs/zfs       0.032s
ok      github.com/influxdata/telegraf/plugins/inputs/zookeeper 0.043s
Looks like Zfs.zpool is nil, but is being called on line 19 of gatherPoolStats.
danielnelson
on 19 Jul 2017
@tomtastic Any chance to get this moving again? ZFS could be really useful.
 mazhead
on 5 Oct 2017
mazhead
on 5 Oct 2017
I don't know enough Golang currently to fix the unit test code, sorry @mazhead.
But if you take the zfs plugin code from my branch https://github.com/tomtastic/telegraf/tree/better_zpool_linux you can compile up a working version, it's just the unit-tests I can't sort out for submitting the PR to get this merged.
tomtastic
on 5 Oct 2017
Parsing zpool output approach won't work well in practice. Also, it includes only a small fraction of the interesting info. The approach I've started taking that does work better is a zpool replacement that directly calls zfs ioctl and gets the information as nvlists. These are then written out as influxdb line protocol. This is called as an inputs.exec, but could also be a self-timed daemon.
For both zpool command and a zfs ioctl consumer, there is a blocking situation that can occur and must be dealt with: when the going gets tough, zpool command blocks. Timeouts already exist for inputs.exec and it is unclear to me if other telegraf agents inherit the timeouts feature in such a way that blocking in the zfs ioctl is properly handled.
Architecturally, is feels cumbersome to include a zfs ioctl caller as native golang agent. The ioctl interface is not a stable interface and will cause integration pain forever. By contrast, the zpool replacement can be distributed with the ZFSonLinux code, thus keeping up with the zfs ioctl changes thus keeping the interface boundary at the influxdb line protocol layer.
Thoughts?
 richardelling
on 14 Dec 2017
richardelling
on 14 Dec 2017
To spur the conversation, here's an example of the output of scan statistics collector:
zscanstat,function=scrub,pool=zwimming,state=finished end_ts=1510250221i,errors=0i,examined=115474432i,function="scrub",pass_examined=1i,pause_ts=0i,paused_t=0i,pct_done=100.03,processed=0i,rate=1i,remaining_t=0i,start_ts=1510250217i,state="finished",to_examine=115437568i,to_process=0i 1513214163000000000
it is simply not possible to get that data from screen-scraping zpool status output.
Of more interest to me personally, the performance histograms are stored as nvlist arrays.
richardelling
on 14 Dec 2017
Sounds great, have you already proposed the addition of your tool to the ZFSonLinux team? Will it output in line protocol directly?
danielnelson
on 14 Dec 2017
@danielnelson the tool outputs line protocol directly. I have not yet proposed it upstream, but it slides into the source tree nicely as a new command, so there aren't any conflicts with existing. To properly complete it, there is more work to complete and automated tests to be built.
Think of it as a goal of "zpool status + zpool iostat + zpool get" all rolled into one and output as influxdb line protocol.
richardelling
on 14 Dec 2017
That would be great for us, when you feel it is ready we can link to it from the zfs README as well.
danielnelson
on 14 Dec 2017
@richardelling I pretty much gave up on finishing the unit-test for my PR when you announced your work on this.
Do you have time to complete your tool and automated tests?
tomtastic
on 18 May 2018
Hi @tomtastic I have made some progress, but it is not clear that operating as a telegraf plugin is the best approach. Why? Because if there is a failure in the zfs.ko module or a pool becomes suspended then the data collection will hang indefinitely. This is also true for zpool status so you can't get around it by another method. So, rather than hang inside telegraf, it should still remain an external command writing in line protocol. I'll be able to get back on this RSN.
richardelling
on 22 May 2018
It's been just over one year since I had code to support getting better zpool properties on Linux and (now that Ubuntu and others are distributing zfsonlinux 0.7.0+) that code has zpool-property-feature-parity with the FreeBSD code.
If you don't think you're likely to have your external tools ready in the next three to six months, I'll dedicate some time to finishing the last bits necessary in zfs_linux_test.go, as it's about time this issue was closed off in my humble opinion.
tomtastic
on 22 May 2018
@tomtastic I've put an initial commit for zpool_influxdb collector to be used with telegraf's inputs.exec plugin. More testing required, of course.
I'm still concerned about how this will hang during some pool suspension events and how that could affect execs over prolonged time. This should be similar to hangs when you exec the zpool command. More testing under failure cases needed.
https://github.com/richardelling/zfs-linux-tools/tree/influxdb-wip/telegraf
richardelling
on 30 May 2018
@tomtastic: Somewhat unrelated to this PR, but... what plugin did you use for making that great "zpool status" table in Grafana? I'm trying to replicate it with no luck yet. I can't get rid of the Time column with the Table plugin, nor can I get the rows right.
rwarren
on 18 Jul 2018
@tomtastic Never mind... I finally figured it out as a combo of many things (using last() and an alias() for each metric, hiding the time column, etc).
I also mapped my zpool health to integers in rough order of severity so I could use thresholding and get proper alerting. This conversion of health to an integer is really useful should probably be done in this plugin as well!
My current panel state:
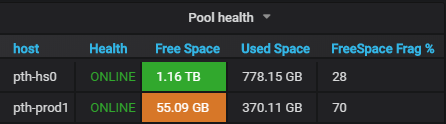
And here's how I did the health state integer mapping in order to enable alerts and colorizing (green for ONLINE, orange for DEGRADED, red for worse):

The generated zpool_health_int field is also easy to set up an alert for when the value differs from 0, as well as providing a clean historical chart to see when deviations happened and for how long. Not so easy with string fields. FWIW, I'm sending a value of 10 for unrecognized text values to future-proof it a bit.
rwarren
on 18 Jul 2018
@rwarren the "health" you see in zpool command output is actually derived from the internal
integers. But it isn't a direct value, there are too many conditions to make it an obvious result.
That said, do you think it would be beneficial for the ZFS collector to provide the raw numbers, too?
Or perhaps a syslog-like priority + severity tuple?
richardelling
on 18 Jul 2018
An additional severity level would work, but I decided to merged severity
with the code (by sorting them) so I could easily see durations for a
certain status on a chart.
After sleeping on it I now think I should have gone with larger ints to
allow clean non-float room for future status enums. e.g. 0 for ONLINE, 11
for DEGRADED, then 21, 22, 23, etc for the error conditions. I think this
is better and I'm going to change to this.
BTW - I have this hacked together in a Python cronjob since I unfortunately
don't know Go and can't currently take the time to learn it.
rwarren
on 18 Jul 2018
Thanks rwarren, cool use of Grafana, could you pop your panel JSON for that into a gist for me ?
Or drop me an email, whatever is easier.
tomtastic
on 18 Jul 2018
Why is this issue closed? :)
I can still not see basic stats as _allocated_, _capacity_, _size_, _fragmentation_, and _free_ on zfs_pool in Linux. Or is just the documentation outdated?
Would be extremely nice to have this feature in telegraf.
 soofstad
on 30 Nov 2018
soofstad
on 30 Nov 2018
@soofstad This issue is still open.
danielnelson
on 30 Nov 2018
@soofstad, We had a working solution to bring Linux zpool properties inline with the current BSD solution last year, but I couldn't get anyone to help with the unit tests.
@richardelling then proposed his own separate way, so I think we're still waiting for that.
tomtastic
on 3 Dec 2018
My current solution is an exec script that regularly execute zpool list -Hp and format it in JSON
 nyanloutre
on 3 Dec 2018
nyanloutre
on 3 Dec 2018
@soofstad can you test this: https://github.com/richardelling/zpool_influxdb
richardelling
on 3 Dec 2018
I will have a look :D
soofstad
on 4 Dec 2018
My current solution is an exec script that regularly execute
zpool list -Hpand format it in JSON
@nyanloutre Would you mind posting your script?
 ddimick
on 3 May 2019
ddimick
on 3 May 2019
@ddimick You weren't asking me, but here is the script I cobbled together back then to get push the zfs data I wanted to influxdb:
https://gist.github.com/rwarren/786fc4f1cc3abc067082f8812c669ed1
It may not be perfect, but that has been working ok for me for quite a while now. The data is only a limited set of what I care about monitoring (together with a a few things specific to my use case), but hopefully it is a useful starting point.
rwarren
on 3 May 2019
@ddimick If you want a simple script :
import json
from subprocess import check_output

columns = ["NAME", "SIZE", "ALLOC", "FREE", "EXPANDSZ", "FRAG", "CAP", "DEDUP", "HEALTH", "ALTROOT"]
health = {'ONLINE':0, 'DEGRADED':11, 'OFFLINE':21, 'UNAVAIL':22, 'FAULTED':23, 'REMOVED':24}

stdout = check_output(["${pkgs.zfs}/bin/zpool", "list", "-Hp"],encoding='UTF-8').split('\n')
parsed_stdout = list(map(lambda x: dict(zip(columns,x.split('\t'))), stdout))[:-1]

for pool in parsed_stdout:
    for item in pool:
        if item in ["SIZE", "ALLOC", "FREE", "FRAG", "CAP"]:
            pool[item] = int(pool[item])
        if item in ["DEDUP"]:
            pool[item] = float(pool[item])
        if item == "HEALTH":
            pool[item] = health[pool[item]]

print(json.dumps(parsed_stdout))
@nyanloutre Thank you, exactly what I was looking for.
ddimick
on 4 May 2019
@danielnelson can you please merge https://github.com/influxdata/telegraf/pull/6724 which will close this feature request ?
 yvasiyarov
on 10 Jan 2020
yvasiyarov
on 10 Jan 2020
Thank you for this @yvasiyarov, I'm very happy you've closed this issue :)
I might add it's a shame that rather than receiving any help/collaboration 2.5 years ago with the unit tests on my (otherwise working) code to close this issue, we ended up waiting for someone to re-write it in a way they preferred, but seemingly never released.
This wasn't helpful in making me want to continue contributing to Influxdata,... and probably has that affect to others too.
tomtastic
on 10 Jan 2020
After such a long time it's probably easier to rewrite than to update.
But now that's done can we close this and merge the other pull-request? I've been waiting for this for almost 3 years now 😄.
 RafaelSchridi
on 10 Jan 2020
RafaelSchridi
on 10 Jan 2020
Happily closing this!
tomtastic
on 10 Jan 2020
@tomtastic please do not close the future request until PR is get merged.
Its not yet merged as of now. We need help from @danielnelson here
yvasiyarov
on 10 Jan 2020
Looking forward to this.
 peterdk
on 1 Feb 2020
peterdk
on 1 Feb 2020
I see that this is closed, but this still doesn't not seem to have been merged, has it?!
 lastb0isct
on 7 Jan 2021
lastb0isct
on 7 Jan 2021
FYI, a zpool_influxdb command has been added to the OpenZFS upstream master branch. It is integrated into the CI/CD system and should be available in future builds automatically. See https://github.com/openzfs/zfs/tree/master/cmd/zpool_influxdb
richardelling
on 7 Jan 2021
Related issues
 SongYg
·
3Comments
SongYg
·
3Comments
 Isonami
·
3Comments
Isonami
·
3Comments
 fahimeh2010
·
3Comments
fahimeh2010
·
3Comments
 robert-gomes
·
3Comments
robert-gomes
·
3Comments
 Bregor
·
3Comments
Bregor
·
3Comments
Most helpful comment
FYI, a
zpool_influxdbcommand has been added to the OpenZFS upstream master branch. It is integrated into the CI/CD system and should be available in future builds automatically. See https://github.com/openzfs/zfs/tree/master/cmd/zpool_influxdb