Tasmota: Sonoff POW Incorrectly Reporting Far Higher Wattage It Should Be (Wattage>V*I)
Sonoff reports relatively high wattage, almost a order of magnitude higher than current and voltage would suggest.
- [x] Searched the problem in issues and in the wiki
- [x] Hardware used : Sonoff Pow v1
- [x] Provide the output of command
status 0:
11:14:04 MQT: stat/sonoff-pow/STATUS = {"Status":{"Module":6,"FriendlyName":"Sonoff Pow","Topic":"sonoff-pow","ButtonTopic":"0","Power":1,"PowerOnState":3,"LedState":1,"SaveData":1,"SaveState":1,"ButtonRetain":0,"PowerRetain":0}}
11:14:04 MQT: stat/sonoff-pow/STATUS1 = {"StatusPRM":{"Baudrate":115200,"GroupTopic":"sonoffs","OtaUrl":"http://domus1:80/api/arduino/sonoff-pow.ino.bin","Uptime":"6T22:00:50","Sleep":0,"BootCount":19,"SaveCount":130,"SaveAddress":"FA000"}}
11:14:04 MQT: stat/sonoff-pow/STATUS2 = {"StatusFWR":{"Version":"5.12.0","BuildDateTime":"2018-04-26T16:25:52","Boot":31,"Core":"2_4_1","SDK":"2.2.1(cfd48f3)"}}
11:14:04 MQT: stat/sonoff-pow/STATUS3 = {"StatusLOG":{"SerialLog":2,"WebLog":2,"SysLog":2,"LogHost":"xxxxxxxxx","LogPort":xxx,"SSId1":"xxxx","SSId2":"x","TelePeriod":10,"SetOption":"00000009"}}
11:14:04 MQT: stat/sonoff-pow/STATUS4 = {"StatusMEM":{"ProgramSize":495,"Free":508,"Heap":19,"ProgramFlashSize":1024,"FlashSize":4096,"FlashMode":3}}
11:14:04 MQT: stat/sonoff-pow/STATUS5 = {"StatusNET":{"Hostname":"sonoff-pow-1476","IPAddress":"192.168.0.80","Gateway":"192.168.0.1","Subnetmask":"255.255.255.0","DNSServer":"192.168.0.1","Mac":"00:00:00:00:00:00","Webserver":2,"WifiConfig":3}}
11:14:04 MQT: stat/sonoff-pow/STATUS6 = {"StatusMQT":{"MqttHost":"192.168.0.3","MqttPort":1883,"MqttClientMask":"DVES_%06X","MqttClient":"DVES_5E05C4","MqttUser":"xxxx","MAX_PACKET_SIZE":1000,"KEEPALIVE":15}}
11:14:04 MQT: stat/sonoff-pow/STATUS7 = {"StatusTIM":{"UTC":"Sun Jul 15 23:14:04 2018","Local":"Mon Jul 16 11:14:04 2018","StartDST":"Sun Mar 25 02:00:00 2018","EndDST":"Sun Oct 28 03:00:00 2018","Timezone":12}}
11:14:04 MQT: stat/sonoff-pow/STATUS9 = {"StatusPTH":{"PowerLow":0,"PowerHigh":0,"VoltageLow":0,"VoltageHigh":0,"CurrentLow":0,"CurrentHigh":0}}
11:14:04 MQT: stat/sonoff-pow/STATUS10 = {"StatusSNS":{"Time":"2018-07-16T11:14:04","ENERGY":{"Total":51.865,"Yesterday":0.757,"Today":0.048,"Power":4,"Factor":0.33,"Voltage":222,"Current":0.047}}}
11:14:04 MQT: stat/sonoff-pow/STATUS11 = {"StatusSTS":{"Time":"2018-07-16T11:14:04","Uptime":"6T22:00:50","Vcc":3.480,"POWER":"ON","Wifi":{"AP":1,"SSId":"xxxx","RSSI":100,"APMac":"00:00:00:00:00:00"}}}
To Reproduce
Wait for erroneous energy reading where wattage>V*I
Expected behavior
Wattage = Current * Voltage
Screenshots
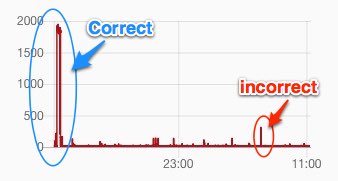
Additional context
Syslog output showing incorrect reading of 310w when V*I= 40.8w (and message received before and after):
Correct: ESP-MQT: tele/sonoff-pow/SENSOR = {"Time":"2018-07-16T06:43:49","ENERGY":{"Total":51.846,"Yesterday":0.757,"Today":0.029,"Period":0,"Power":4,"Factor":0.24,"Voltage":239,"Current":0.073}}

Incorrect: ESP-MQT: tele/sonoff-pow/SENSOR = {"Time":"2018-07-16T06:43:39","ENERGY":{"Total":51.846,"Yesterday":0.757,"Today":0.029,"Period":0,"Power":310,"Factor":1.00,"Voltage":240,"Current":0.170}}

Correct: ESP-MQT: tele/sonoff-pow/SENSOR = {"Time":"2018-07-16T06:43:29","ENERGY":{"Total":51.846,"Yesterday":0.757,"Today":0.029,"Period":0,"Power":4,"Factor":0.27,"Voltage":240,"Current":0.060}}
This happens once every two days.
 newzealandpaul
All 24 comments
What is on the circuit?
While power for AC is not so simple as V*A. The wrong value does appear to be wrong, but maybe there is a very short transient user of power.
 Frogmore42
on 16 Jul 2018
Frogmore42
on 16 Jul 2018
Plugged into them a washing machine and a dyer (and of course the Sonoff). Neither are on when this happens. Neither are sophisticated models. I can't be 100% sure neither wakes up for some reason, but even if they do, I doubt they could be drawing 300W without engaging motors or heating elements which they are definitely not doing.
Before the sonoff I had Xiaomi plug that reported power, and it never reported these high transient power draws.
newzealandpaul
on 16 Jul 2018
Upgrade to latest release and report back
 arendst
on 16 Jul 2018
arendst
on 16 Jul 2018
I have upgraded and will monitor it to see if it does it again.
newzealandpaul
on 16 Jul 2018
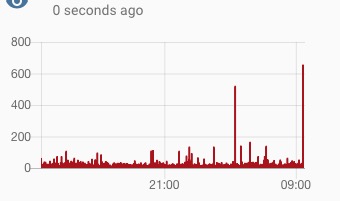
I has happened twice in the past 6 hours. Both times it happens the power factor is 1. Both appliances were turned off (but plugged in). Both times the power should have been 20w or less based on the current reported (and alleged power factor).
ESP-MQT: tele/sonoff-pow/SENSOR = {"Time":"2018-07-18T09:39:26","ENERGY":{"Total":51.978,"Yesterday":0.103,"Today":0.041,"Power":653,"Factor":1.00,"Voltage":222,"Current":0.068}}

ESP-MQT: tele/sonoff-pow/SENSOR = {"Time":"2018-07-18T03:28:35","ENERGY":{"Total":51.952,"Yesterday":0.103,"Today":0.015,"Power":517,"Factor":1.00,"Voltage":239,"Current":0.087}}
Just want to say how much love Sonoff-Tasmota and all the hard work that goes into it. This bug report it not a criticism of this wonderful project.
newzealandpaul
on 17 Jul 2018
Forgot to add I am now running version 6.1.1 and was running this version when those above spikes happened.
newzealandpaul
on 17 Jul 2018
Did you do the calibration listed on the page for POW?
Mine were waaay off too, but I plugged in a 100w incandescent bulb and a multimeter in the other outlet (for voltage) then used:
VoltageSet [multimeter reading]
PowerSet 100
CurrentSet [100/Volts]
https://github.com/arendst/Sonoff-Tasmota/wiki/Sonoff-Pow-and-Pow-R2
 Test-subj
on 21 Jul 2018
Test-subj
on 21 Jul 2018
Thanks for the suggestion but I have calibrated with both voltage readings and current readings from a calibrated multimeter.
What makes no sense is that the Wattage does not equal the current, voltage and power factor. It makes no sense.
newzealandpaul
on 21 Jul 2018
Since it seems to be happening fairly reliably in your configuration, there are some things to try, but none are particularly easy.
First, there is no data available about exactly how the power measurement is done. Like any measurement, it is subject to errors. That data indicate that you have an unusual load, by that I mean a non ideal resistance and probably not purely capacitive or inductive. This means it is likely that the assumptions that the chip designer made are not valid. You are also operating at the lower limit of the resolution of the measurement, which makes errors more likely.
So, the first thing to do is see if it is load related. Here are some things to try.
- Add a 100W incandescent light bulb to the circuit and see if you get any more strange readings.
- Remove all of the load and see if you get any strange readings.
The other possibility is that the communication is getting corrupted. If this is the case, both of the above tests should show strange readings also. I believe you can increase the logging level and Tasmota will log the data it got and you can look and see how it is different. The difference could be because the chip sent it that way or it could be that Tasmota interpreted it that way.
Or, you could just ignore readings that significantly different for a single sample. It all depends on what you are doing with the data.
Frogmore42
on 21 Jul 2018
If you keep getting these spikes I'm afraid you'll have to go for the Pow R2 which uses a different energy measuring system.
The "old" Pow uses the HLW8012 energy sensor. This device measures power, voltage and current using some kind of PWM.
- The device monitors voltage OR current and provides a PWM signal on a pin, used for both Voltage and Current, which Tasmota tries to decode using an interrupt routine and local timing. As both voltage and current provide a high PWM frequency these signals are probed ten times before calculating the value.
- The device monitors power and depending on the amount of load it provides a PWM signal on another pin connected to the ESP8266 chip which Tasmota tries to decode using an interrupt routine and timing. The shorter the PWM pulses the more power is used. A low power pulse, like 2W can take 2 seconds. This is the reason why only the single pulse is returned as there is no time to analyse up to ten pulses as that could take up to 20 seconds...
From the above you see that Voltage measured will never be at the same time as Current measurement but that does not amount to your problem.
When, for some reason the Power measuring interrupt routine gets quick responses it will return a much higher value than would be expected. The only way of solving this is analyzing values over time allowing to remove the spikes.
Power factor calculation is done by Tasmota and is nothing more than deviding the measured power by voltage times current with a maximum of 1 as a power factor should be between 0 and 1.
The Pow R2, and S31 contain a measuring chip which provides all data via serial to Tasmota relieving Tasmota from any measuring and therefore provides better results.
arendst
on 23 Jul 2018
@arendst That is extremely interesting. Thanks for sharing. I had no idea what a mission is was to use the old R1. I wish I had purchased the R2 version. I am going to have to order a couple of them.
newzealandpaul
on 24 Jul 2018
Hi,
As you question has been addressed, closing this issue. Please, ask to reopen if you think it is needed. Thanks.
 ascillato2
on 25 Jul 2018
ascillato2
on 25 Jul 2018
I have a POW R2 running Tasmota v6.1.1 between my outlet and my fridge.
Every time my fridge starts its cooling cicle, i got measuments like these (Telemetry period=60):
04:27:03 MQT: tele/sonoff-05/SENSOR = {"Time":"2018-07-21T04:27:03","ENERGY":{"Total":3.487,"Yesterday":1.130,"Today":0.682,"Period":0,"Power":0,"Factor":0.00,"Voltage":126,"Current":0.000}}
04:28:03 MQT: tele/sonoff-05/SENSOR = {"Time":"2018-07-21T04:28:03","ENERGY":{"Total":3.487,"Yesterday":1.130,"Today":0.682,"Period":0,"Power":0,"Factor":0.00,"Voltage":126,"Current":0.000}}
04:28:26 MQT: tele/sonoff-05/SENSOR = {"Time":"2018-07-21T04:28:26","ENERGY":{"Total":3.487,"Yesterday":1.130,"Today":0.682,"Power":1451,"Factor":1.00,"Voltage":126,"Current":0.035}}
04:28:27 MQT: tele/sonoff-05/SENSOR = {"Time":"2018-07-21T04:28:27","ENERGY":{"Total":3.487,"Yesterday":1.130,"Today":0.683,"Power":173,"Factor":1.00,"Voltage":125,"Current":2.410}}
04:29:04 MQT: tele/sonoff-05/SENSOR = {"Time":"2018-07-21T04:29:04","ENERGY":{"Total":3.489,"Yesterday":1.130,"Today":0.685,"Period":3,"Power":166,"Factor":0.54,"Voltage":125,"Current":2.468}}
04:30:04 MQT: tele/sonoff-05/SENSOR = {"Time":"2018-07-21T04:30:04","ENERGY":{"Total":3.492,"Yesterday":1.130,"Today":0.688,"Period":3,"Power":157,"Factor":0.52,"Voltage":125,"Current":2.442}}
04:31:05 MQT: tele/sonoff-05/SENSOR = {"Time":"2018-07-21T04:31:05","ENERGY":{"Total":3.494,"Yesterday":1.130,"Today":0.690,"Period":3,"Power":156,"Factor":0.51,"Voltage":125,"Current":2.437}}
At 04:28:26 we have a 1451W measurement (in the original itead software I used to observe something around 160W, so the other measurements seems to be ok).
As long I send these values directly to home assistant, I get a plot with all these spikes:
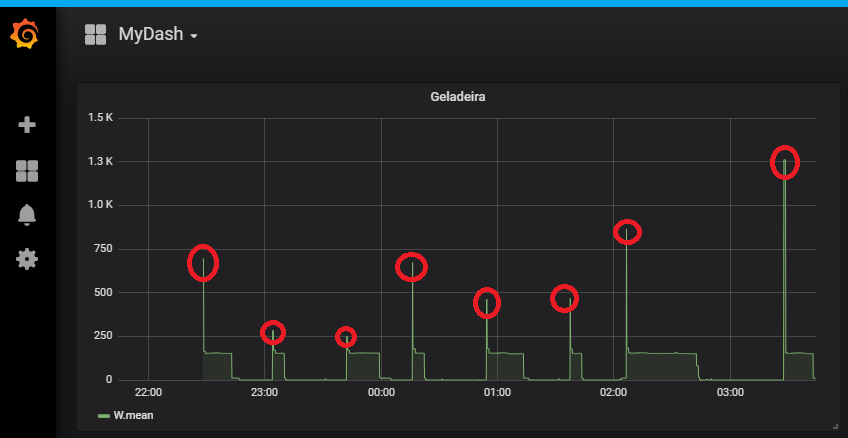
Is there a way to smooth or not report such measurements is tasmota? I guess that´s what SonOff original sw does.
 diegoasth
on 14 Aug 2018
diegoasth
on 14 Aug 2018
@ascillato2 can we reopen it?
diegoasth
on 15 Aug 2018
Smoothing won't really work because the spikes are so high.
On Tue, 14 Aug 2018 at 18:50, diegoasth notifications@github.com wrote:
I have a POW R2 running Tasmota v6.1.1 between my outlet and my fridge.
Every time my fridge starts its cooling cicle, i got measuments like these:04:27:03 MQT: tele/sonoff-05/SENSOR = {"Time":"2018-07-21T04:27:03","ENERGY":{"Total":3.487,"Yesterday":1.130,"Today":0.682,"Period":0,"Power":0,"Factor":0.00,"Voltage":126,"Current":0.000}}
04:28:03 MQT: tele/sonoff-05/SENSOR = {"Time":"2018-07-21T04:28:03","ENERGY":{"Total":3.487,"Yesterday":1.130,"Today":0.682,"Period":0,"Power":0,"Factor":0.00,"Voltage":126,"Current":0.000}}
04:28:26 MQT: tele/sonoff-05/SENSOR = {"Time":"2018-07-21T04:28:26","ENERGY":{"Total":3.487,"Yesterday":1.130,"Today":0.682,"Power":1451,"Factor":1.00,"Voltage":126,"Current":0.035}}
04:28:27 MQT: tele/sonoff-05/SENSOR = {"Time":"2018-07-21T04:28:27","ENERGY":{"Total":3.487,"Yesterday":1.130,"Today":0.683,"Power":173,"Factor":1.00,"Voltage":125,"Current":2.410}}
04:29:04 MQT: tele/sonoff-05/SENSOR = {"Time":"2018-07-21T04:29:04","ENERGY":{"Total":3.489,"Yesterday":1.130,"Today":0.685,"Period":3,"Power":166,"Factor":0.54,"Voltage":125,"Current":2.468}}
04:30:04 MQT: tele/sonoff-05/SENSOR = {"Time":"2018-07-21T04:30:04","ENERGY":{"Total":3.492,"Yesterday":1.130,"Today":0.688,"Period":3,"Power":157,"Factor":0.52,"Voltage":125,"Current":2.442}}
04:31:05 MQT: tele/sonoff-05/SENSOR = {"Time":"2018-07-21T04:31:05","ENERGY":{"Total":3.494,"Yesterday":1.130,"Today":0.690,"Period":3,"Power":156,"Factor":0.51,"Voltage":125,"Current":2.437}}At 04:28:26 we have a 1451W measurement.
As long I send these values directly to home assistant, I get a plot like
these:
[image: image]
https://user-images.githubusercontent.com/2896405/44075873-af200366-9f74-11e8-9d38-b62604889327.pngIs there a way to smooth or not report such measurements is tasmota? I
guess that´s what SonOff original sw does.—
You are receiving this because you authored the thread.
Reply to this email directly, view it on GitHub
https://github.com/arendst/Sonoff-Tasmota/issues/3232#issuecomment-412772184,
or mute the thread
https://github.com/notifications/unsubscribe-auth/AAAlyGNFXhTMk5cllIr7a12ptYeoAqoLks5uQnMkgaJpZM4VQbpN
.
newzealandpaul
on 15 Aug 2018
Are you sure the new reading is wrong?
Many devices have a very large starting surge, especially ones with a motor like a refrigerator.
As the saying goes, a man with one clock always knows what time it is. A man with two is never really sure.
Frogmore42
on 15 Aug 2018
I agree 100% @Frogmore42 about the surges, but generally when the motor starts we have a current surge as well, but in the measurement we have only 0.035A, which is very low.
"Power":1451,"Factor":1.00,"Voltage":126,"Current":0.035
I could not measure such current peak with my multimeter (maybe it is too slow...)
Different to v1, the v2 I use has a better sampling circuitry (if I understood mr @arendst correctelly) so it would be able to measure voltage and current at the same time, in a way that W ~ V x A x PowerFactor.
See: https://en.wikipedia.org/wiki/AC_power#Power_factor
I tried to use one of the MaxPower* commands to filter these peaks but then I found that they are for that.
diegoasth
on 15 Aug 2018
any ideas mr @arendst?
diegoasth
on 21 Aug 2018
Hi
@diegoasth
Can you connect your POW R2 to another device to test it (like your washer machine)?
For a fridge compressor, those spikes are more/less ok. How old are your fridge?
 ascillato
on 21 Aug 2018
ascillato
on 21 Aug 2018
@ascillato2 can we reopen it?
Your issue is with a Sonoff POW R2. This issue was with a Sonoff POW. If you want, open a new issue with the troubleshooting template complete. Thanks.
ascillato
on 21 Aug 2018
Makes sense! Thank you.
diegoasth
on 21 Aug 2018
Diegoasth
I've been experiencing the same issues with my POW as it is tripping my automation system, it measures current for a dryer. I think from reading your thread and my own experiences, we need to go down the POW R2 track.....
 petez69
on 6 Sep 2018
petez69
on 6 Sep 2018
My POW does not have these spikes. It is a R1 version connected to Receiver, Television, Computer. Anyhow, I see that the Integral over the POWER value is e.g. 0.6kWh while the reported total energy in the same timeframe is 0.3kWh with a Power factor of nearly 0.5. Can someone confirm, that the POWER is NOT the real power but the apparent power? From the discussion above I assumed this is already inside the calculation.
 stefanbode
on 12 Sep 2018
stefanbode
on 12 Sep 2018
I had four POW R1 with version 5.10 and never noticed problem with spikes. Maybe because there was not command PowerDelta and spike didn't occur at teleperiod trigger.
Now I install version 6.6.0.3 and there are periodical spikes repeated cca each 5 min. I connected multimeter and there is no spike in current.
I noticed this when current and power I added into recorder in HA.
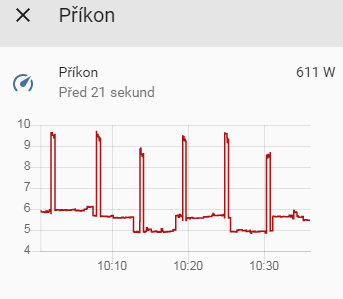
Graph of current during day
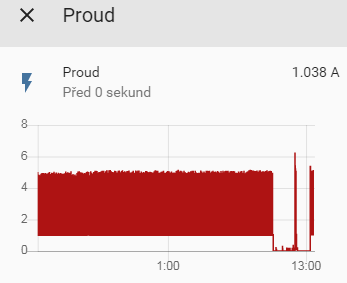
On console I noticed that wrong Current and Power occurs when Period has value greather than 1. What does the Period mean? I looks like Current and Power is multiplied by this Period.
12:07:16 MQT: tele/home211/STATE = {"Time":"2019-07-28T12:07:16","Epoch":1564308436,"Uptime":"1T18:28:06","UptimeSec":152886,"Vcc":3.186,"Heap":19,"SleepMode":"Dynamic","Sleep":0,"LoadAvg":999,"POWER":"ON","Wifi":{"AP":1,"SSId":"mkh","BSSId":"84:16:F9:F3:D7:DC","Channel":9,"RSSI":34,"LinkCount":1,"Downtime":"0T00:00:03"}}
12:07:16 MQT: tele/home211/SENSOR = {"Time":"2019-07-28T12:07:16","Epoch":1564308436,"ENERGY":{"TotalStartTime":"2019-07-26T00:00:00","Total":483.426,"Yesterday":7.308,"Today":3.176,"Period":4,"Power":1077,"ApparentPower":1127,"ReactivePower":332,"Factor":0.96,"Voltage":230,"Current":4.906}}
12:07:28 MQT: tele/home211/STATE = {"Time":"2019-07-28T12:07:28","Epoch":1564308448,"Uptime":"1T18:28:18","UptimeSec":152898,"Vcc":3.186,"Heap":19,"SleepMode":"Dynamic","Sleep":0,"LoadAvg":999,"POWER":"ON","Wifi":{"AP":1,"SSId":"mkh","BSSId":"84:16:F9:F3:D7:DC","Channel":9,"RSSI":34,"LinkCount":1,"Downtime":"0T00:00:03"}}
12:07:28 MQT: tele/home211/SENSOR = {"Time":"2019-07-28T12:07:28","Epoch":1564308448,"ENERGY":{"TotalStartTime":"2019-07-26T00:00:00","Total":483.429,"Yesterday":7.308,"Today":3.180,"Period":4,"Power":1062,"ApparentPower":1106,"ReactivePower":311,"Factor":0.96,"Voltage":230,"Current":4.807}}
12:07:31 WIF: Checking connection...
12:07:31 WIF: Connected
12:07:31 MQT: tele/home211/SENSOR = {"Time":"2019-07-28T12:07:31","Epoch":1564308451,"ENERGY":{"TotalStartTime":"2019-07-26T00:00:00","Total":483.430,"Yesterday":7.308,"Today":3.181,"Power":249,"ApparentPower":1130,"ReactivePower":1102,"Factor":0.22,"Voltage":236,"Current":4.792}}
12:07:40 MQT: tele/home211/STATE = {"Time":"2019-07-28T12:07:40","Epoch":1564308460,"Uptime":"1T18:28:30","UptimeSec":152910,"Vcc":3.186,"Heap":19,"SleepMode":"Dynamic","Sleep":0,"LoadAvg":999,"POWER":"ON","Wifi":{"AP":1,"SSId":"mkh","BSSId":"84:16:F9:F3:D7:DC","Channel":9,"RSSI":34,"LinkCount":1,"Downtime":"0T00:00:03"}}
12:07:40 MQT: tele/home211/SENSOR = {"Time":"2019-07-28T12:07:40","Epoch":1564308460,"ENERGY":{"TotalStartTime":"2019-07-26T00:00:00","Total":483.431,"Yesterday":7.308,"Today":3.181,"Period":1,"Power":245,"ApparentPower":245,"ReactivePower":0,"Factor":1.00,"Voltage":236,"Current":1.038}}
12:07:52 MQT: tele/home211/STATE = {"Time":"2019-07-28T12:07:52","Epoch":1564308472,"Uptime":"1T18:28:42","UptimeSec":152922,"Vcc":3.186,"Heap":19,"SleepMode":"Dynamic","Sleep":0,"LoadAvg":999,"POWER":"ON","Wifi":{"AP":1,"SSId":"mkh","BSSId":"84:16:F9:F3:D7:DC","Channel":9,"RSSI":34,"LinkCount":1,"Downtime":"0T00:00:03"}}
12:07:52 MQT: tele/home211/SENSOR = {"Time":"2019-07-28T12:07:52","Epoch":1564308472,"ENERGY":{"TotalStartTime":"2019-07-26T00:00:00","Total":483.432,"Yesterday":7.308,"Today":3.182,"Period":1,"Power":245,"ApparentPower":245,"ReactivePower":0,"Factor":1.00,"Voltage":236,"Current":1.039}}
12:07:55 WIF: Checking connection...
12:07:55 WIF: Connected
12:08:04 MQT: tele/home211/STATE = {"Time":"2019-07-28T12:08:04","Epoch":1564308484,"Uptime":"1T18:28:54","UptimeSec":152934,"Vcc":3.186,"Heap":19,"SleepMode":"Dynamic","Sleep":0,"LoadAvg":999,"POWER":"ON","Wifi":{"AP":1,"SSId":"mkh","BSSId":"84:16:F9:F3:D7:DC","Channel":9,"RSSI":34,"LinkCount":1,"Downtime":"0T00:00:03"}}
12:08:04 MQT: tele/home211/SENSOR = {"Time":"2019-07-28T12:08:04","Epoch":1564308484,"ENERGY":{"TotalStartTime":"2019-07-26T00:00:00","Total":483.432,"Yesterday":7.308,"Today":3.183,"Period":1,"Power":246,"ApparentPower":246,"ReactivePower":0,"Factor":1.00,"Voltage":237,"Current":1.039}}
12:08:17 MQT: tele/home211/STATE = {"Time":"2019-07-28T12:08:16","Epoch":1564308496,"Uptime":"1T18:29:06","UptimeSec":152946,"Vcc":3.186,"Heap":19,"SleepMode":"Dynamic","Sleep":0,"LoadAvg":999,"POWER":"ON","Wifi":{"AP":1,"SSId":"mkh","BSSId":"84:16:F9:F3:D7:DC","Channel":9,"RSSI":34,"LinkCount":1,"Downtime":"0T00:00:03"}}
12:08:17 MQT: tele/home211/SENSOR = {"Time":"2019-07-28T12:08:17","Epoch":1564308497,"ENERGY":{"TotalStartTime":"2019-07-26T00:00:00","Total":483.433,"Yesterday":7.308,"Today":3.184,"Period":1,"Power":248,"ApparentPower":248,"ReactivePower":0,"Factor":1.00,"Voltage":236,"Current":1.050}}
12:08:20 WIF: Checking connection...
There are also records where field Period is missing. Is this for case when record is generated by PowerDelta trigger?
12:07:16 MQT: tele/home211/SENSOR = {"Time":"2019-07-28T12:07:16","Epoch":1564308436,"ENERGY":{"TotalStartTime":"2019-07-26T00:00:00","Total":483.426,"Yesterday":7.308,"Today":3.176,"Period":4,"Power":1077,"ApparentPower":1127,"ReactivePower":332,"Factor":0.96,"Voltage":230,"Current":4.906}}
12:07:31 MQT: tele/home211/SENSOR = {"Time":"2019-07-28T12:07:31","Epoch":1564308451,"ENERGY":{"TotalStartTime":"2019-07-26T00:00:00","Total":483.430,"Yesterday":7.308,"Today":3.181,"Power":249,"ApparentPower":1130,"ReactivePower":1102,"Factor":0.22,"Voltage":236,"Current":4.792}}
12:08:04 MQT: tele/home211/SENSOR = {"Time":"2019-07-28T12:08:04","Epoch":1564308484,"ENERGY":{"TotalStartTime":"2019-07-26T00:00:00","Total":483.432,"Yesterday":7.308,"Today":3.183,"Period":1,"Power":246,"ApparentPower":246,"ReactivePower":0,"Factor":1.00,"Voltage":237,"Current":1.039}}


12:09:55 MQT: tele/home211/STATE = {"Time":"2019-07-28T12:09:55","Epoch":1564308595,"Uptime":"1T18:30:45","UptimeSec":153045,"Vcc":3.186,"Heap":19,"SleepMode":"Dynamic","Sleep":50,"LoadAvg":586,"POWER":"OFF","Wifi":{"AP":1,"SSId":"mkh","BSSId":"84:16:F9:F3:D7:DC","Channel":9,"RSSI":34,"LinkCount":1,"Downtime":"0T00:00:03"}}
12:09:55 MQT: tele/home211/SENSOR = {"Time":"2019-07-28T12:09:55","Epoch":1564308595,"ENERGY":{"TotalStartTime":"2019-07-26T00:00:00","Total":483.440,"Yesterday":7.308,"Today":3.191,"Period":1,"Power":23,"ApparentPower":23,"ReactivePower":0,"Factor":1.00,"Voltage":237,"Current":0.099}}
12:09:57 MQT: tele/home211/SENSOR = {"Time":"2019-07-28T12:09:57","Epoch":1564308597,"ENERGY":{"TotalStartTime":"2019-07-26T00:00:00","Total":483.440,"Yesterday":7.308,"Today":3.191,"Power":24,"ApparentPower":24,"ReactivePower":0,"Factor":1.00,"Voltage":239,"Current":0.099}}
 mkh595
on 28 Jul 2019
mkh595
on 28 Jul 2019
Related issues
 j4k3
·
3Comments
j4k3
·
3Comments
 belidzs
·
3Comments
belidzs
·
3Comments
 ximonline
·
3Comments
ximonline
·
3Comments
 wirelesssolution
·
3Comments
wirelesssolution
·
3Comments
 JoergZ2
·
3Comments
JoergZ2
·
3Comments
Most helpful comment
If you keep getting these spikes I'm afraid you'll have to go for the Pow R2 which uses a different energy measuring system.
The "old" Pow uses the HLW8012 energy sensor. This device measures power, voltage and current using some kind of PWM.
From the above you see that Voltage measured will never be at the same time as Current measurement but that does not amount to your problem.
When, for some reason the Power measuring interrupt routine gets quick responses it will return a much higher value than would be expected. The only way of solving this is analyzing values over time allowing to remove the spikes.
Power factor calculation is done by Tasmota and is nothing more than deviding the measured power by voltage times current with a maximum of 1 as a power factor should be between 0 and 1.
The Pow R2, and S31 contain a measuring chip which provides all data via serial to Tasmota relieving Tasmota from any measuring and therefore provides better results.