Taichi: [Mac] GUI::update had a big variance on different MBP models
Describe the bug
While profiling the Metal backend, I noticed that the bottleneck is actually around gui.show(). Below I listed the profiling data of mpm99.py:
2015 MBP 13-inch model:
metal Profiler
[  0.61%] mtl_k0011_substep_c4_0__0_dispatch           min   0.006 ms   avg   0.012 ms    max   0.567 ms   total   0.059 s [   4940x]
[  0.38%] mtl_k0011_substep_c4_0__1_dispatch           min   0.005 ms   avg   0.007 ms    max   0.272 ms   total   0.037 s [   4940x]
[  0.29%] mtl_k0011_substep_c4_0__2_dispatch           min   0.004 ms   avg   0.006 ms    max   0.082 ms   total   0.028 s [   4940x]
[  0.30%] mtl_k0011_substep_c4_0__3_dispatch           min   0.004 ms   avg   0.006 ms    max   0.075 ms   total   0.029 s [   4940x]
[  0.04%] mtl_k0012_matrix_to_ext_arr_c12_0__0_dispatch     min   0.010 ms   avg   0.015 ms    max   0.162 ms   total   0.004 s [    260x]
[ 49.09%] metal_synchronize                            min   0.065 ms   avg   4.589 ms    max  40.728 ms   total   4.773 s [   1040x]
[  0.25%] mtl_k0013_tensor_to_ext_arr_c8_0__0_dispatch     min   0.029 ms   avg   0.094 ms    max   0.511 ms   total   0.024 s [    260x]
[ 49.04%] gui_show                                     min   0.598 ms   avg  18.340 ms    max  98.685 ms   total   4.768 s [    260x]
2019 MBP 16-inch model:
metal Profiler
[  0.06%] mtl_k0011_substep_c4_0__0_dispatch           min   0.001 ms   avg   0.002 ms    max   0.100 ms   total   0.011 s [   4940x]
[  0.04%] mtl_k0011_substep_c4_0__1_dispatch           min   0.001 ms   avg   0.001 ms    max   0.037 ms   total   0.006 s [   4940x]
[  0.03%] mtl_k0011_substep_c4_0__2_dispatch           min   0.001 ms   avg   0.001 ms    max   0.025 ms   total   0.006 s [   4940x]
[  0.03%] mtl_k0011_substep_c4_0__3_dispatch           min   0.001 ms   avg   0.001 ms    max   0.018 ms   total   0.006 s [   4940x]
[  0.01%] mtl_k0012_matrix_to_ext_arr_c12_0__0_dispatch     min   0.003 ms   avg   0.004 ms    max   0.027 ms   total   0.001 s [    260x]
[ 24.11%] metal_synchronize                            min   0.030 ms   avg   3.862 ms    max  16.688 ms   total   4.017 s [   1040x]
[  0.03%] mtl_k0013_tensor_to_ext_arr_c8_0__0_dispatch     min   0.012 ms   avg   0.017 ms    max   0.032 ms   total   0.004 s [    260x]
[ 75.68%] gui_show                                     min   0.469 ms   avg  48.488 ms    max 119.903 ms   total  12.607 s [    260x]
- For Metal kernel synchronization (equivalent to
cudaDeviceSynchronize()), the average duration of the 2019 model (3.862 ms) was faster than that of the 2015 model (4.589 ms) by about 15%. For max, that's16.688 msvs.40.728 ms. - However, for "gui_show", the 2019 model had an average of 48.488 ms, while the 2015 model's was only
18.340 ms.
Note that this may not be a Mac-only issue. Would be great to share the numbers on gui.show() on other platforms as well!
 k-ye
k-ye
All 6 comments
Can you show the profiler for each line of GUI::update?
 archibate
on 17 Feb 2020
archibate
on 17 Feb 2020
Sure, i will take a look tmr.
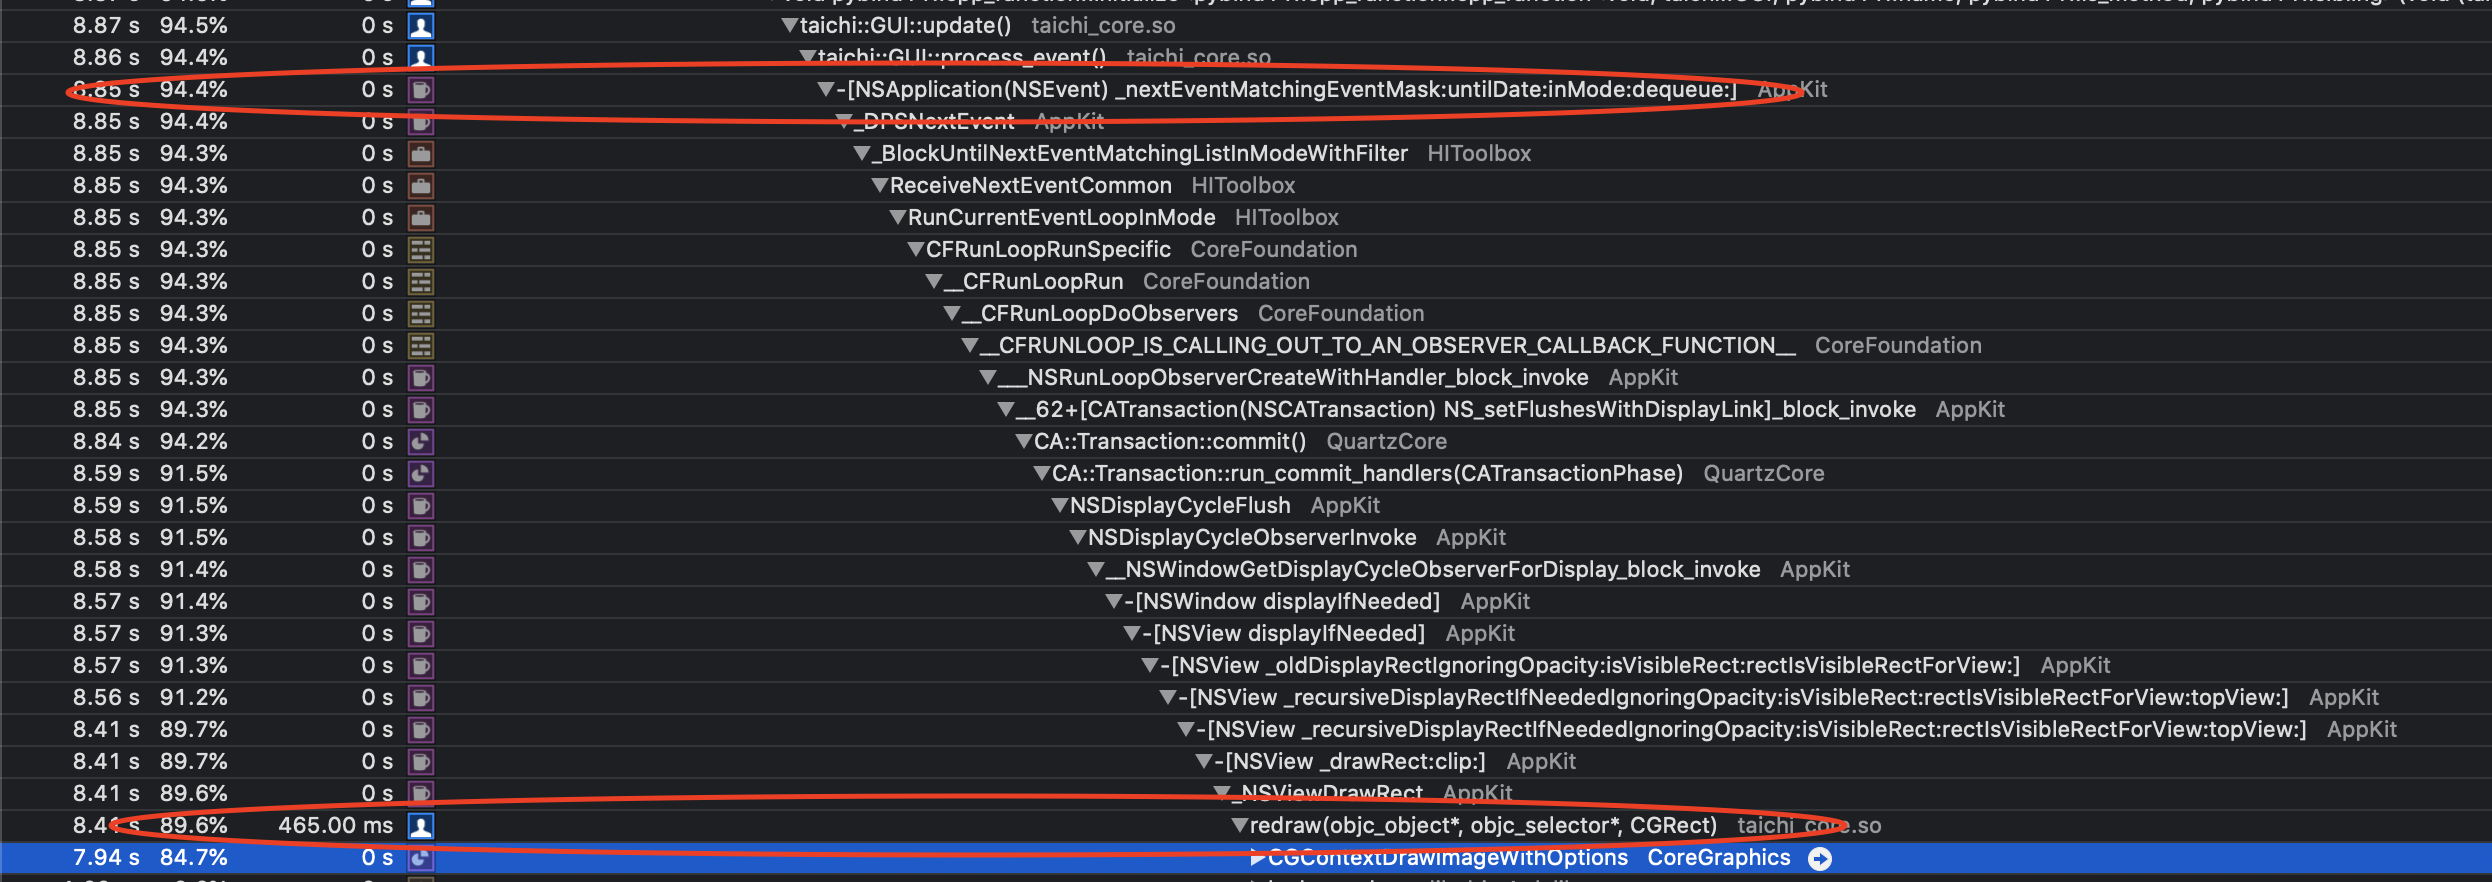
Nvm, i think this is a Mac-specific issue. The bottleneck appears to be nextEventMatchingMask:untilDate:inMode:dequeue:
https://github.com/taichi-dev/taichi/blob/e9466c06b826aaba97b6c1b243e4371a50fa5e28/taichi/gui/cocoa.cpp#L263-L265
k-ye
on 17 Feb 2020
Ha! Seems like the slowness came from our code after examining a deep stack...
k-ye
on 22 Feb 2020
After replacing https://github.com/taichi-dev/taichi/blob/50fa4d60038b29af87c218fb6024cb4bbcefcdb1/taichi/gui/cocoa.cpp#L194 with the approach described in https://stackoverflow.com/a/48310419/12003165, the FPS of mpm99.py on my 2019 MBP16' boosted from 15 to 46.. However, as you can see in the image below, the content is flashing rapidly. That said, we do have a lot of headroom here 🎉
k-ye
on 23 Feb 2020
Great!!!
 yuanming-hu
on 23 Feb 2020
yuanming-hu
on 23 Feb 2020
Closed by #520
k-ye
on 23 Feb 2020
Related issues
 quadpixels
·
3Comments
yuanming-hu
·
3Comments
yuanming-hu
·
3Comments
archibate
·
4Comments
yuanming-hu
·
3Comments
quadpixels
·
3Comments
yuanming-hu
·
3Comments
yuanming-hu
·
3Comments
archibate
·
4Comments
yuanming-hu
·
3Comments
Most helpful comment
After replacing https://github.com/taichi-dev/taichi/blob/50fa4d60038b29af87c218fb6024cb4bbcefcdb1/taichi/gui/cocoa.cpp#L194 with the approach described in https://stackoverflow.com/a/48310419/12003165, the FPS of
mpm99.pyon my 2019 MBP16' boosted from 15 to 46.. However, as you can see in the image below, the content is flashing rapidly. That said, we do have a lot of headroom here 🎉